Is the Crypto Market About to Crash? | Credit: Hameem Sarwar
Share
Key Takeaways
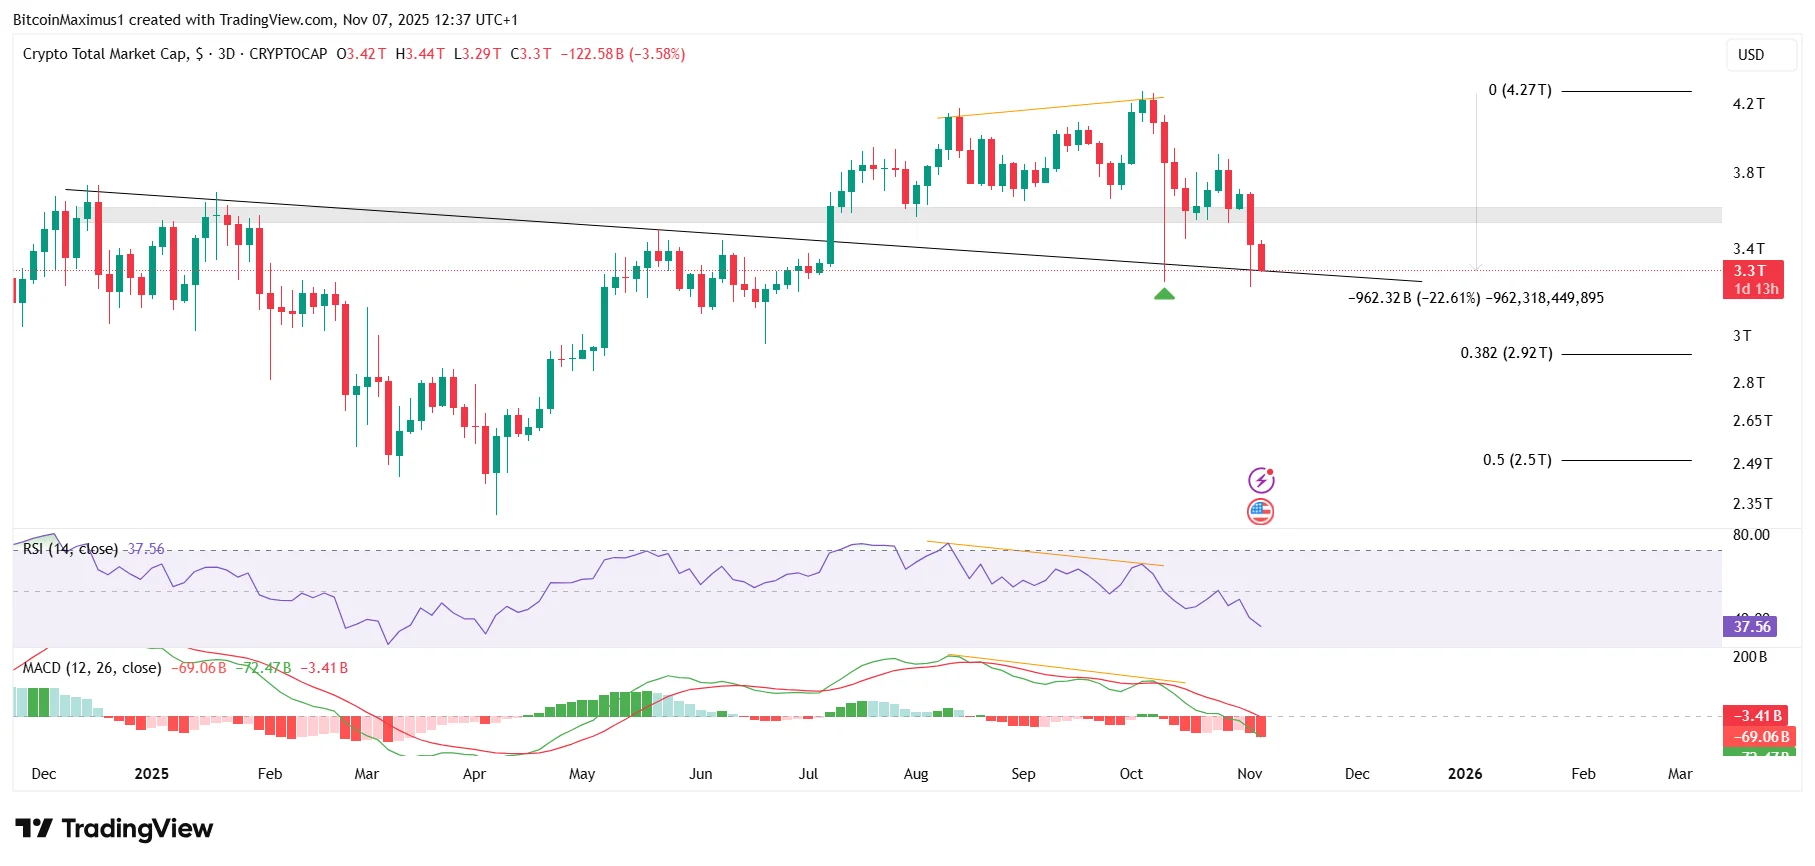
The Crypto Market Cap (TOTALCAP) broke down from the $3.55 trillion support.
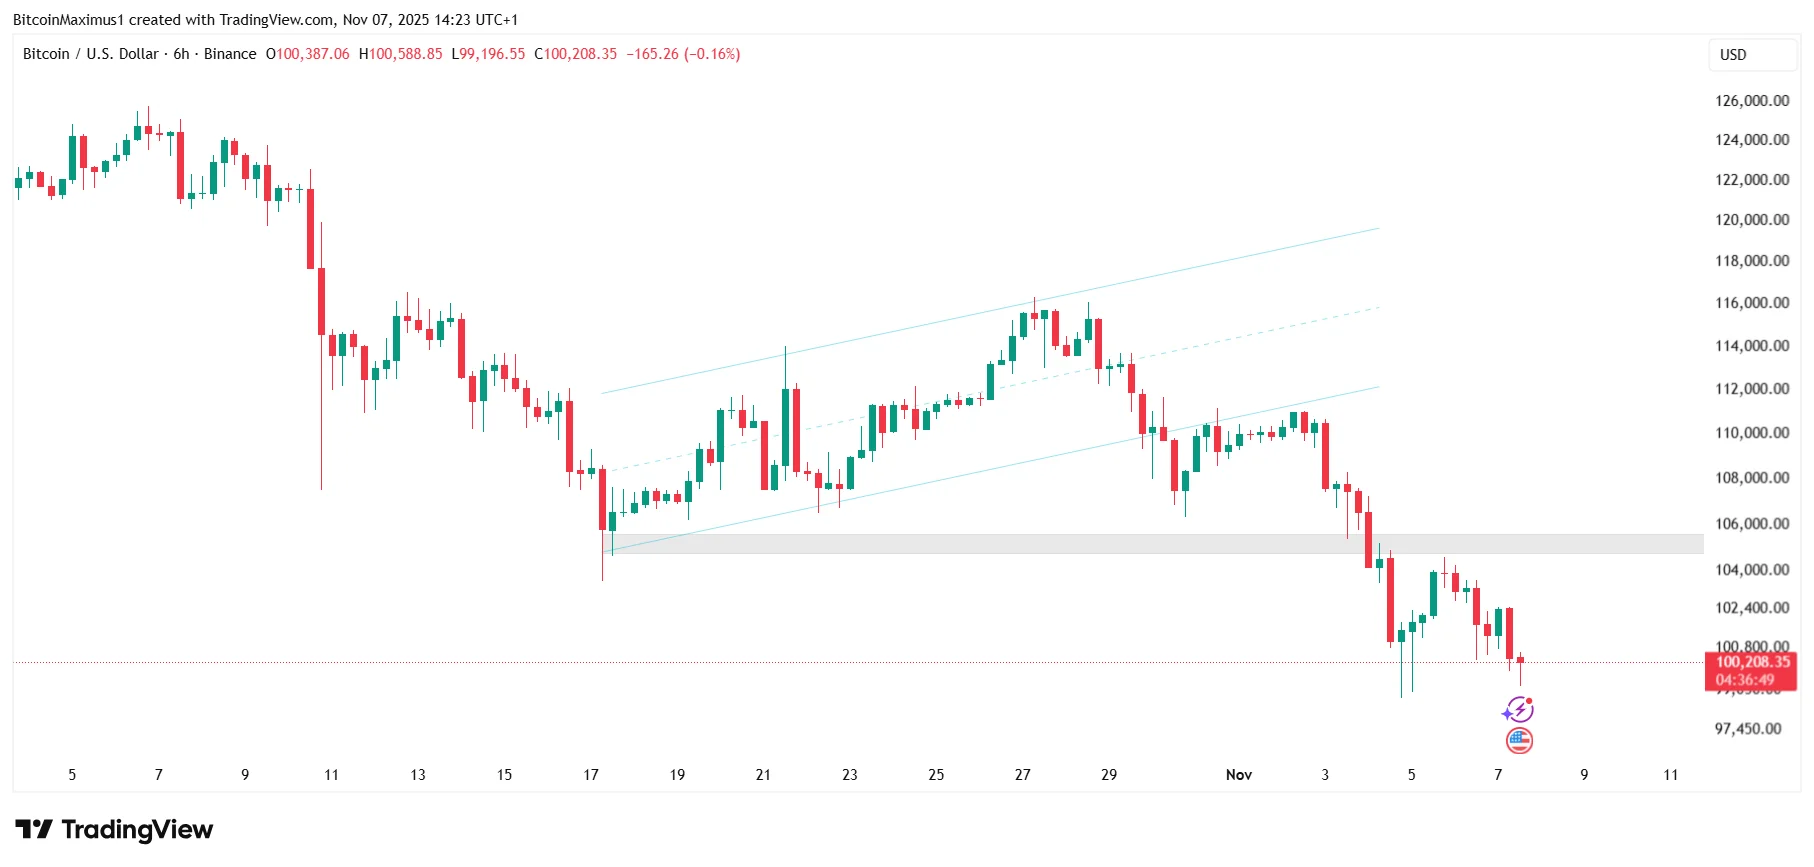
Bitcoin’s (BTC) price fell below the $106,500 long-term horizontal support area.
Altcoins could crash harder than Bitcoin, causing Bitcoin’s dominance to surge.
The crypto market is flashing warning signs as Bitcoin and altcoins struggle to hold key support levels.
Following a 20% decline in the crypto market from its all-time high, bearish signals in the RSI and MACD suggest a deeper correction may be underway.
While a recent bounce gave traders hope, the momentum now appears exhausted, and another breakdown could trigger a significantly steeper decline overall.
Let’s examine the charts and determine the likelihood of an extended crash in the crypto market.
The crypto crash was preceded by bearish divergences in the Relative Strength Index (RSI) and Moving Average Convergence/Divergence (MACD), both signs of a long-term market cycle top.
Shortly after the divergences, the RSI declined below 50 and the MACD turned negative, confirming that bears had taken over.
Get These Top Crypto Casino Offers Now!
Sponsored
Disclosure
We sometimes use affiliate links in our content, when clicking on those we might receive a commission at no extra cost to you. By using this website you agree to our terms and conditions and privacy policy.
However, on Oct. 10, the crypto market bounced, temporarily halting its crash by creating a massive long lower wick (green icon).
The bounce was considered an extremely bullish sign, since it validated the previous diagonal resistance and prevented a breakdown from the $3.55 trillion support area.
Despite the bounce, bullish hopes were dashed today as the market fell below the $3.55 trillion support area again.
While the diagonal support would still be intact, a decisive close below $3.55 could trigger another decline in the crypto market.
Today, the crypto market cap bounced at the diagonal resistance, creating another lower wick.
The short-term outlook confirms that the bounce was corrective, and the trend remains bearish. This is because the TOTALCAP traded inside an ascending parallel channel before breaking down.
The rally was likely corrective, as the channel typically contains corrective movements, and the TOTALCAP bounce ended at the 0.5-0.618 Fibonacci retracement area.
If that happens, the closest Fibonacci support will be at $94,400, but the price of Bitcoin could fall to $85,700, hitting the 0.786 Fibonacci support and a horizontal support area.
Like the rest of the crypto market cap, Bitcoin’s price broke down from an ascending parallel channel and fell below its minor support.
The level has not been reached since April and has negated most of the gains made since that bottom.
This short-term support is close to the long-term $106,500 area, so a breakdown below this level will cause the Bitcoin price to drop below the other.
Because of these readings, the Bitcoin price prediction is bearish. BTC is on the precipice of a massive breakdown that could be confirmed with a weekly close below $106,500.
If that happens, the Bitcoin price could quickly crash to $85,700 – $94,400, hitting its long-term support levels and confirming that the market cycle has ended.
Altcoins Could Crash Soon
The crypto market and Bitcoin suggest that bears have the upper hand, but the charts pale into comparison to how bearish the altcoin market capitalization looks.
The altcoin market cap has all the signs of an impending price collapse that has just begun.
Firstly, the ALTCAP shows a completed five-wave upward movement (green) with an extended third wave (black).
The upward movement began in June 2022, encompassing the entire bull market, which has seemingly ended.
Secondly, the ALTCAP deviated above the all-time high resistance of $1.60 trillion before breaking below it. Such deviations often lead to significant movements in the other direction.
Moreover, the RSI and MACD generated bearish divergences (orange) that confirm the bearish trend reversal, especially considering the RSI is at 50 and the MACD has made a bearish cross.
Finally, the ALTCAP movement is contained inside an ascending parallel channel, making a breakdown likely to follow.
Hence, altcoins could go down until they reach the channel’s support trend line at $1.20 trillion area, and a possible breakdown below it could take the
BTC Dominance Increases
The Bitcoin Dominance chart shows a decline since the cycle high of 66% in June, ending with a low of 57.17% on Sept. 13.
The BTCD has surged since, briefly reaching a high of 63.48% before falling, leaving a long upper wick in its wake (red icon).
However, Bitcoin’s dominance has surged again and broke out from the 60.55% resistance, which is both a Fibonacci and horizontal resistance level.
As a result, Bitcoin’s dominance may have reached its temporary bottom and could continue to surge for the rest of the year.
Bearish Trend Ahead
If the total crypto market cap breaks decisively below $3.55 trillion, it would confirm that the bullish cycle has topped and a prolonged correction phase has begun.
Bitcoin could crash to $85,000, while altcoins could decline at an increasingly steep pace, breaking down from their long-term corrective pattern that has been ongoing for several years.
Unless bulls manage to reverse the trend, crypto traders are likely to suffer further losses throughout the year.
Disclaimer:
The information provided in this article is for informational purposes only. It is not intended to be, nor should it be construed as, financial advice. We do not make any warranties regarding the completeness, reliability, or accuracy of this information. All investments involve risk, and past performance does not guarantee future results. We recommend consulting a financial advisor before making any investment decisions.
Valdrin Tahiri is a cryptocurrency analyst and reporter at CCN, specializing in technical analysis with a focus on Elliott Wave theory, on-chain metrics, and fundamental research. He brings over seven years of experience in the crypto space as both a trader and writer.
He discovered cryptocurrencies in 2017 while earning his MSc in Financial Markets at the Barcelona School of Economics, which sparked a deep interest in blockchain and market dynamics. Since then, he’s contributed to top crypto outlets like BeInCrypto and CoinGape.
Valdrin also served as Community Manager of BeInCrypto’s Telegram group for three years, helping grow it into one of the largest crypto communities worldwide. His expertise in market structure and price patterns allows him to break down complex trends into clear, actionable insights.
He’s published thousands of articles covering altcoins, Bitcoin cycles, and macro trends.