Bitcoin (BTC) closed below its 50-week Moving Average (MA), historically a major bearish signal.
This bearish signal previously marked the end of Bitcoin’s bullish cycle and evaporated confidence.
Will the same nosedive plunge happen this time around, or will the Bitcoin price reverse trend?
Bitcoin is falling hard again, and the latest weekly close has triggered one of the most critical long term warning signals.
Bitcoin has just closed below the 50-week moving average, a level it had held throughout the entire bull market.
Every time BTC has lost this level in the past, the bull cycle has ended, and a prolonged downtrend has followed.
Momentum indicators have also flipped sharply negative.
RSI is sliding, MACD is crossing down, and price action is rolling over exactly as it did during previous cycle tops.
That is why Bitcoin is going down and why traders are now watching for signs of a deeper breakdown.
Bitcoin’s Bearish Long-Term Signal
Bitcoin’s weekly price action continues to unravel, with last week’s and this week’s 22% decline exacerbating the trend.
While Bitcoin had traded above its 50-week Moving Average (MA) throughout the entire bull market, it fell below it decisively last week.
After four previous bounces, the breakdown suggests that Bitcoin’s bull cycle has ended and the price has begun a bear market.
Get These Top Crypto Casino Offers Now!
Sponsored
Disclosure
We sometimes use affiliate links in our content, when clicking on those we might receive a commission at no extra cost to you. By using this website you agree to our terms and conditions and privacy policy.
If that is the case, the main horizontal and Fibonacci support will be at $70,900, created by the 0.5 Fibonacci retracement support level and a horizontal support area.
Besides the price action, here’s why Bitcoin is going down: Momentum indicators are bearish.
The Relative Strength Index (RSI) and Moving Average Convergence/Divergence (MACD) created bearish divergences (orange) near the all-time high.
These divergences often mark the peak of upward movements, and the subsequent decrease since the all-time high suggests that this may have been the case.
Combining these three indicators alongside the price action gives a highly bearish signal that confirmed the end of the bull market last cycle.
More specifically, a Bitcoin price close below the 50-week MA alongside an RSI decline below 50 and a MACD drop into negative territory occurred in January 2022.
While the BTC price eventually bounced and reached the 50-week MA (black circle) again, that was a dead cat bounce as BTC eventually declined by another 67% since the bearish cross.
A similar drop today would place Bitcoin near the $35,000 region. While nothing is guaranteed, the market structure strongly suggests the bull cycle has finished.
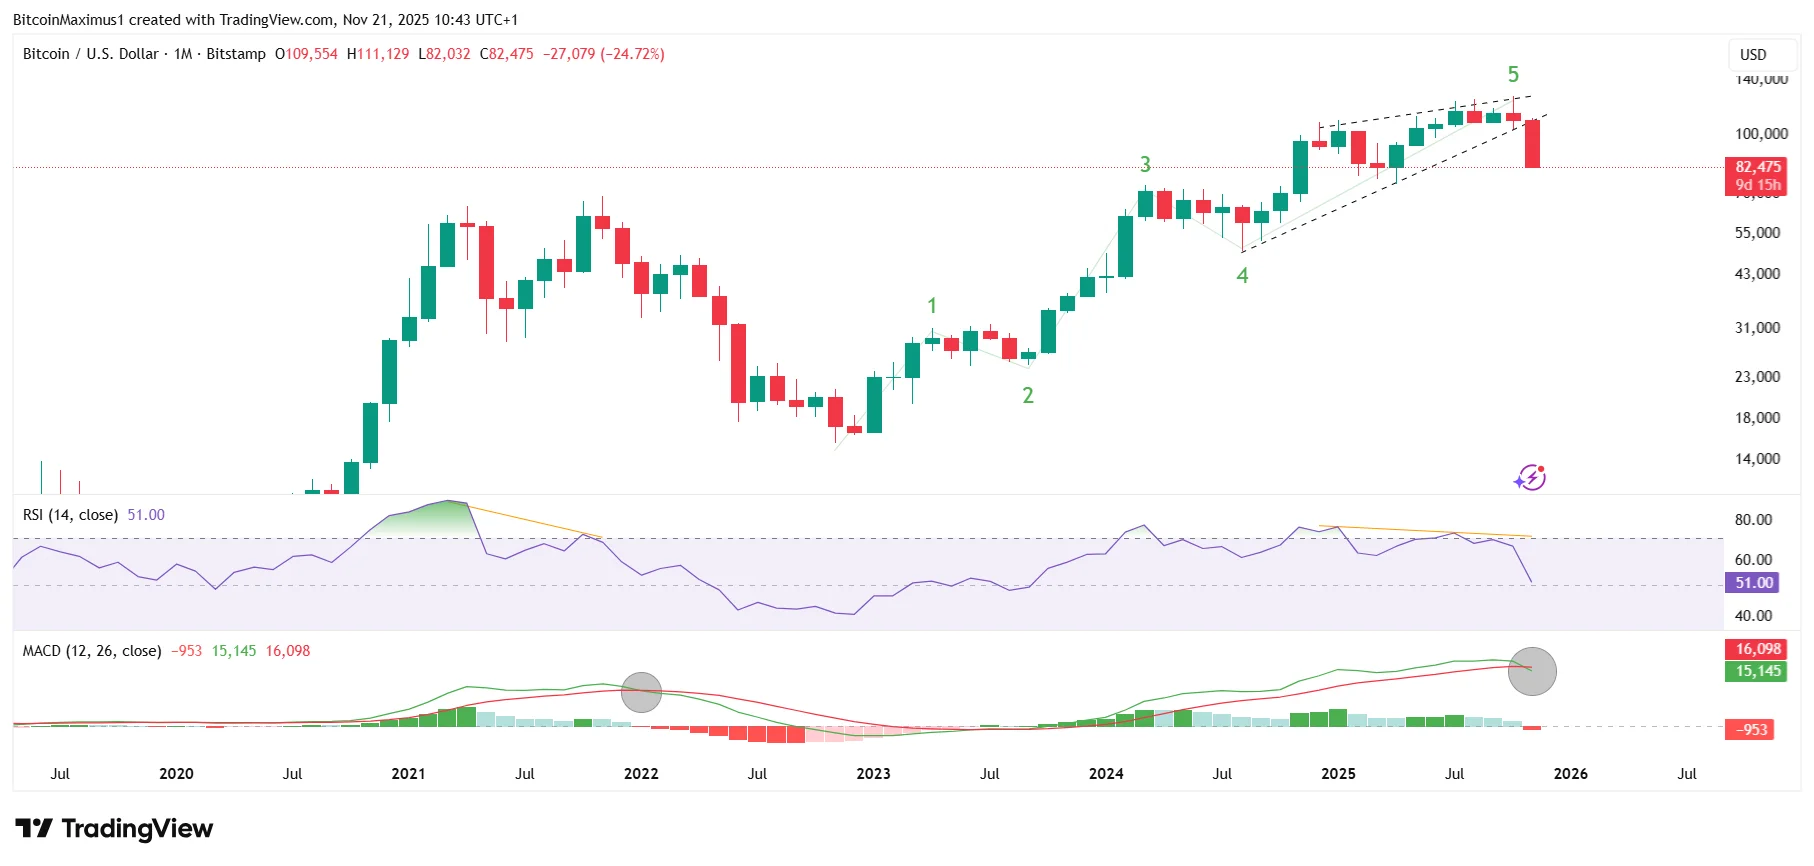
Bitcoin’s Long-Term Price Action
The wave count aligns perfectly with the bearish Bitcoin price action and indicators, confirming the market cycle has ended.
According to the count, the price of Bitcoin has completed a five-wave upward movement since the cycle low.
Additionally, wave three has 1.61 times the length of wave one, a likely target for a bounce.
However, the lack of bullish divergences in the RSI and MACD is worrying, so a full blown bullish trend reversal is unlikely.
Macro Breakdown as Saylor Nears Break-Even
Here’s where things get worse: Technical analysis is not the only thing that suggests Bitcoin price will go down.
The MicroStrategy (MSTR) stock price has fallen below its Net Asset Value (NAV), and Michael Saylor’s BTC holdings are close to their break-even price.
Combined with the macro drivers such as the crashing U.S. stock market and liquidity crisis, traders should be concerned about Bitcoin’s future.
So, the weekly and monthly time frame readings align with the macro picture, giving a bearish Bitcoin prediction.
If history repeats, it will mean that BTC has finished its bull cycle, and a bear market will follow in 2026.
Traders are now watching for the next support levels that could put an end to the decline.
As long as RSI stays below 50, MACD remains negative, and the price stays under key resistance levels, the chart leans toward a prolonged bearish trend.
If Bitcoin follows its historical cycle behavior, the next major bull phase is unlikely to begin until 2026, meaning the market may already be walking into its next extended bear period.
For now, every major indicator points the same direction. That is why Bitcoin is going down and why risk remains elevated until the price reclaims critical support.
Disclaimer:
The information provided in this article is for informational purposes only. It is not intended to be, nor should it be construed as, financial advice. We do not make any warranties regarding the completeness, reliability, or accuracy of this information. All investments involve risk, and past performance does not guarantee future results. We recommend consulting a financial advisor before making any investment decisions.
Valdrin Tahiri is a cryptocurrency analyst and reporter at CCN, specializing in technical analysis with a focus on Elliott Wave theory, on-chain metrics, and fundamental research. He brings over seven years of experience in the crypto space as both a trader and writer.
He discovered cryptocurrencies in 2017 while earning his MSc in Financial Markets at the Barcelona School of Economics, which sparked a deep interest in blockchain and market dynamics. Since then, he’s contributed to top crypto outlets like BeInCrypto and CoinGape.
Valdrin also served as Community Manager of BeInCrypto’s Telegram group for three years, helping grow it into one of the largest crypto communities worldwide. His expertise in market structure and price patterns allows him to break down complex trends into clear, actionable insights.
He’s published thousands of articles covering altcoins, Bitcoin cycles, and macro trends.