How Long Will Bitcoin's Bounce Continue? | Credit: Derek Fenech
Share
Key Takeaways
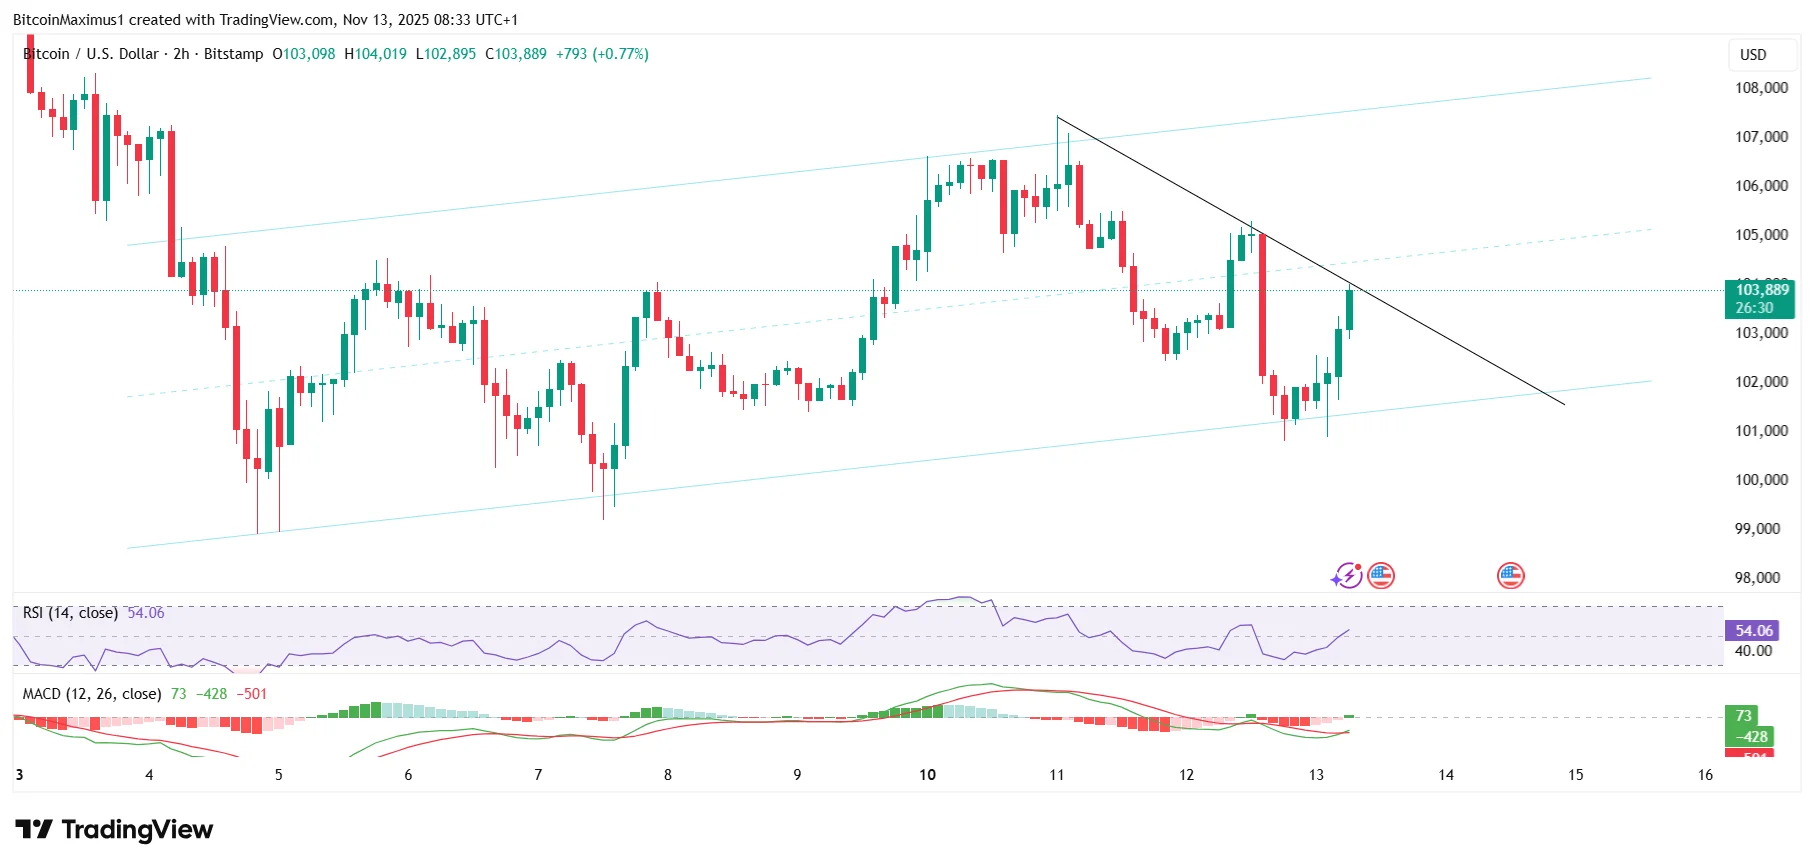
Bitcoin (BTC) is trading within a short-term ascending parallel channel.
Short-term indicators are bullish, but long-term ones are bearish.
How will Bitcoin’s price perform the rest of the year and then in 2026?
After weeks of selling pressure, BTC has carved out a short-term ascending channel, hinting at a possible relief rally.
Momentum indicators are turning higher, supporting the short-term move.
Still, the broader picture remains murky.
Key resistance near $108,000 continues to cap upward momentum, and long-term charts are far from bullish.
With mixed signals across multiple time frames, traders are watching closely to see whether Bitcoin can end the year on a high note or if this bounce is just a pause before another leg down.
Such channels typically represent corrective movements, not impulsive breakouts. This means that the current rise could simply be a pause before another potential decline.
Still, BTC found support at the channel’s lower trendline (green icon) and has since pushed higher.
As of writing, the price is testing both a diagonal resistance and the channel’s midline. A breakout from here could open the path toward the upper boundary of the channel.
Get These Top Crypto Casino Offers Now!
Sponsored
Disclosure
We sometimes use affiliate links in our content, when clicking on those we might receive a commission at no extra cost to you. By using this website you agree to our terms and conditions and privacy policy.
If the price breaks out above current resistance levels, Bitcoin may aim for $108,000 as the next test — a zone that continues to distinguish short-term relief from a true trend reversal.
Bitcoin’s Bearish Wave Count
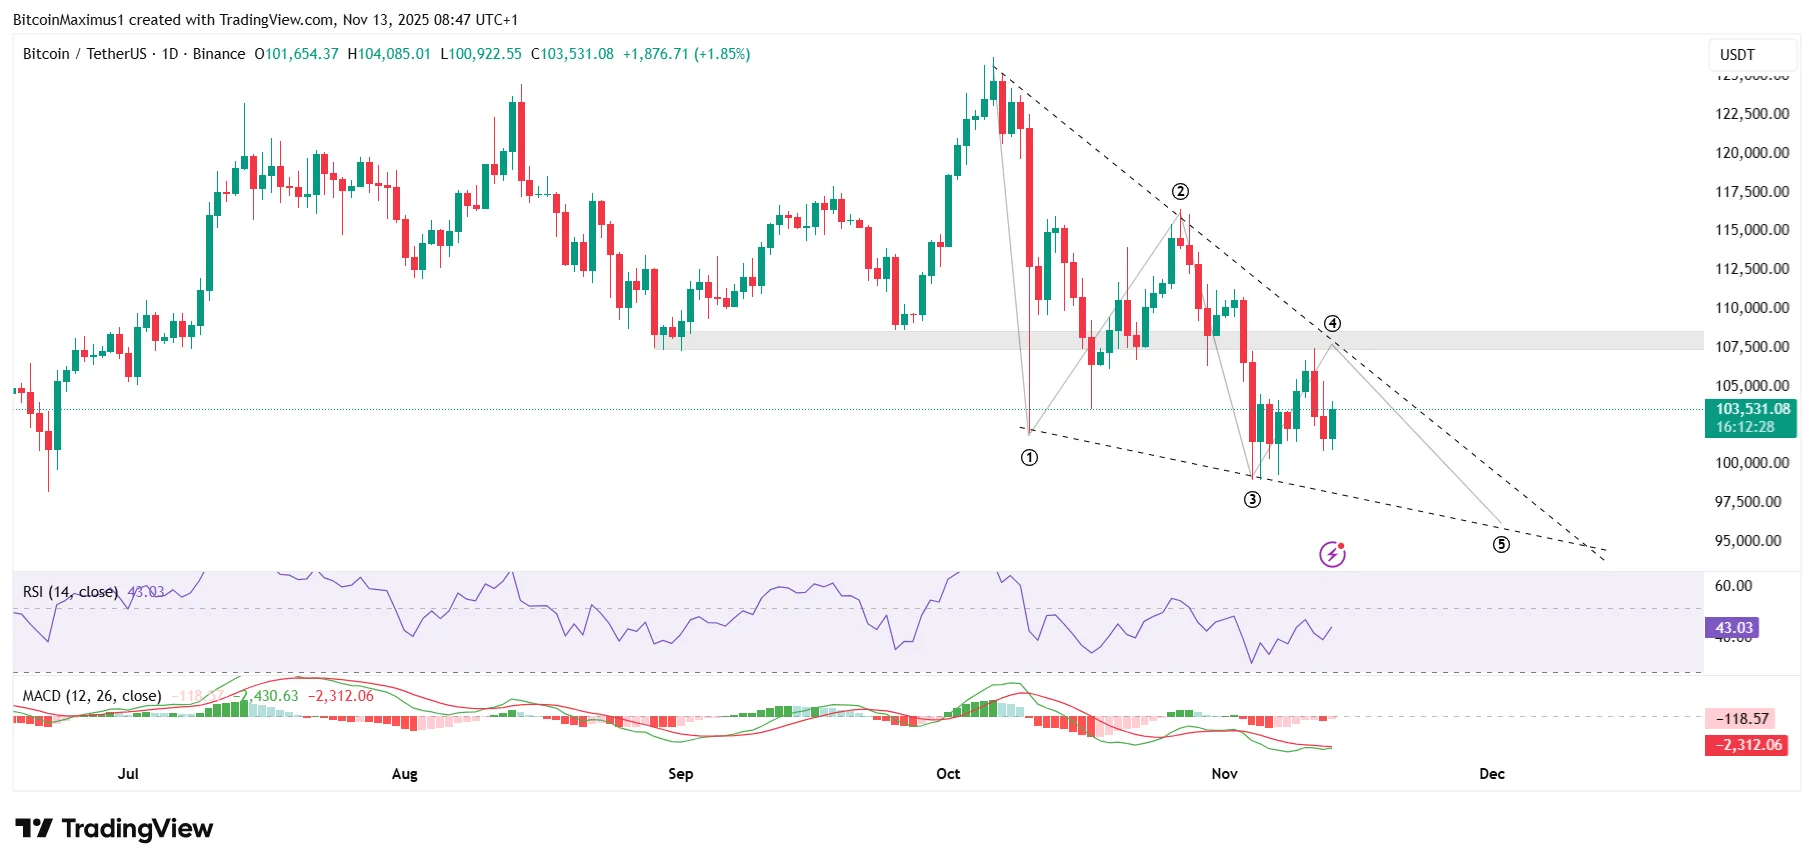
The daily time frame price action shows that Bitcoin has fallen inside a descending wedge.
The most likely wave count inside a descending wedge is a five-wave decrease (black), where Bitcoin is in wave four.
While it is unclear whether wave four is over, BTC is unlikely to clear the $108,000 resistance, which is both a horizontal and diagonal resistance level.
Similar to the 2-hour time frame, the daily RSI and MACD are increasing, but neither has yet generated any bearish divergence.
As a result, Bitcoin’s price is unlikely to close above $108,000. In the most bullish scenario, it would retest the area again, aligning with the short-term channel, before falling to new lows again.
Why is Bitcoin Going Down?
Bitcoin’s long-term technical analysis is even more bearish than the short-term one.
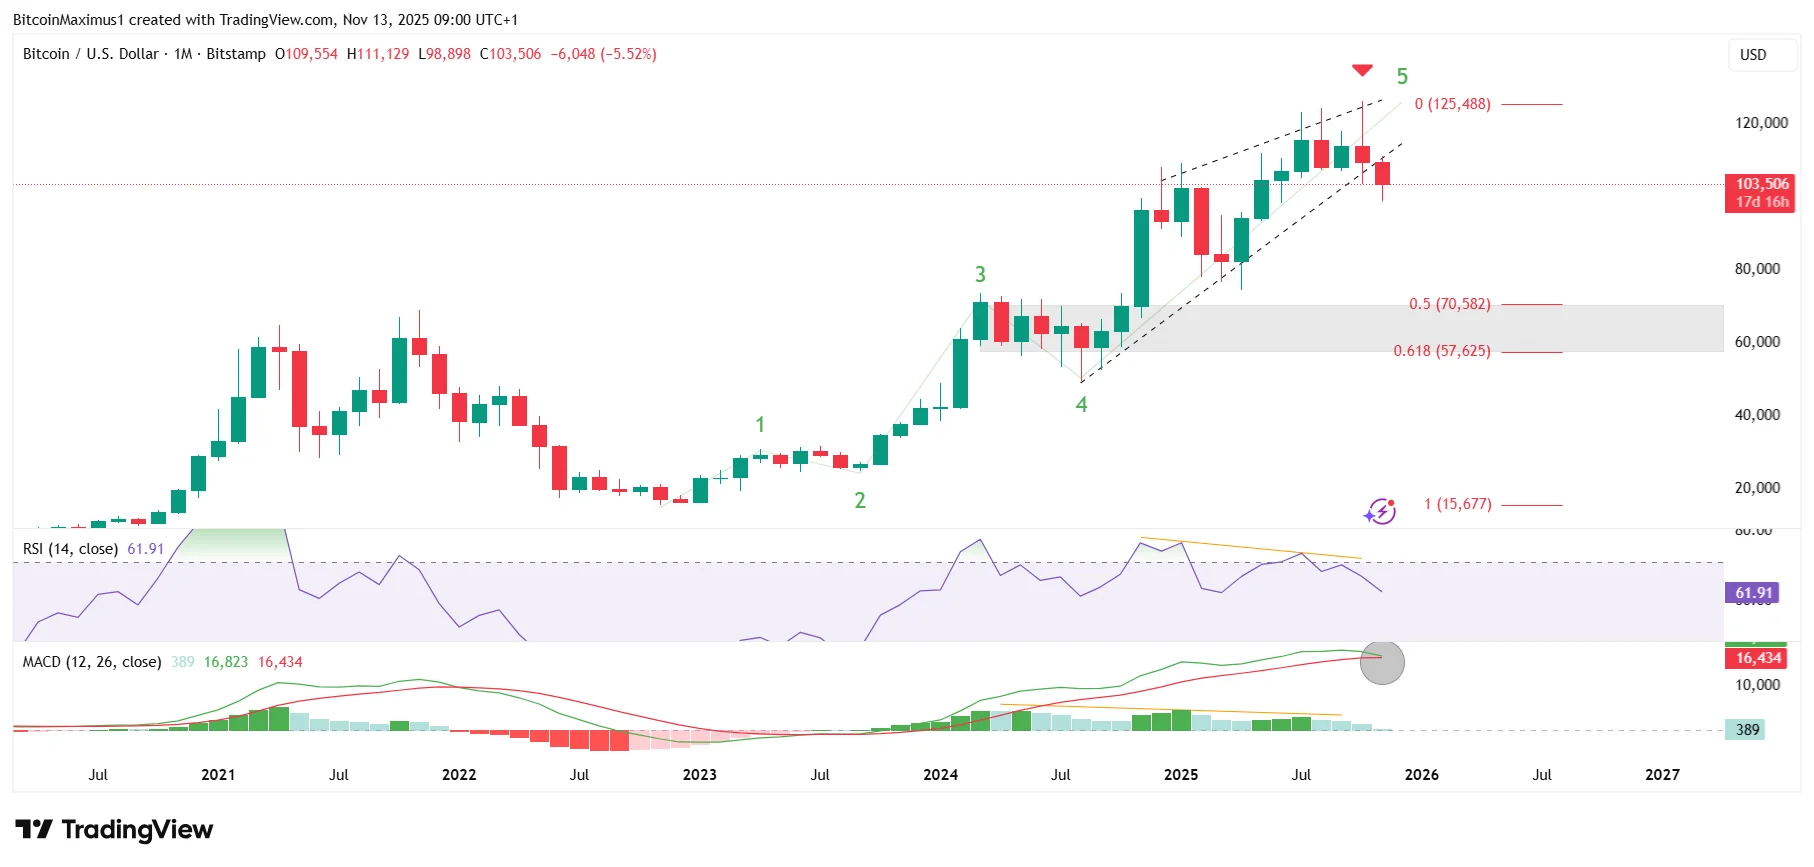
Starting with the monthly time frame, the price of Bitcoin created a bearish candlestick in October (red icon), and is currently breaking down from a long-term ascending wedge.
The wedge contains an ending diagonal for wave five, so a breakdown from there means that the market cycle has ended.
If that is the case, the closest horizontal and Fibonacci support levels will be located between $57,600 and $70,600.
The monthly RSI and MACD have generated bearish divergences, a sign that has always marked the top of the market cycle.
Additionally, the MACD is forming a bearish cross (black circle), which will confirm the breakdown of the wedge.
Hence, all signs point to the end of the Bitcoin market cycle.
The weekly time frame readings corroborate this, showing that the price of Bitcoin has broken down from the $108,000 horizontal area, which was expected to provide support.
Now, the area will likely act as resistance as the price of Bitcoin falls toward the horizontal and Fibonacci support at $85,470.
The bearish divergences and trends in the RSI and MACD align with this prediction, pointing to new lows ahead.
Therefore, while the short-term price action suggests a bounce may be possible, the long-term Bitcoin chart indicates that new lows are likely to occur soon.
Short- and Long-Term Trends Diverge
While Bitcoin may push toward the channel’s upper boundary in the short term, the charts suggest that any upside remains corrective for now.
The long-term price analysis remains bearish, supported by Bitcoin breakdowns from major structures and bearish divergences.
As long as BTC stays below $108,000, a deeper downside remains the most probable scenario, and market participants should prepare accordingly.
Disclaimer:
The information provided in this article is for informational purposes only. It is not intended to be, nor should it be construed as, financial advice. We do not make any warranties regarding the completeness, reliability, or accuracy of this information. All investments involve risk, and past performance does not guarantee future results. We recommend consulting a financial advisor before making any investment decisions.
Valdrin Tahiri is a cryptocurrency analyst and reporter at CCN, specializing in technical analysis with a focus on Elliott Wave theory, on-chain metrics, and fundamental research. He brings over seven years of experience in the crypto space as both a trader and writer.
He discovered cryptocurrencies in 2017 while earning his MSc in Financial Markets at the Barcelona School of Economics, which sparked a deep interest in blockchain and market dynamics. Since then, he’s contributed to top crypto outlets like BeInCrypto and CoinGape.
Valdrin also served as Community Manager of BeInCrypto’s Telegram group for three years, helping grow it into one of the largest crypto communities worldwide. His expertise in market structure and price patterns allows him to break down complex trends into clear, actionable insights.
He’s published thousands of articles covering altcoins, Bitcoin cycles, and macro trends.
Insha Zia is the News Editor at CCN. Based in Dubai, United Arab Emirates, he ensures the CCN newsroom provides value to readers by educating, informing, and engaging them with accurate and timely coverage.
Before joining CCN, Insha was a Senior Journalist at DailyCoin, where his career in crypto journalism took off. At DailyCoin he garnered ample experience by covering some of the biggest news in the crypto industry, especially in the Cardano ecosystem, and maintain solid relations with KOLs in the industry.
Insha has worked as a ghostwriter and a developer for three years. He has co-authored numerous articles in reputable publications, including Hackernoon, Yahoo Finance, and Nasdaq. He also has experience as a Solidity Developer and a Data Analyst.
Insha’s developer and journalist backgrounds go hand in hand when educating readers on technically complex concepts within the crypto space. He values accuracy, transparency, and delivering valuable insights to his readers.
Insha firmly believes education can propel the mass adoption of the crypto space. He is committed to giving CCN readers a greater understanding of the technology using his technical background.
Insha earned a Bachelor of Science in Computer Systems Engineering at the University of Engineering and Technology, Peshawar, in 2022. His technical foundation includes expertise in quantitative and qualitative research, data analysis, programming languages, and cybersecurity.
His comprehensive skill set enables him to communicate complex concepts to crypto readers with authority and clarity, making his articles both informative and engaging for his audience.
Insha is determined to take CCN to the top of the industry. When he’s not working on his next article or editing, Insha enjoys playing video games, mainly in FPS and MMORPG genres. He also loves playing soccer and has supported Arsenal since he was six.