Will XLM Break Down From the $0.23 Support? | Credit: Hameem Sarwar
Share
Key Takeaways
Stellar’s (XLM) price bounced at the $0.160 horizontal support area.
XLM fell after a rejection from a diagonal resistance trend line in August.
Will XLM break down, or can it begin a belated bullish trend reversal?
Stellar (XLM) narrowly avoided a major breakdown in October, bouncing off the key $0.160 support level after forming a long lower wick on the chart.
While bulls managed to defend that price floor, momentum has since faded, leaving traders to wonder if another leg down is on the way.
With $0.160 now the critical line separating stability from another slide, all eyes are on whether XLM can hold its ground into year-end.
Why Is XLM Going Down?
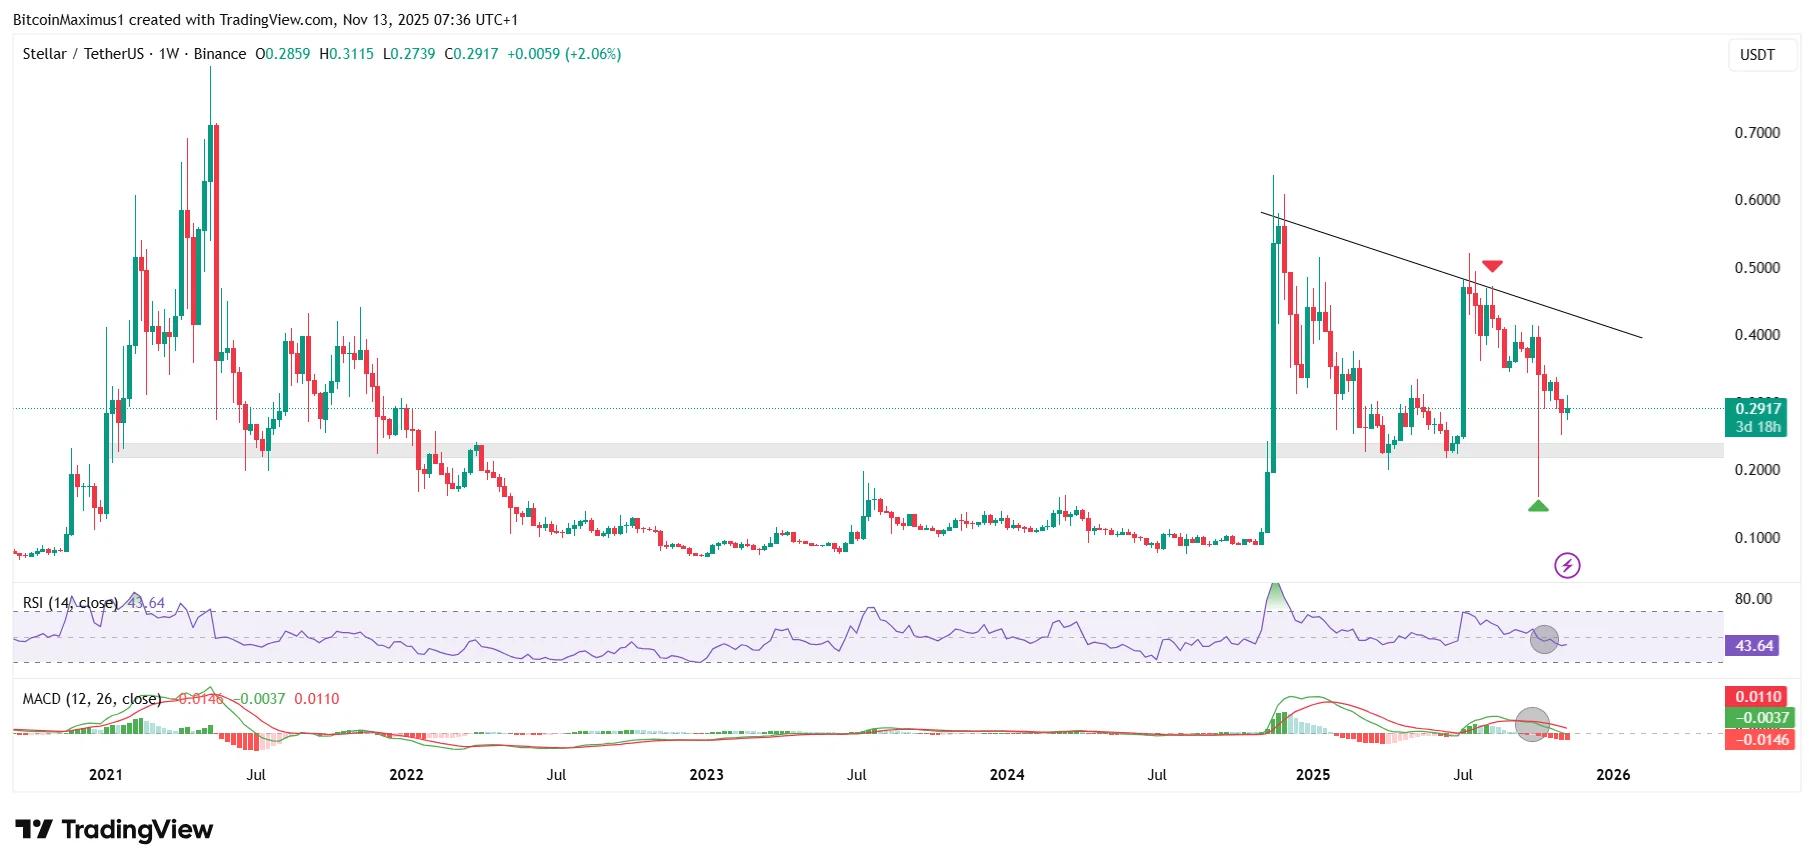
After reaching a cycle high of $0.64 in November, XLM has been stuck in a prolonged downtrend, tracing a descending resistance line that has capped every rebound since.
Multiple rejection attempts, the latest in August 2025, only accelerated the sell-off, with the token repeatedly posting lower highs before tumbling in October.
Following the drop, XLM found temporary relief at $0.160, where a sharp bounce formed a long lower wick (green icon) that stopped the decline from deepening below $0.230.
Get These Top Crypto Casino Offers Now!
Sponsored
Disclosure
We sometimes use affiliate links in our content, when clicking on those we might receive a commission at no extra cost to you. By using this website you agree to our terms and conditions and privacy policy.
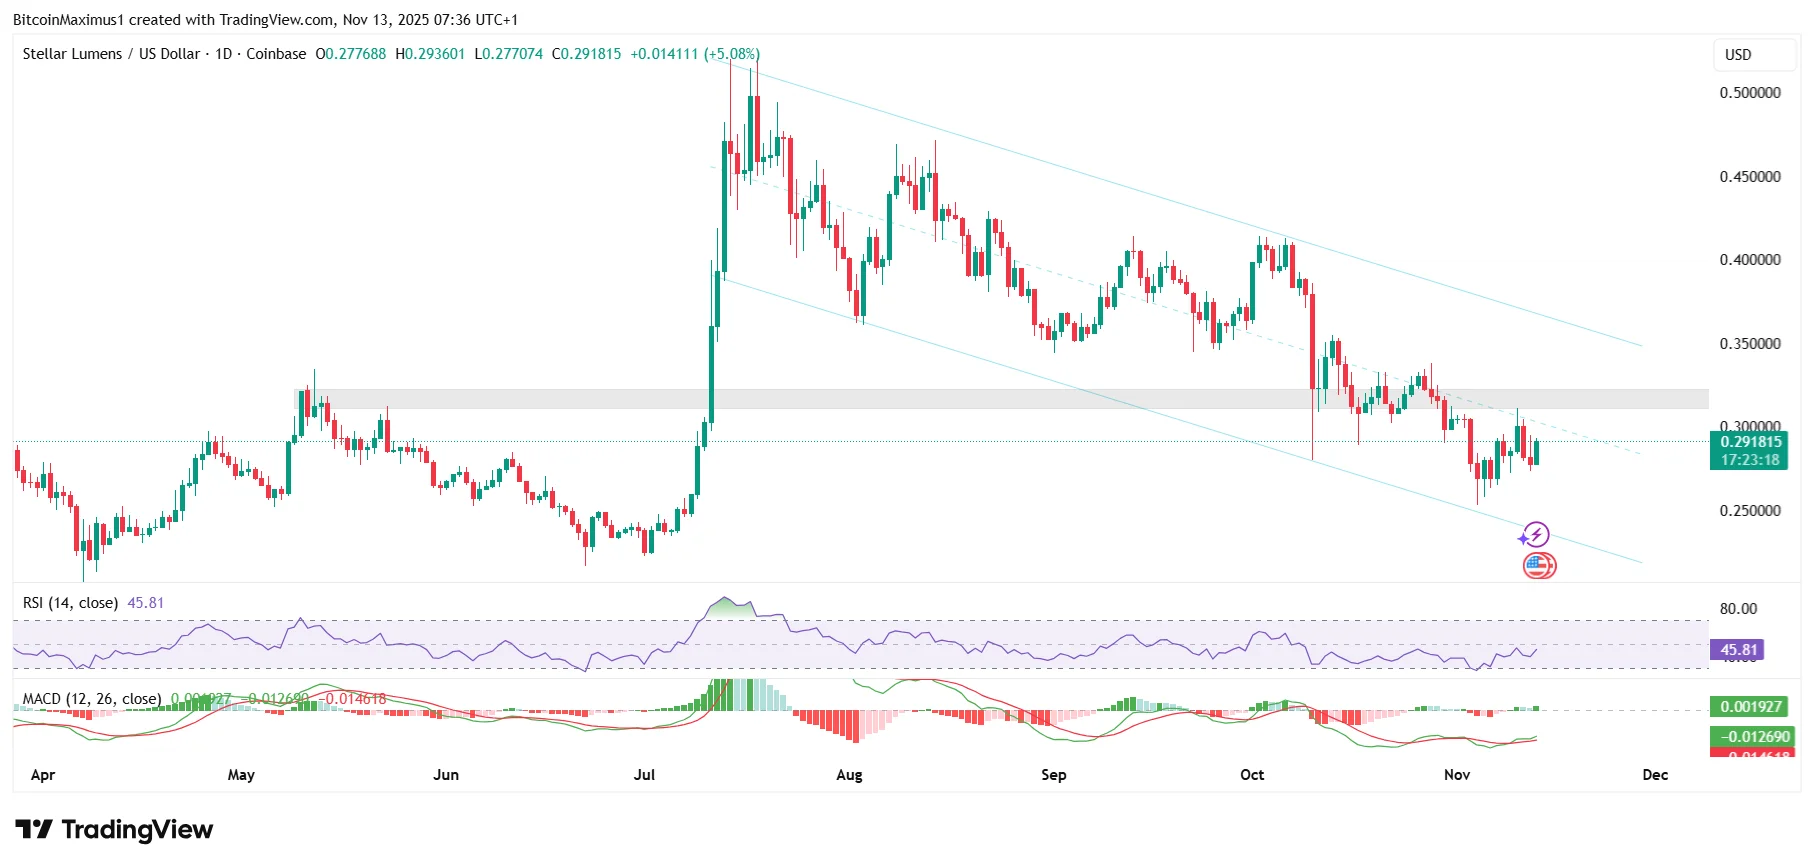
The token failed to build sustained momentum and now hovers once again near the $0.230 zone, testing whether buyers still have the conviction to hold the line.
Alternatively, a breakdown of XLM below the $0.23 support area could trigger a significant price decline, potentially leading to new lows and echoing the rest of the crypto market.
Disclaimer:
The information provided in this article is for informational purposes only. It is not intended to be, nor should it be construed as, financial advice. We do not make any warranties regarding the completeness, reliability, or accuracy of this information. All investments involve risk, and past performance does not guarantee future results. We recommend consulting a financial advisor before making any investment decisions.
Valdrin Tahiri is a cryptocurrency analyst and reporter at CCN, specializing in technical analysis with a focus on Elliott Wave theory, on-chain metrics, and fundamental research. He brings over seven years of experience in the crypto space as both a trader and writer.
He discovered cryptocurrencies in 2017 while earning his MSc in Financial Markets at the Barcelona School of Economics, which sparked a deep interest in blockchain and market dynamics. Since then, he’s contributed to top crypto outlets like BeInCrypto and CoinGape.
Valdrin also served as Community Manager of BeInCrypto’s Telegram group for three years, helping grow it into one of the largest crypto communities worldwide. His expertise in market structure and price patterns allows him to break down complex trends into clear, actionable insights.
He’s published thousands of articles covering altcoins, Bitcoin cycles, and macro trends.