Here is why CFG's price could retest its all-time high | Credit: Veronica Cestari
Share
Key Takeaways
deSPXA launch on Base has boosted CFG’s sentiment and demand, driving the price higher.
Centrifuge’s price has approached the key $0.26 resistance zone, with a confirmed breakout.
Bullish momentum remains dominant, but overbought conditions increase the likelihood of a pullback.
CFG, the native cryptocurrency of institutional-grade tokenization platform Centrifuge, has seen its price increase.
Over the past 30 days, the Centrifuge price has surged by 76%. As a result, the altcoin is now 40% from retesting its all-time high.
This happened after the project disclosed that its users can now accumulate the tokenized S&P 500 Index.
But what else does that mean for the CFG price?
Centrifuge Extends Rally
CFG is pushing higher again. Price has surged toward a key resistance zone. Momentum is strong.
However, warning signs are beginning to emerge. As a result, traders are now watching closely for either a breakout or a sharp pullback.
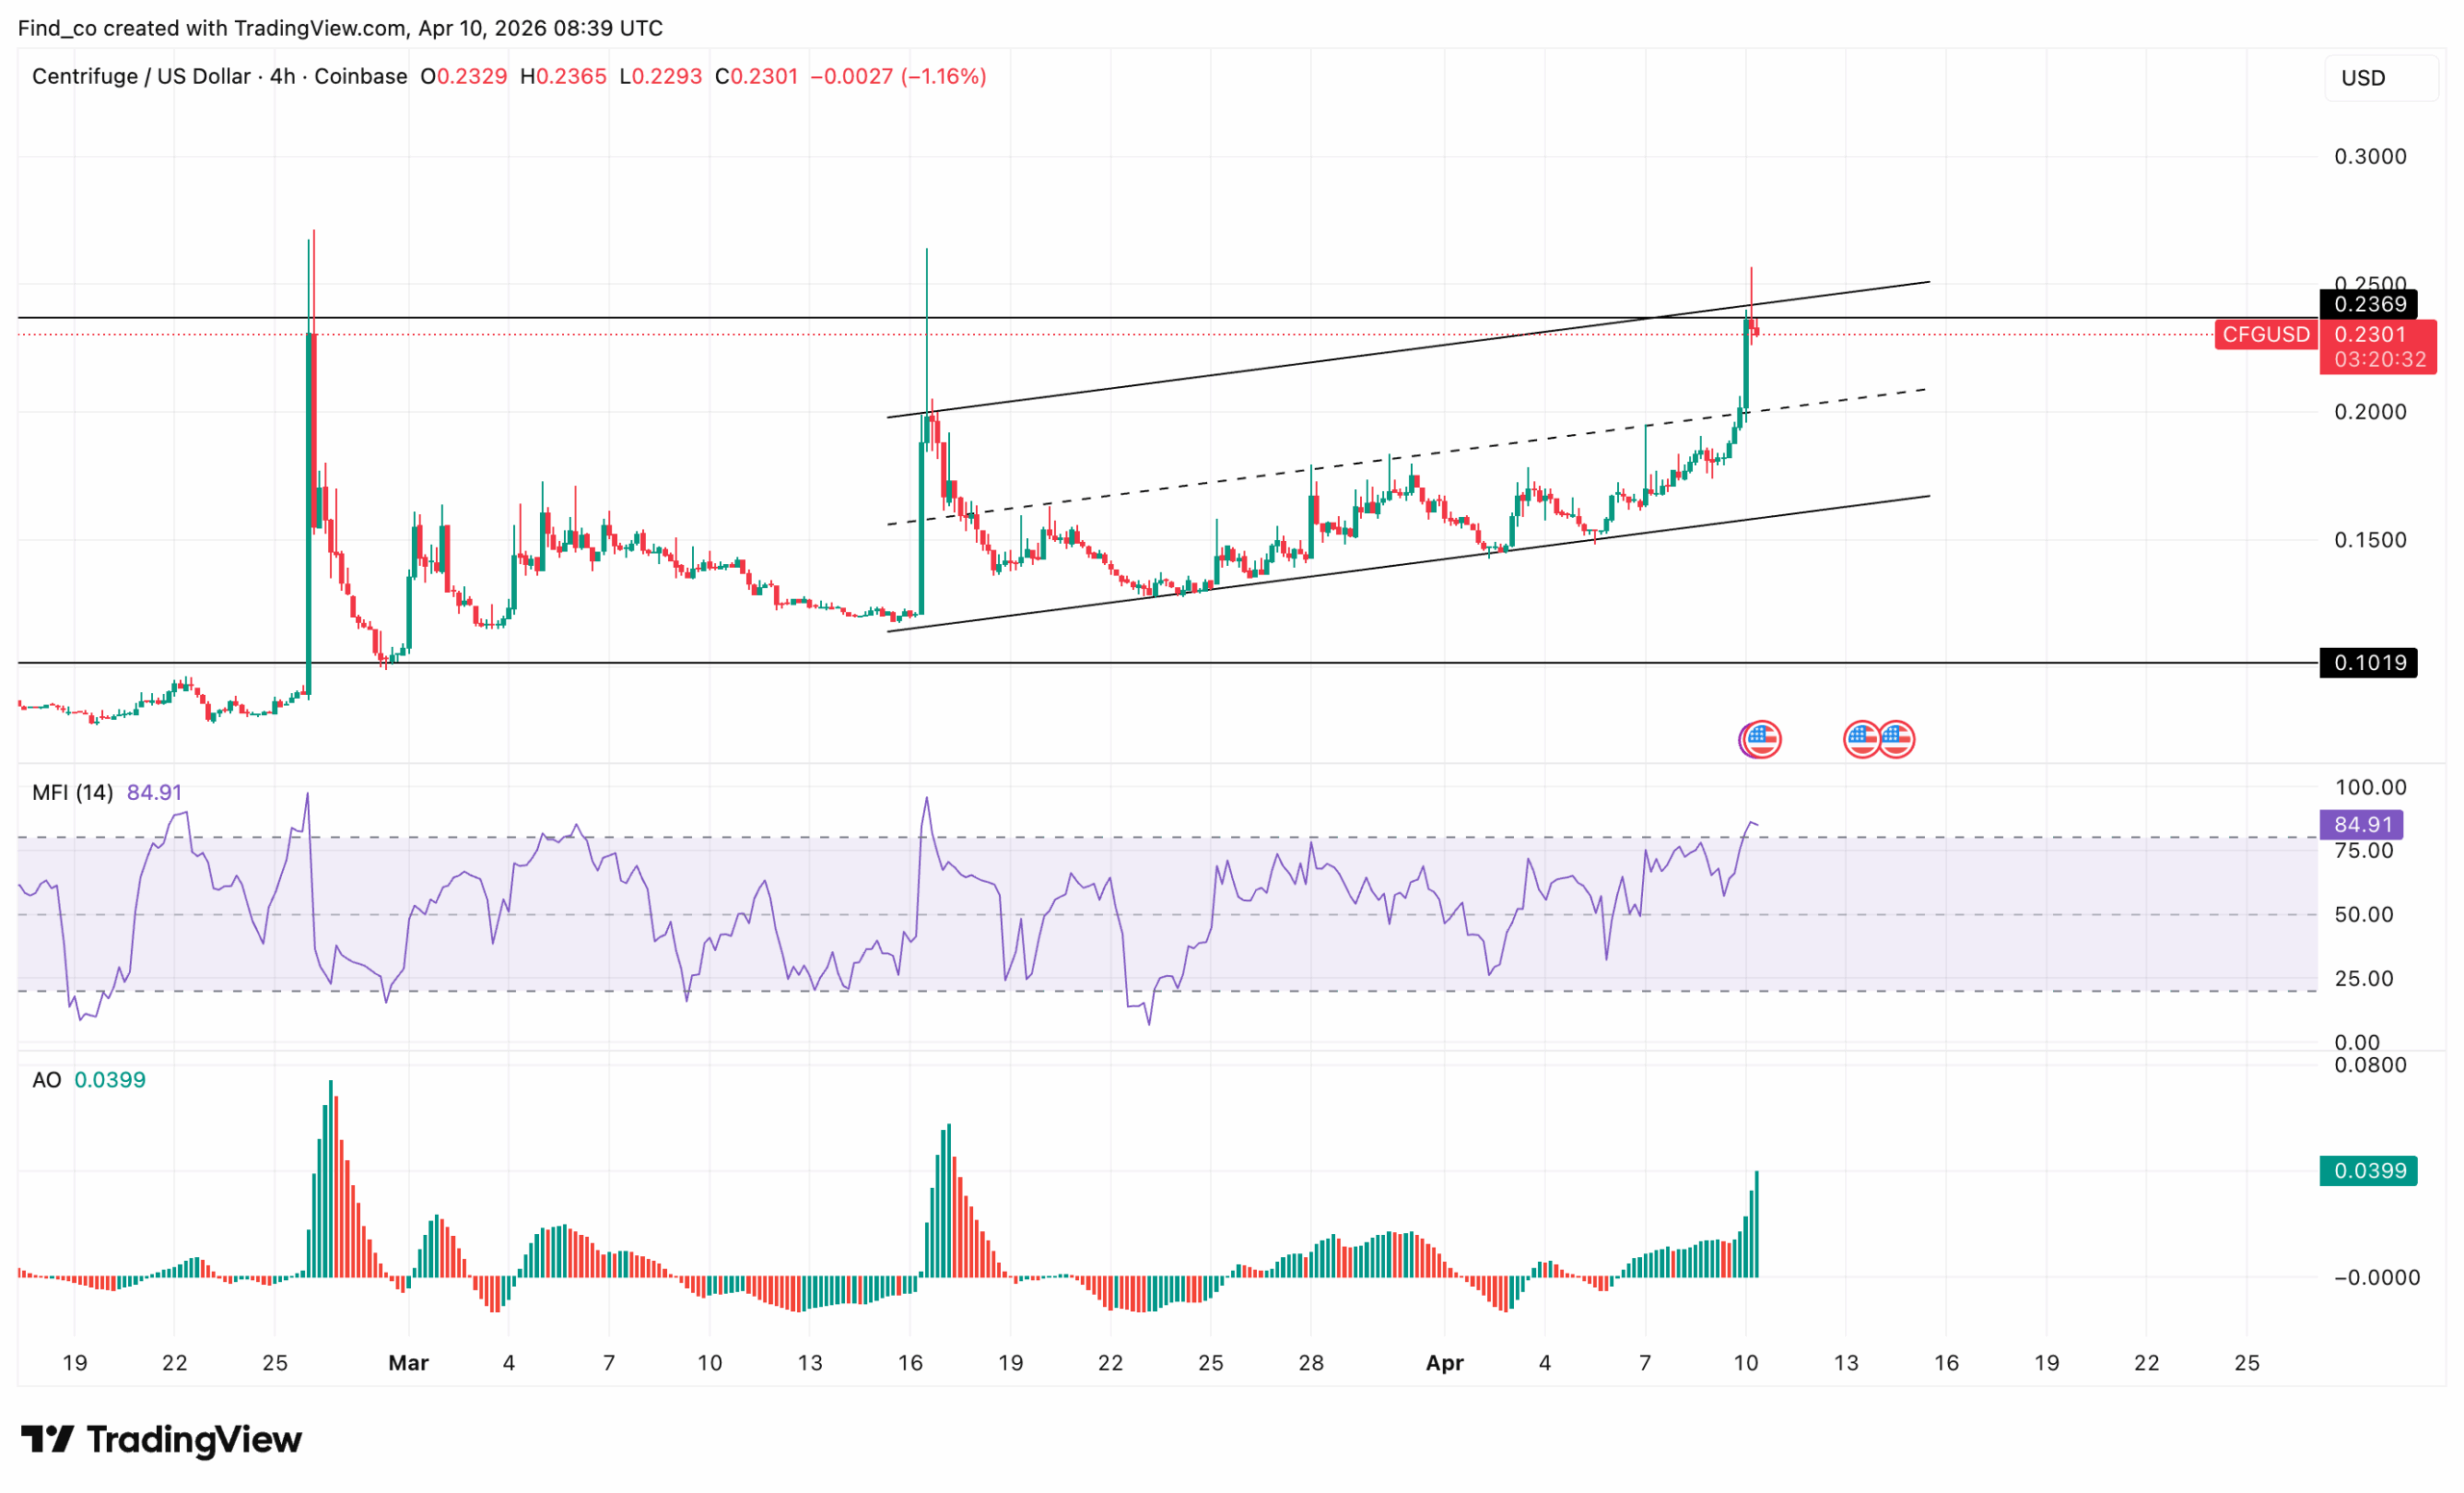
CFG maintains a clear bullish market structure on the 4-hour chart. The asset continues to print higher lows and higher highs, confirming sustained upside pressure.
However, CFG is now testing a major resistance zone between $0.25 and $0.26. This level has previously rejected the price aggressively.
A recent wick into this zone suggests liquidity is sitting above, making it a critical area.
Momentum indicators support the bullish case. The Awesome Oscillator (AO) is printing strong green bars, showing increasing buying pressure.
At the same time, the Money Flow Index (MFI) is sitting around 86, deep in overbought territory.
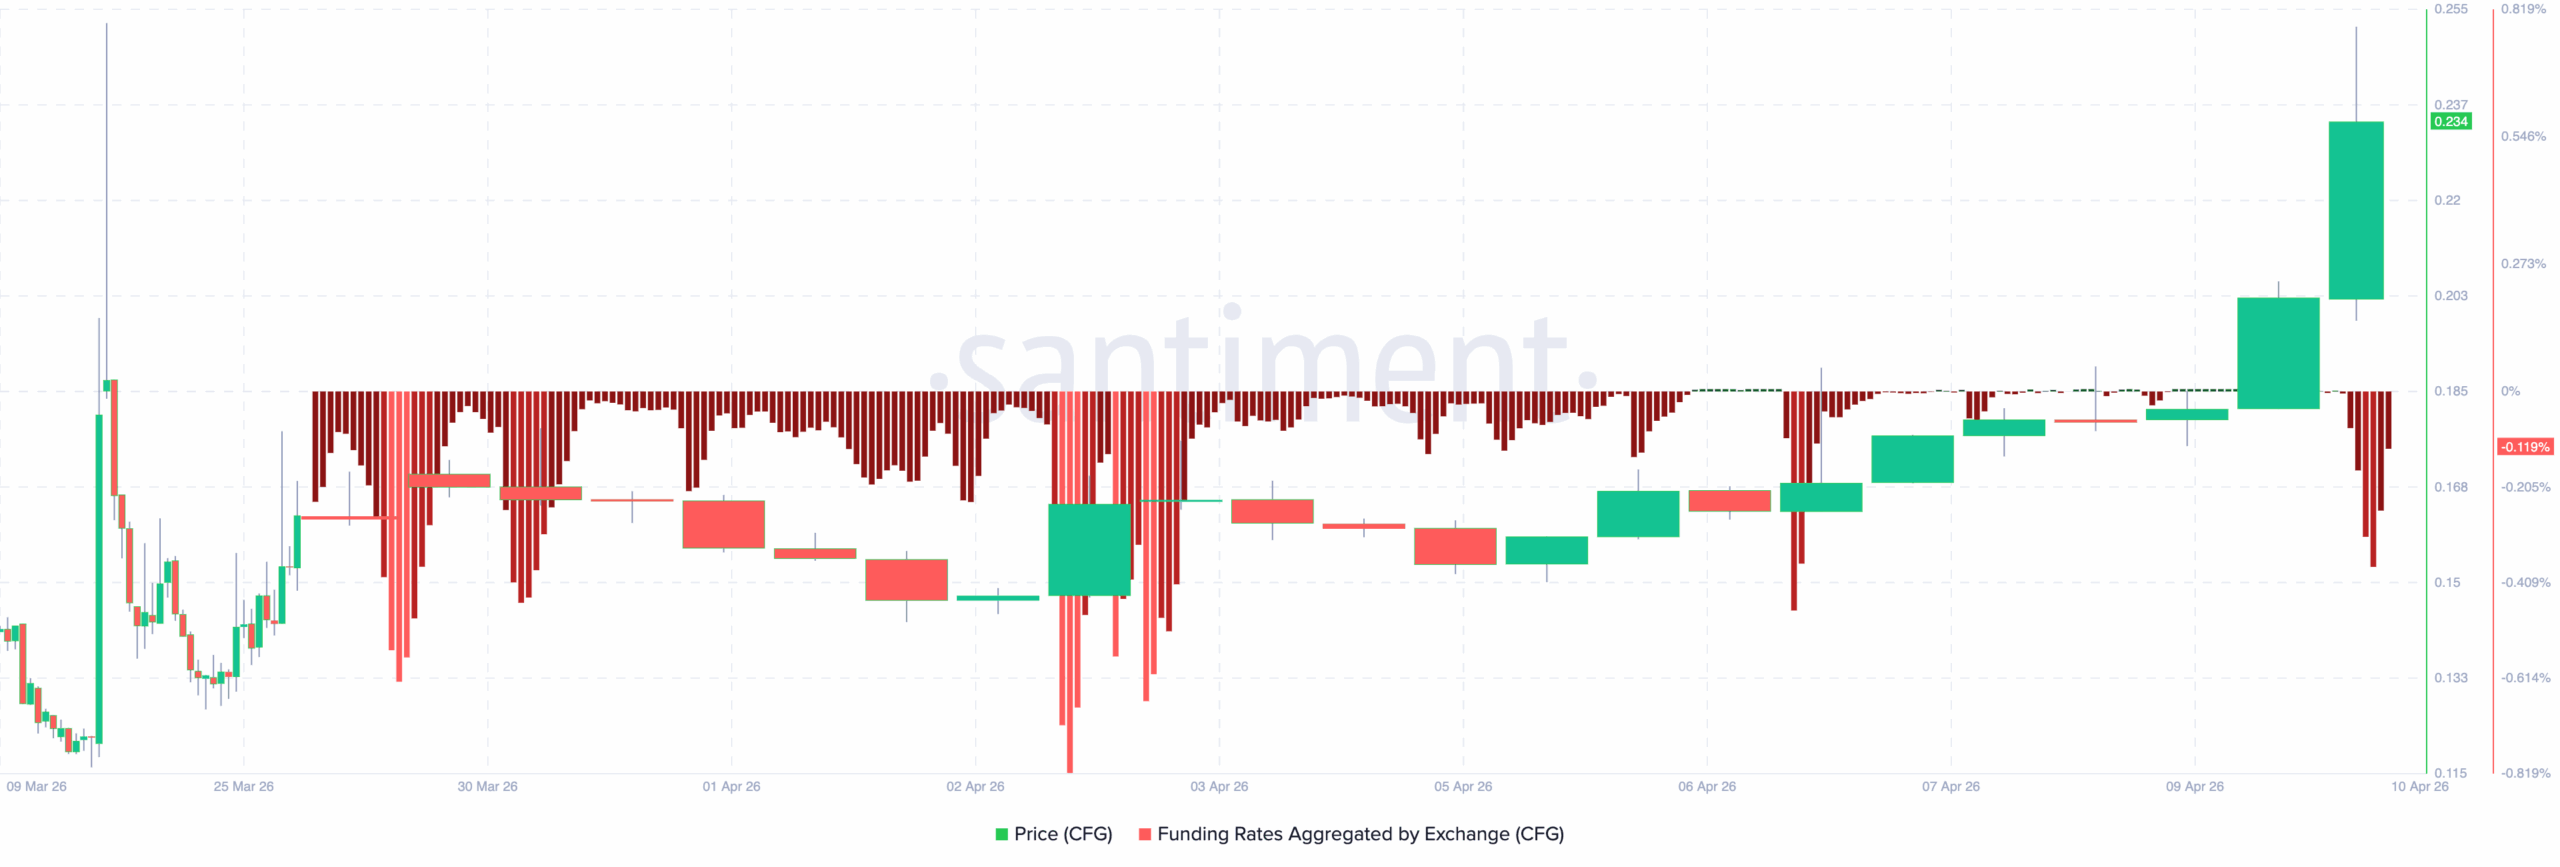
So, as long as funding remains negative or neutral while prices trend up, the squeeze can continue.
The risk comes when funding flips aggressively positive, because that signals the crowd has switched to the long side and the move is becoming crowded. In that case, the CFG price might retrace.
CFG Price Analysis: New ATH on the Horizon?
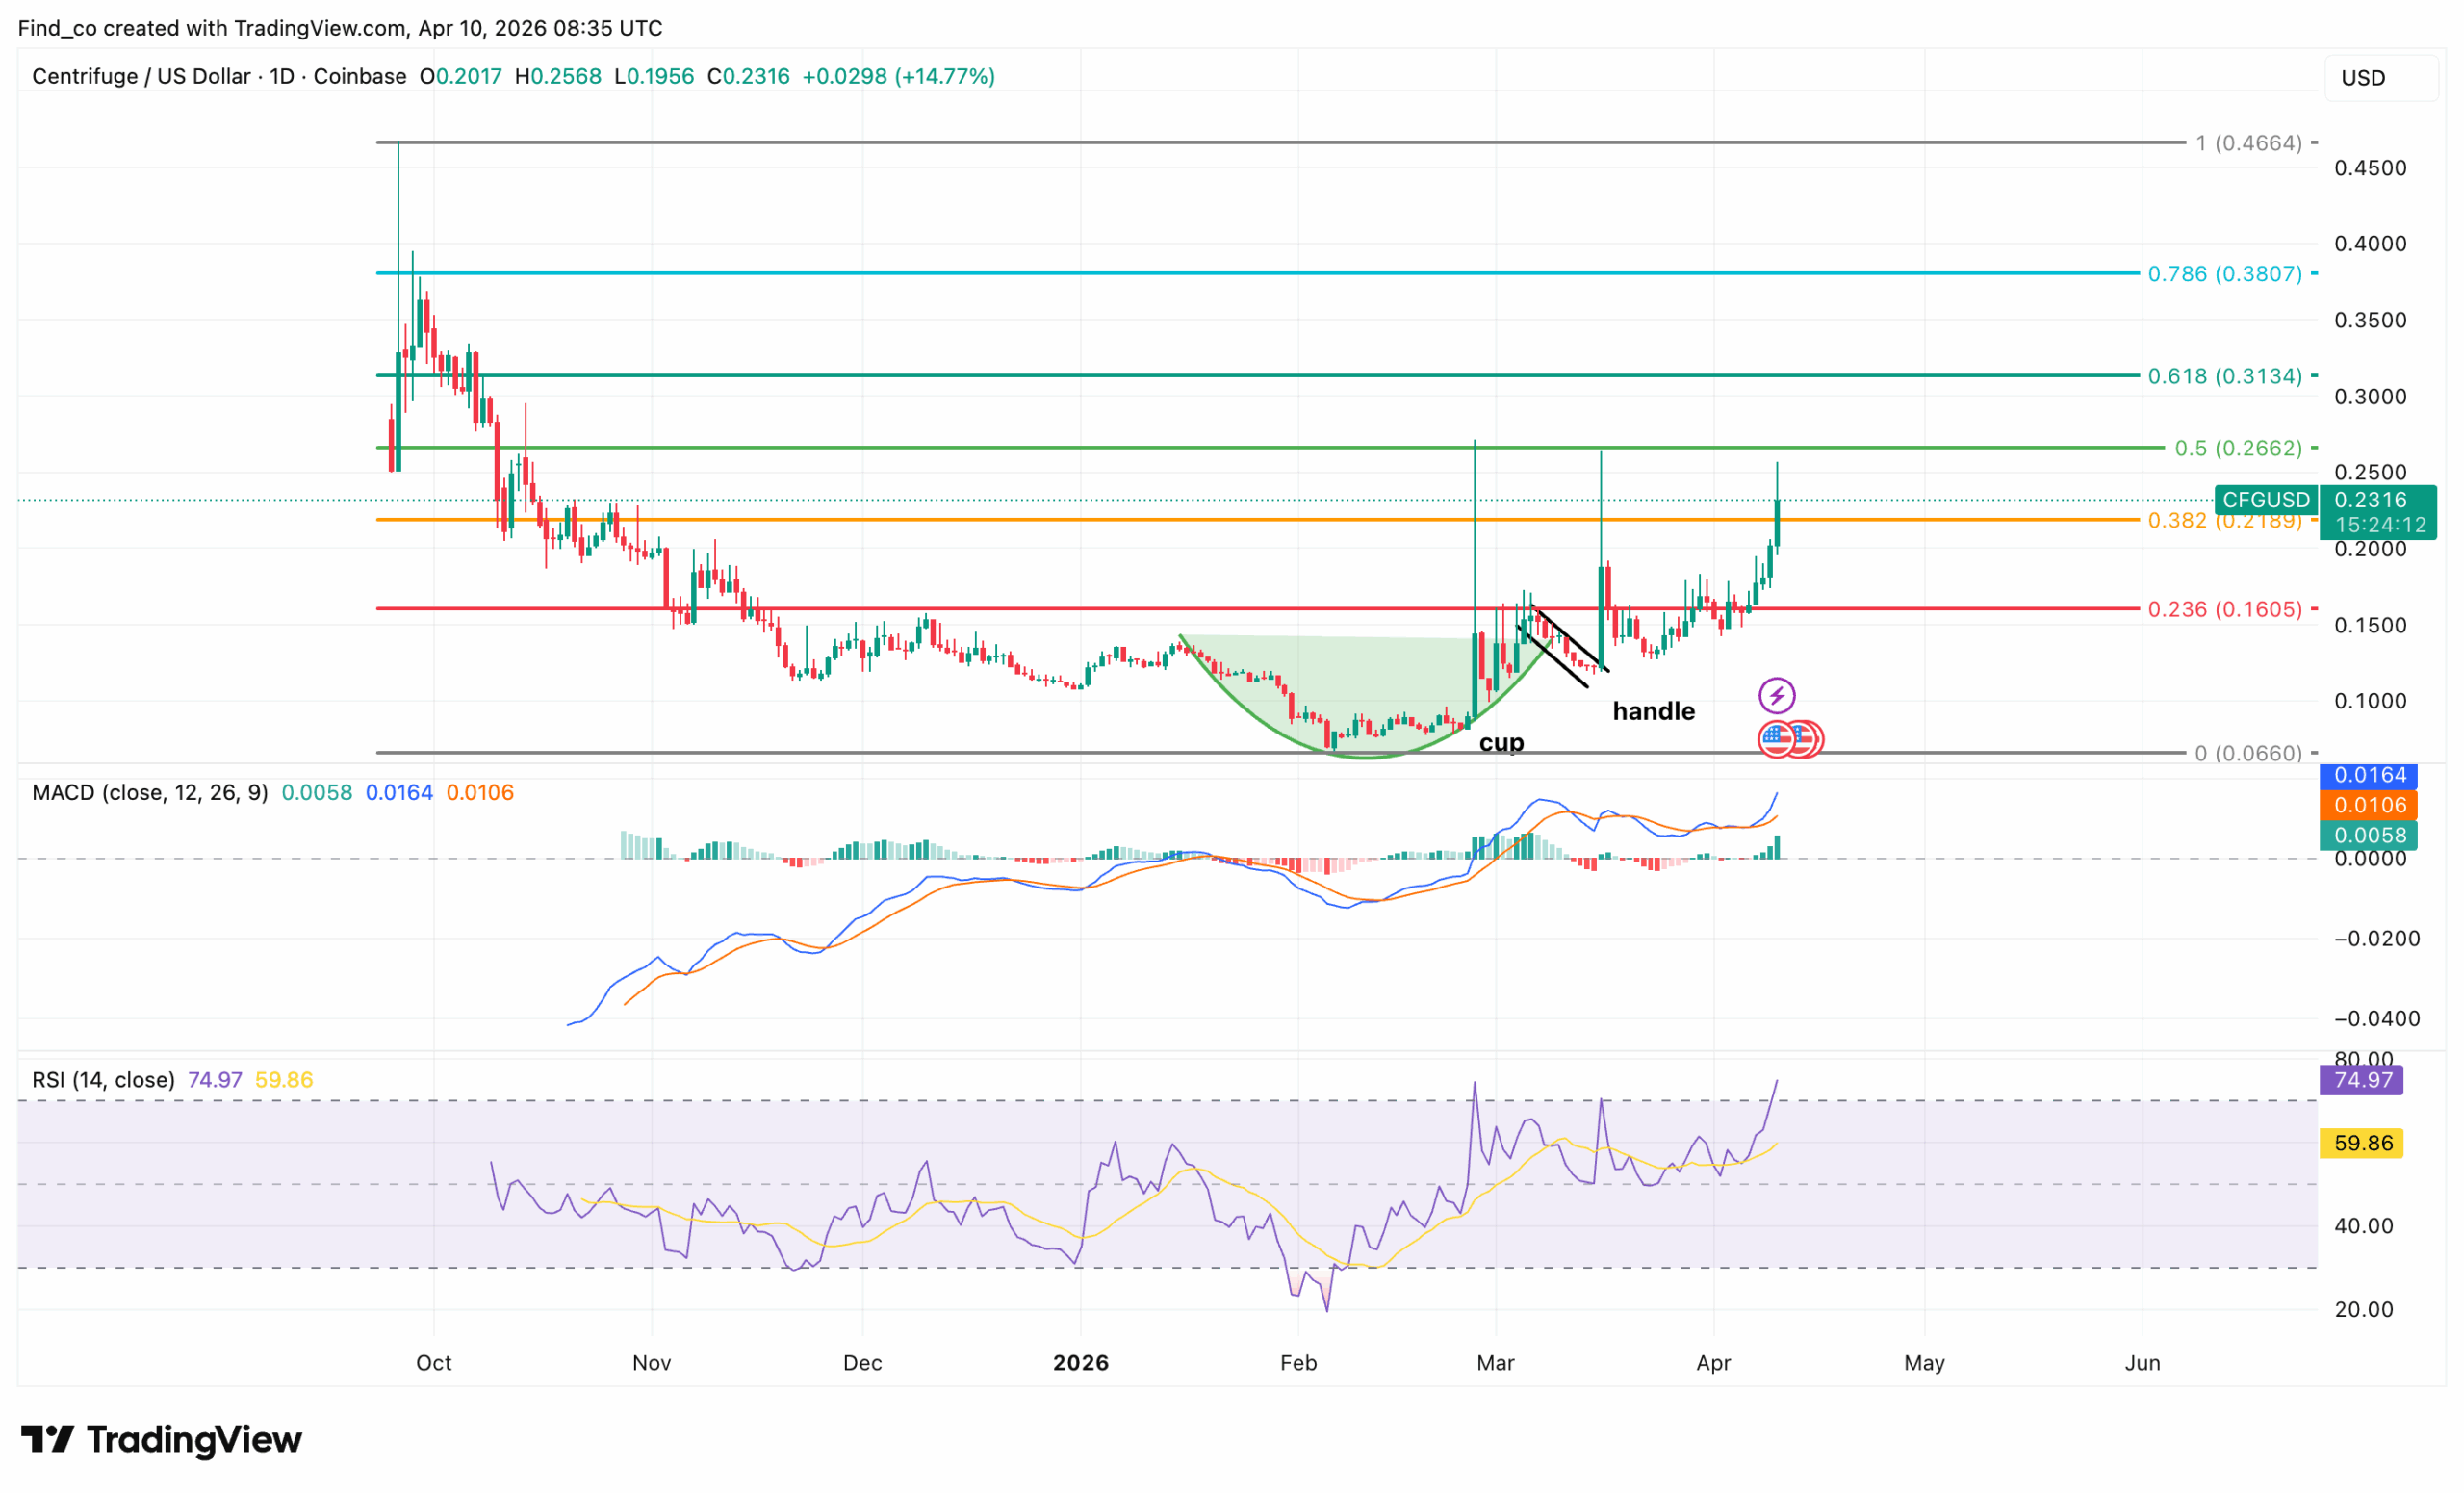
On the daily chart, CFG’s price is showing renewed strength after months of sustained downside pressure, with the price now reclaiming momentum near a critical resistance zone.
Initially, the broader trend remained bearish, reinforced by a descending trendline and consistent lower highs.
However, a sharp rebound from the $0.07 region marked a structural shift, as buyers aggressively defended the bottom.
Meanwhile, momentum indicators support the bullish case. The Moving Average Convergence Divergence (MACD) shows a firm bullish crossover, with histogram strength increasing.
At the same time, the Relative Strength Index (RSI) pushes into the overbought region, reflecting strong demand but hinting at potential short-term cooling.
Disclaimer:
The information provided in this article is for informational purposes only. It is not intended to be, nor should it be construed as, financial advice. We do not make any warranties regarding the completeness, reliability, or accuracy of this information. All investments involve risk, and past performance does not guarantee future results. We recommend consulting a financial advisor before making any investment decisions.
Victor Olanrewaju is a crypto analyst and reporter at CCN with deep roots in on-chain research and technical analysis. His crypto journey began in 2017, but it was the 2020 Uniswap airdrop that sparked a full-time pivot into the space.
With a foundation in copywriting, Victor honed his craft creating high-converting content for leading crypto brokers — most notably an XRP price prediction that ranked #1 on Google during the 2021 bull run.
He later joined AMBCrypto in 2022, where he combined storytelling with technical and on-chain analysis to cover key market narratives.
In 2024, he expanded his expertise at BeInCrypto, collaborating with analysts and using tools like Glassnode, Santiment, and IntoTheBlock to break down Bitcoin and altcoin trends.
At CCN, Victor covers the top cryptocurrencies, memecoins, macro shifts, blending real-time insights with deep-dive metrics.
He holds a Bachelor’s degree in Physics from the University of Ibadan, equipping him to simplify complex data for a wide audience. Follow his work or connect on LinkedIn or X.