DEXE is up 31% over the past week and 10% over the past 24 hours, trading at 4-month highs as of this writing.
Technical indicators, including the Ichimoku Cloud and DMI, confirm a sustained bullish trend.
A decisive daily close above the $5.86 Fibonacci resistance level would open the path toward $6.99.
The gradual recovery in broader market sentiment — which has pushed Bitcoin above $70,000 — has given DEXE fresh legs. The governance token has registered new price highs since March 13 and is up 31% in the past week.
Leading as one of today’s top gainers, DEXE is up over 10% in the past 24 hours. If the rally holds, the token could break into $6 territory for the first time since late 2025.
This is how.
DEXE Bulls in Control as Buying Pressure Builds
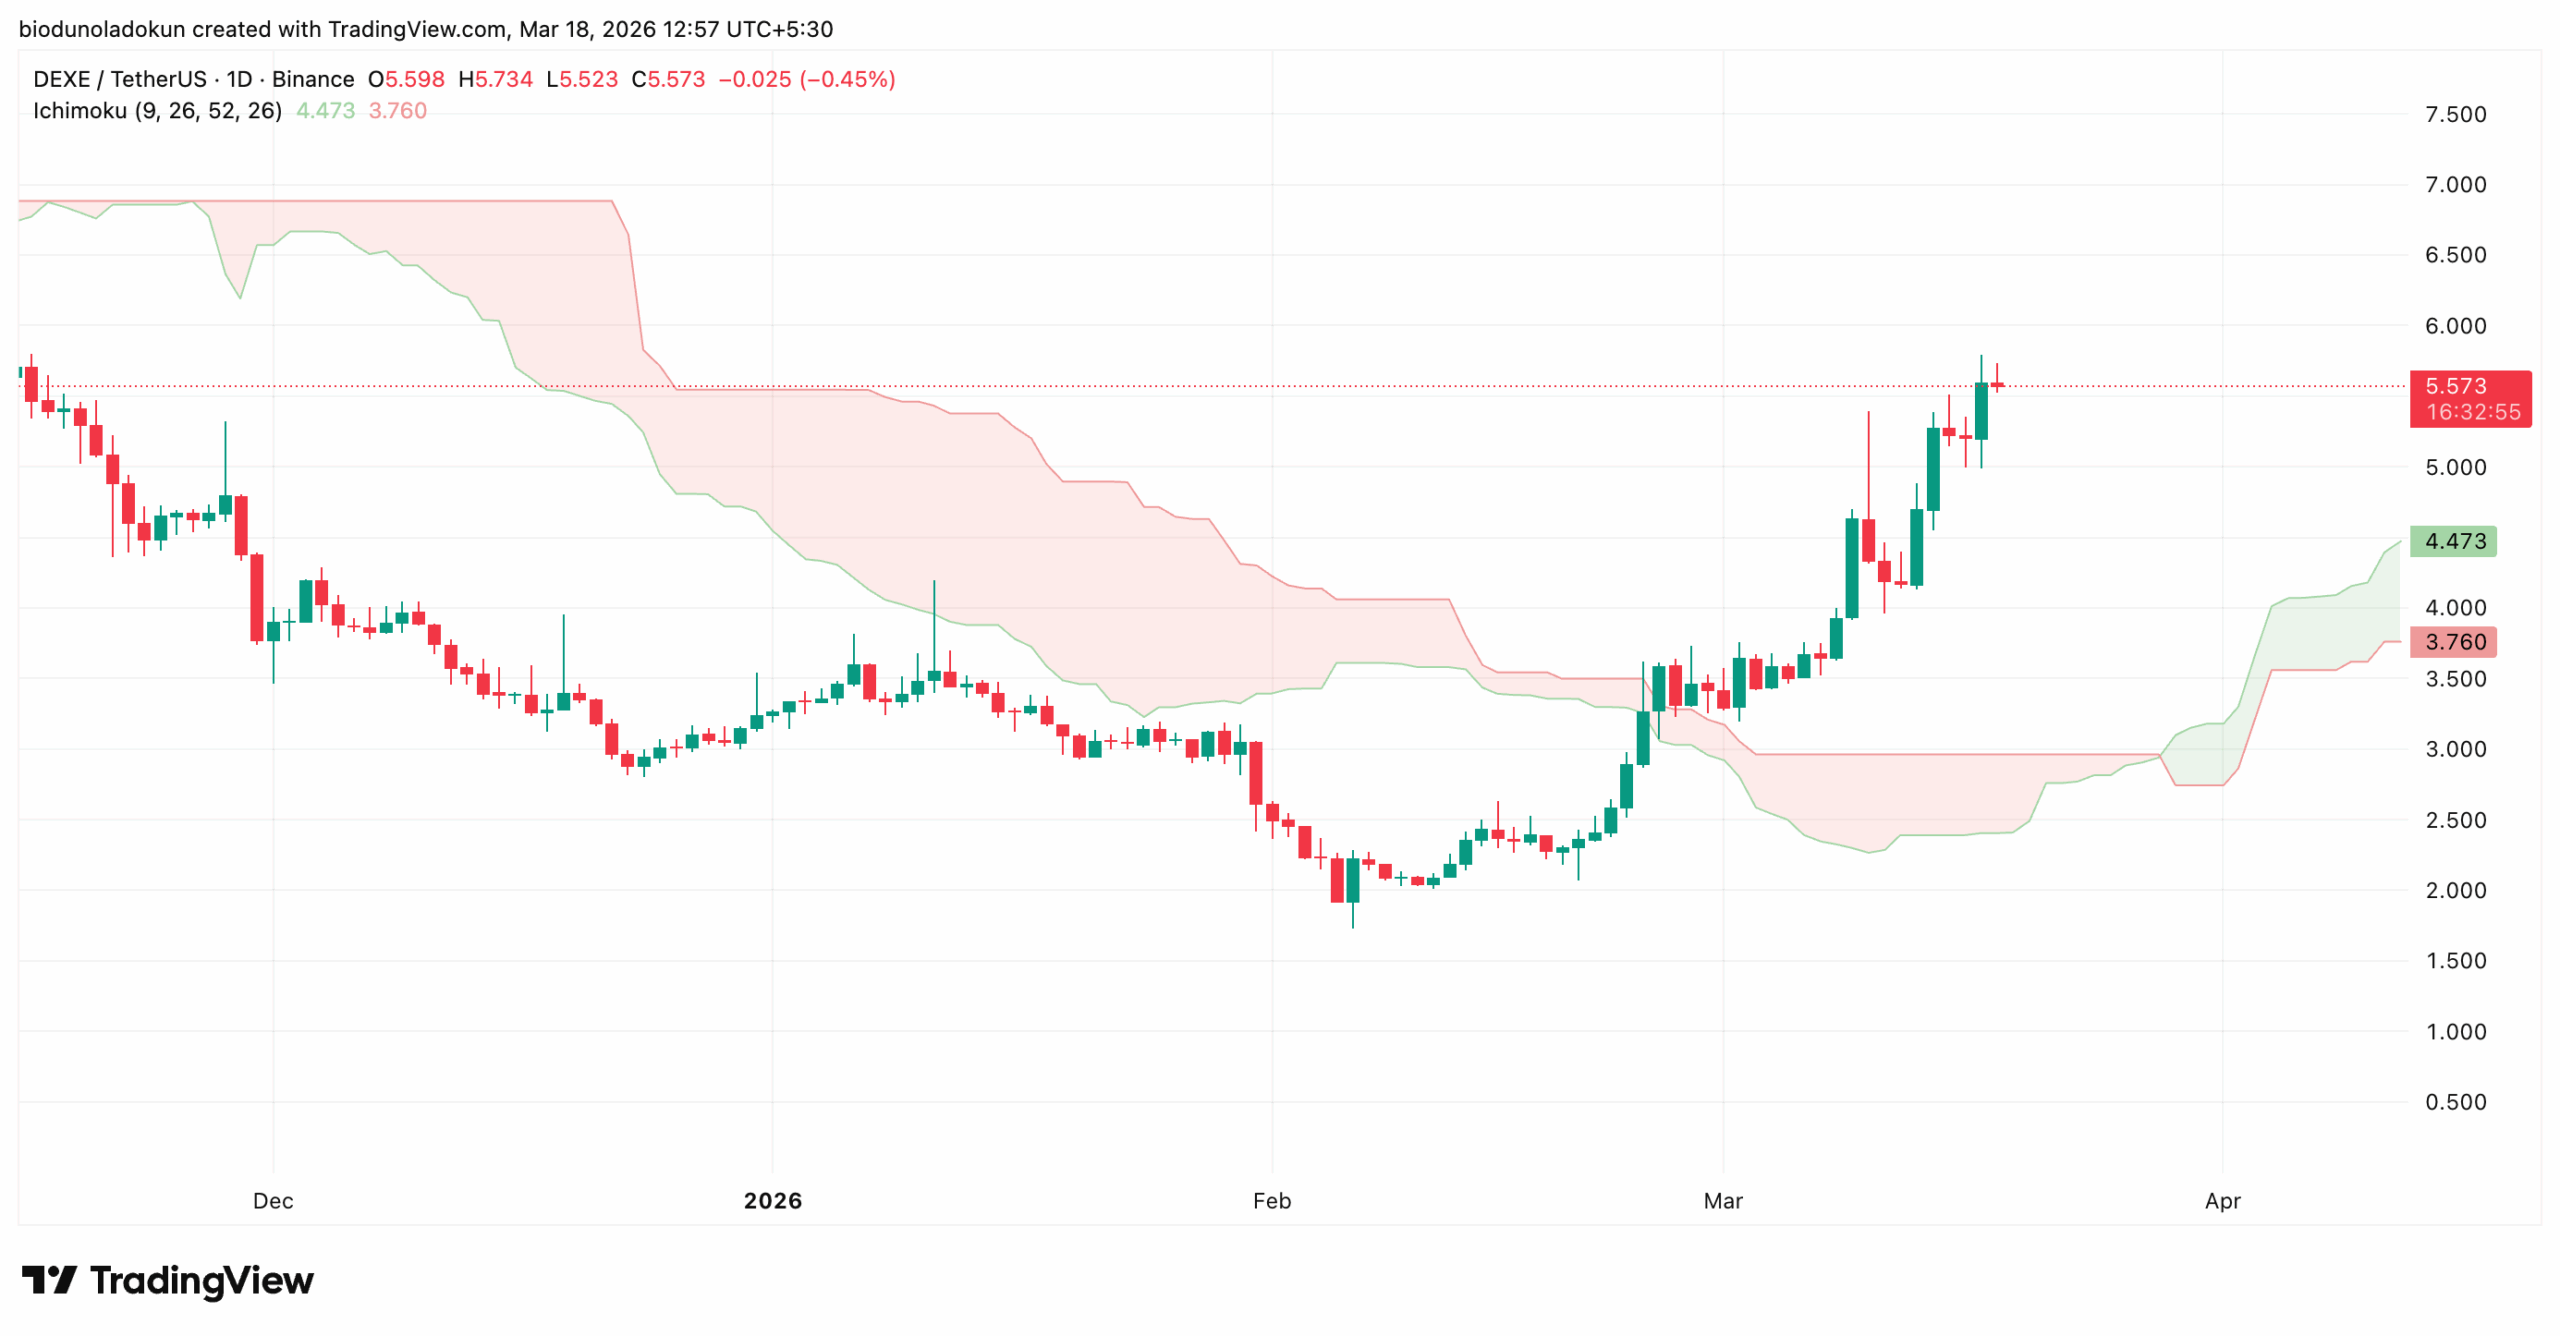
Buy-side volume on the spot market has surged alongside the price recovery, strengthening the likelihood of a sustained rally. One clear indicator of this trend is the setup of DEXE’s Ichimoku Cloud.
As of this writing, the token trades above the Leading Spans A and B of this key indicator, which currently have formed dynamic support levels below it at $4.47 and $3.76, respectively. For context, DEXE exchanges hands at $5.57 at press time.
The Ichimoku Cloud tracks an asset’s market momentum and identifies potential support/resistance levels.
When an asset trades above this cloud, the market is deemed to be in an uptrend. In this scenario, the cloud acts as a dynamic support zone, absorbing any sell-side pressure that could push DEXE’s price lower.
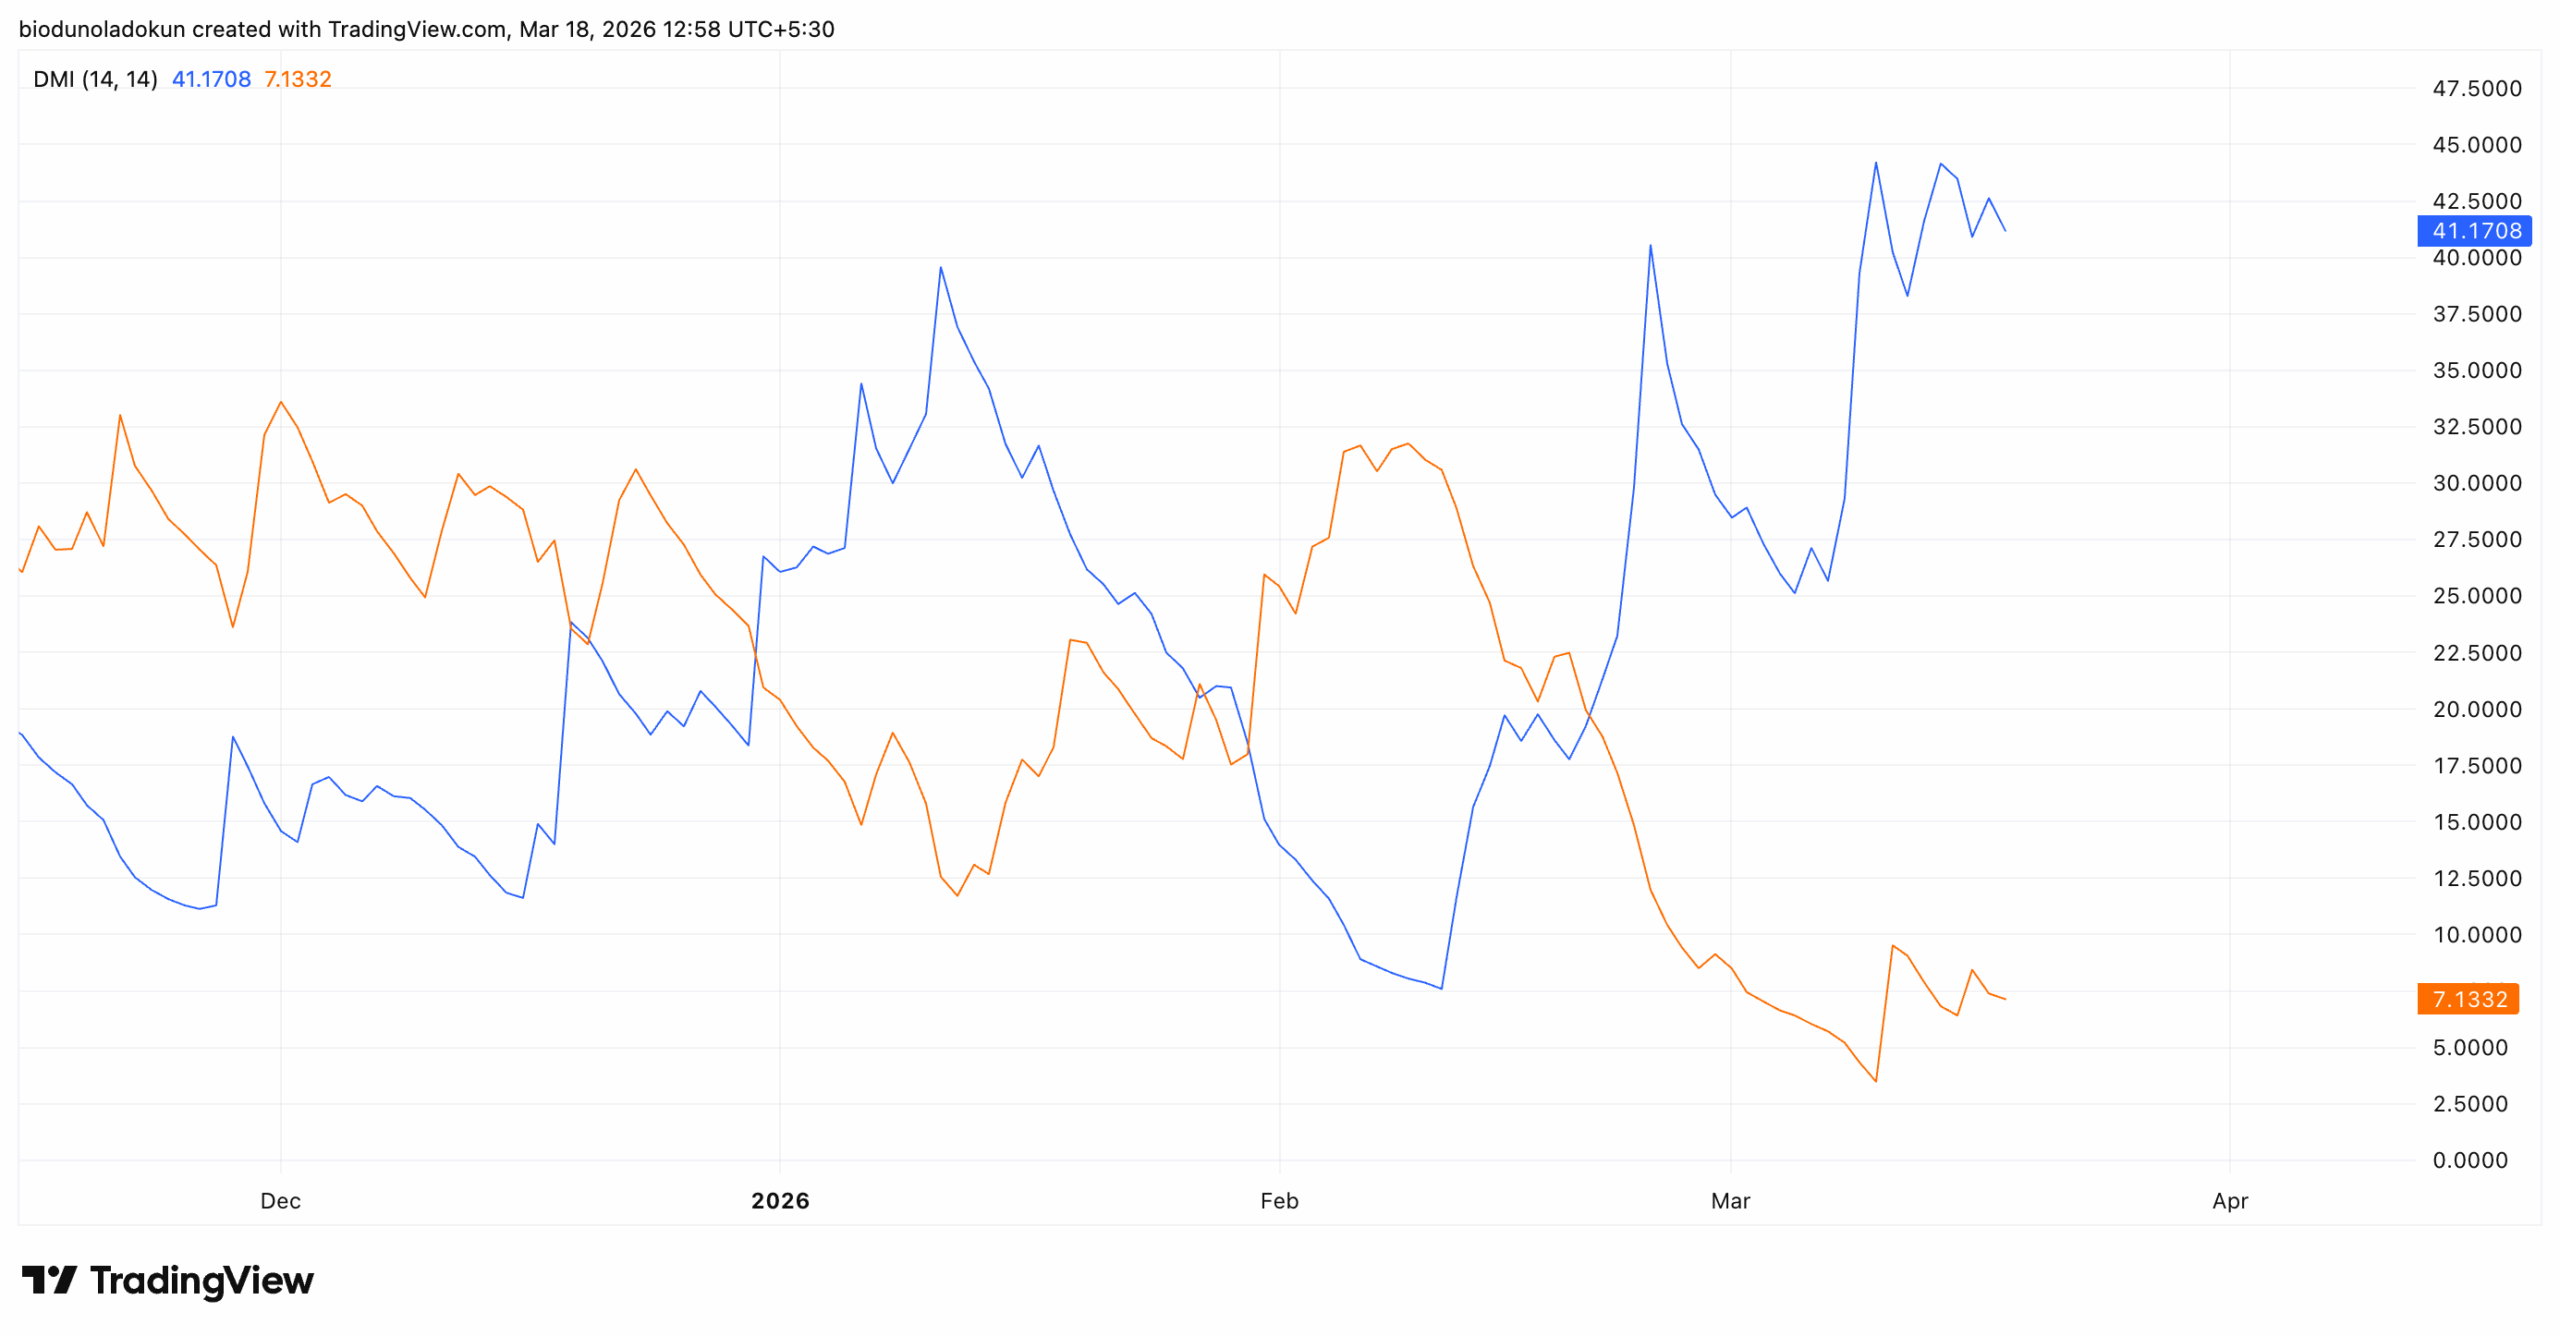
Furthermore, readings from the altcoin’s Directional Movement Index (DMI) reflect the bullish bias DEXE has enjoyed over the past week.
At press time, the token’s positive directional index (+DI) rests above the negative directional index (-DI), signalling dominant buying pressure among spot market participants.
The DMI indicator measures the strength of an asset’s price trend. It consists of two lines: the +DI, which represents upward price movement, and the -DI, which represents downward price movement.
For context, DEXE’s +DI decisively broke above its -DI on February 21, signalling the point at which bulls wrested control from sellers.
The token’s price soon broke out of its sideways range and began trending upward gradually, confirming that buying pressure has grown steadily since the DMI crossover.
With its +DI well above its -DI, DEXE’s trend remains firmly bullish. Also, the widening gap between the two lines suggests that selling pressure has yet to pose any meaningful risks to the ongoing rally.
Derivatives Market Backs the Rally
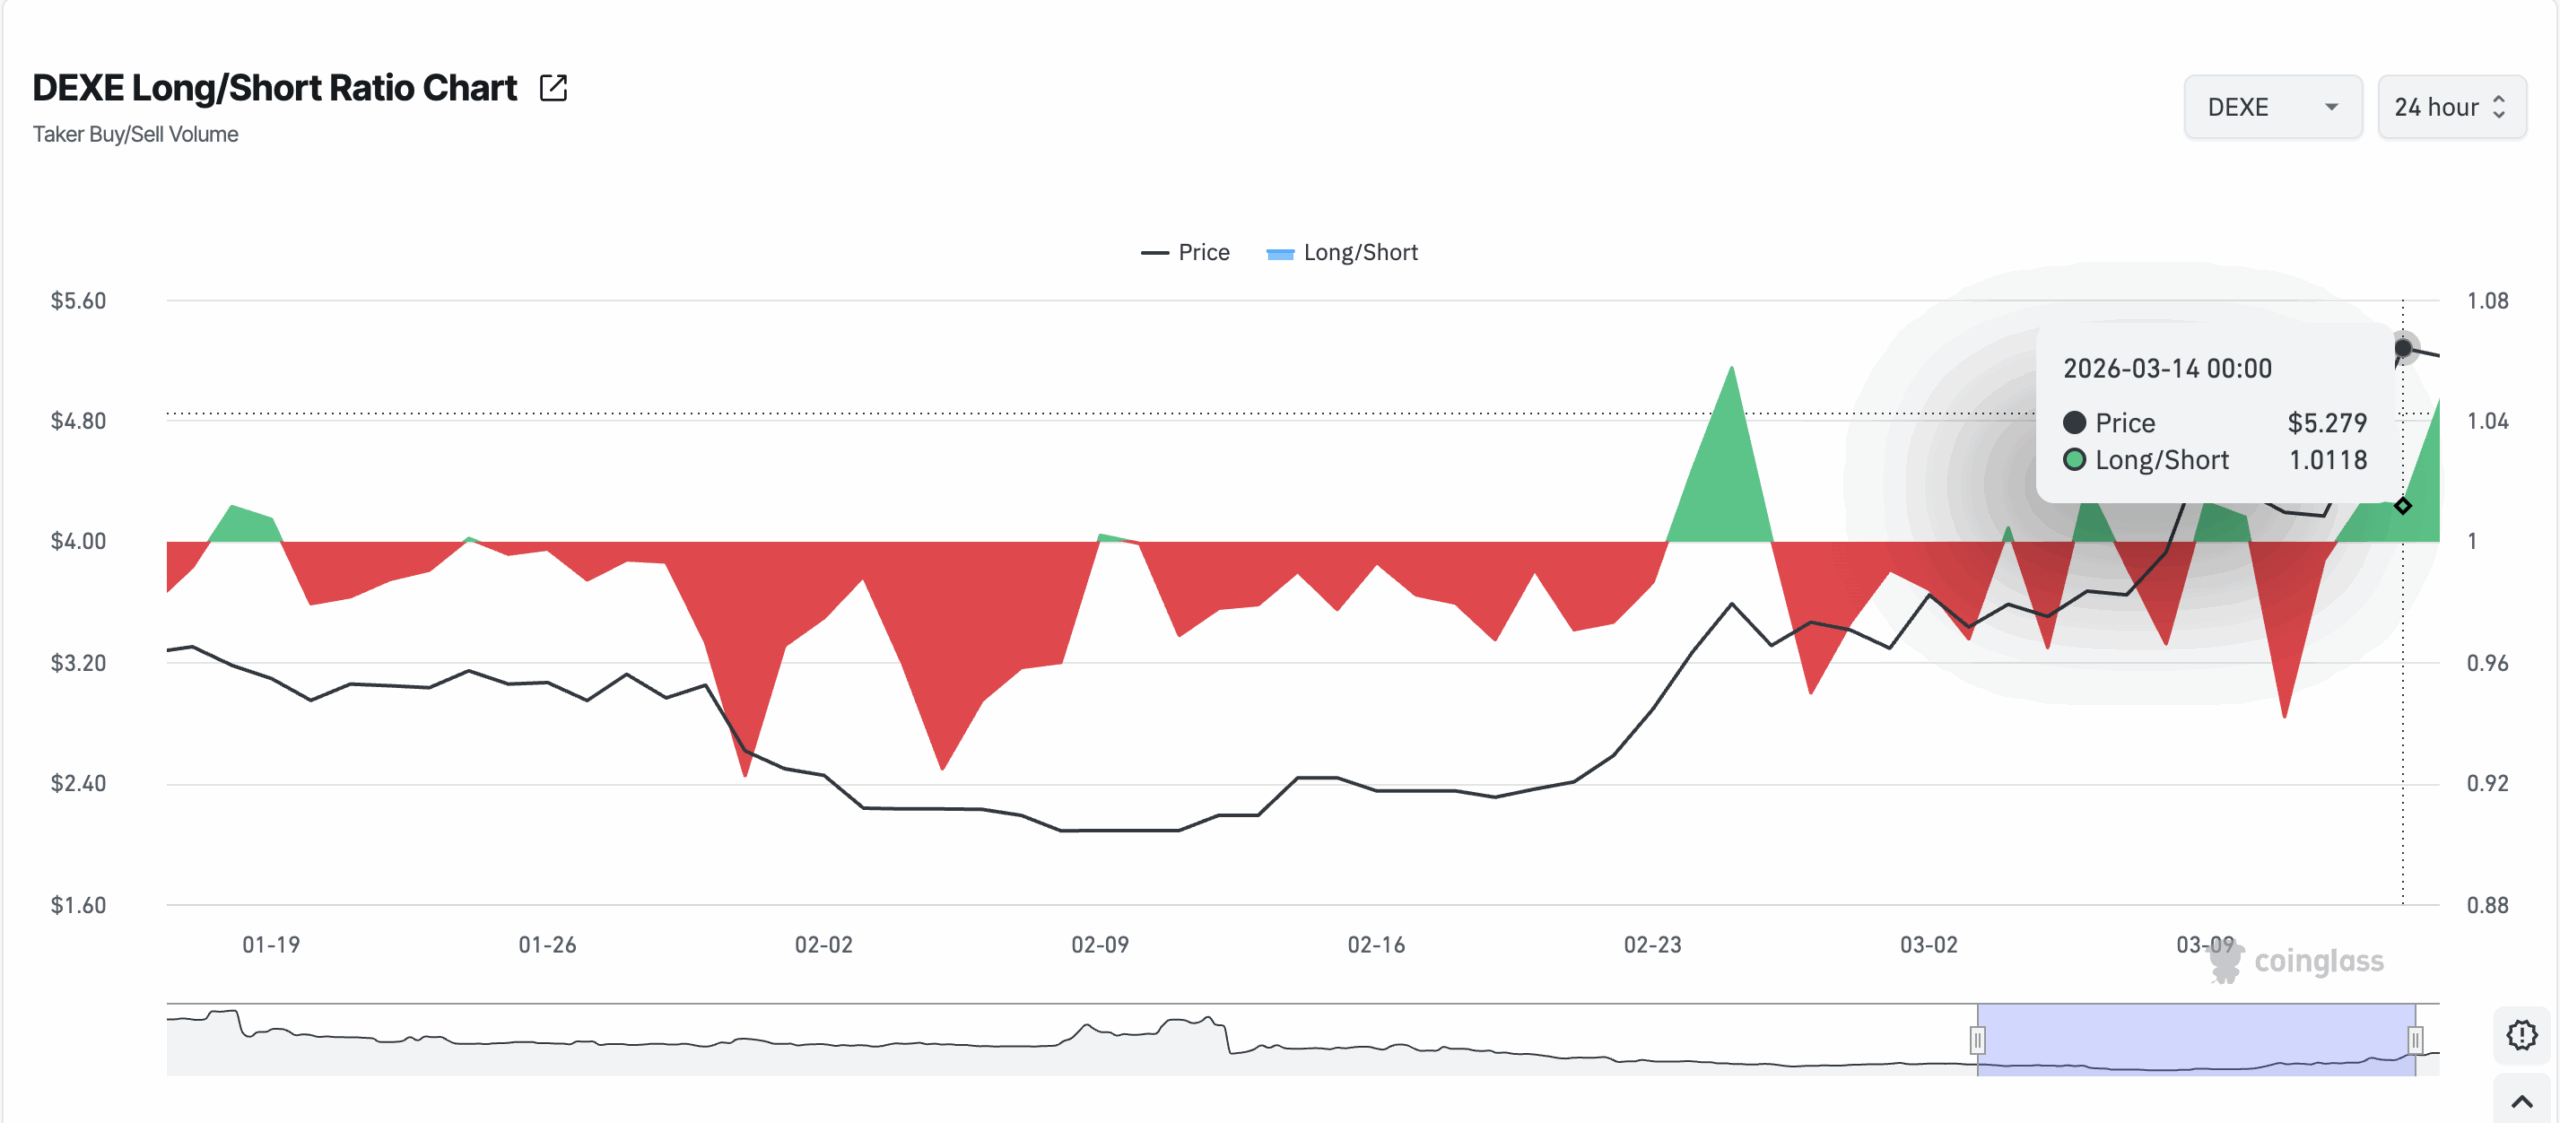
Derivatives traders are also turning bullish on DEXE. The token’s long/short ratio, which tracks taker buy and sell volume in the futures market, has consistently returned values above 1 since March 13, reflecting stronger demand for long positions over shorts.
The long/short ratio measures the balance between bullish and bearish positioning in the derivatives market.
When the ratio exceeds 1, it indicates that more traders are placing long bets than short ones, signalling bullish sentiment among futures participants.
Per Coinglass data, for much of January and February, DEXE’s long/short ratio sat below 1, with red dominance across the chart indicating that short sellers had the upper hand.
This period coincided with the token’s prolonged price decline toward its $2 floor.
However, sentiment began to shift around late February. As new demand drove DEXE’s price higher, futures traders’ sentiment gradually improved.
With the token’s long/short ratio now above 1 and green spikes becoming more frequent and pronounced, bullish bets on an extended rally dominate the market.
$5.86 Is the Line in the Sand — A Break Could Send DEXE to $6
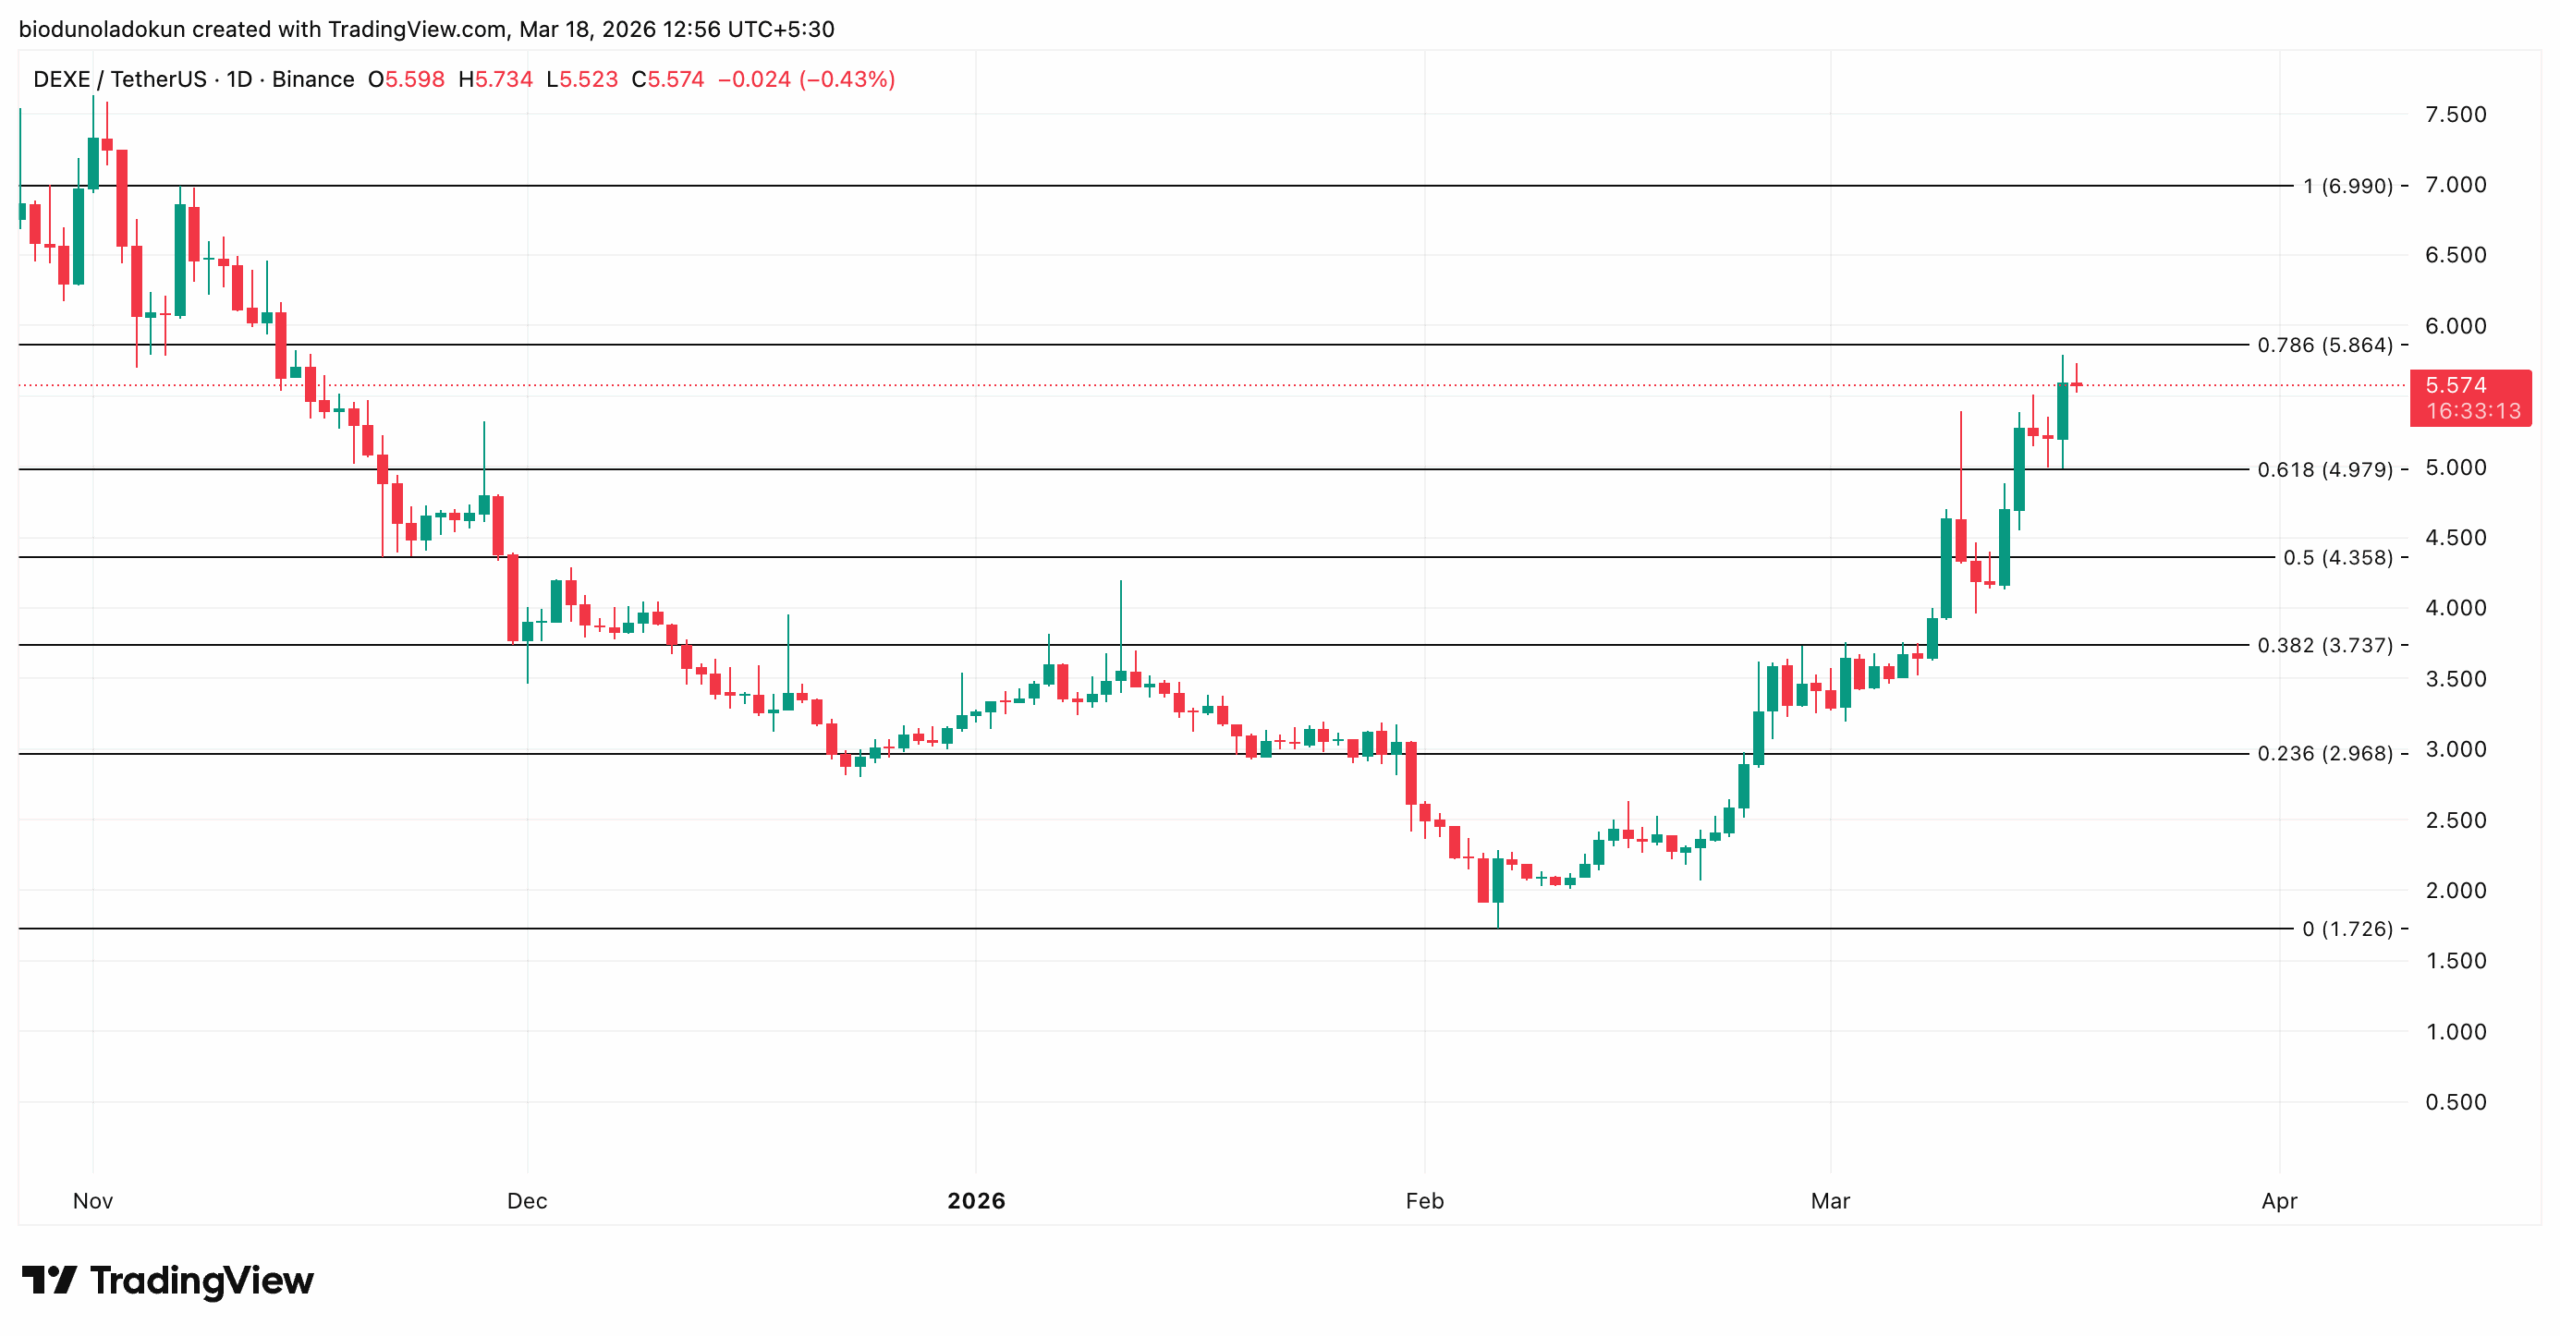
As of this writing, DEXE trades near a key resistance at $5.86. A clean break and daily close above this level would open the door to $6.99, a price level the altcoin last traded at in November 2025.
With DEXE having already cleared the 0.5 ($4.35) and 0.618 ($4.97) retracement levels with relative ease during the March rally, bulls will be watching closely for a decisive candle close above $5.86 to validate the continuation thesis.
Failure to hold above this level on a daily close could see the token retrace toward the $4.97 support before another attempt at the breakout.
Disclaimer:
The information provided in this article is for informational purposes only. It is not intended to be, nor should it be construed as, financial advice. We do not make any warranties regarding the completeness, reliability, or accuracy of this information. All investments involve risk, and past performance does not guarantee future results. We recommend consulting a financial advisor before making any investment decisions.
Abiodun Oladokun is a Research Analyst at CCN, where he covers cryptocurrency markets with a focus on on-chain analysis, technical assessments, and emerging trends across decentralized finance (DeFi), real-world assets (RWA), artificial intelligence (AI), decentralized physical infrastructure networks (DePIN), Layer 2s, and meme coins.
Prior to CCN, he served as a Senior On-Chain Analyst at BeInCrypto, producing market reports spanning diverse crypto sectors.
Before that, he conducted technical analysis and market assessments of various altcoins at AMBCrypto, where he also contributed long-form quarterly research papers on DeFi, NFTs, DAOs, and scaling architectures, leveraging on-chain platforms including Messari, Santiment, DefiLlama, and Dune Analytics.
He began his crypto career as a research analyst at SixthSense DAO, developing blockchain forensic tools to trace the history of stolen assets.
Abiodun is a lawyer called to the Nigerian Bar and the founder of Ilé Ijó, a Lagos-based electronic dance music collective.