Meet the Top 101 in Crypto

Bollinger Bands Creator Spots Bitcoin’s Fractal ‘W’ Pattern: Is BTC Preparing for a Breakout?

Published 08 July 2026
Giuseppe Ciccomascolo
Authors

Key Takeaways

  • John Bollinger identified a developing fractal “W” pattern on Bitcoin’s chart, suggesting a potential long-term trend reversal if the pattern confirms.
  • The setup remains unconfirmed, with a decisive daily close above $65,000 needed to validate the classic double-bottom breakout.
  • Bitcoin continues to defend the $60,000 support zone, while improving ETF inflows and signs of institutional accumulation strengthen the bullish case.

Bitcoin may be approaching one of its most important technical moments of the year after legendary market analyst John Bollinger identified a developing fractal “W” pattern on the cryptocurrency’s chart.

The creator of the widely used Bollinger Bands indicator believes Bitcoin is forming a classic double-bottom reversal, but he also cautions that previous bullish setups have repeatedly failed during the current downtrend.

His latest analysis comes as Bitcoin attempts to stabilize above the $60,000 region following months of heavy selling pressure.

While improving ETF flows and signs of institutional accumulation are fueling optimism, macroeconomic headwinds and elevated interest rates continue to cast doubt on whether the world’s largest cryptocurrency is finally ready to reverse its broader bearish trend.

Try Our Recommended Crypto Exchanges
Sponsored
Disclosure
Opened in 2018
Promotions
Deposit $100, Get an Extra $300 in GOLD!
Coins
Shiba Inu Bitcoin PAX Gold Ampleforth Ethereum +70
Promotions
Receive up to $100,000 worth of exclusive gifts for newcomers upon registration.
Coins
Bitcoin Ethereum Tether USD Coin Solana +76
Opened in 2017
Promotions
Experience a 1-minute swap on a non-custodial platform.
Coins
Bitcoin Ethereum Tether Build'N'Build USD Coin +217
Show More

John Bollinger Sees a Fractal Reversal Taking Shape

Bollinger’s latest chart highlights what technical analysts call a “W” pattern, or double bottom, one of the most recognizable reversal formations in market analysis.

The structure typically develops after an extended decline, with price testing a major support level twice before breaking above the intermediate high that separates the two lows.

According to Bollinger, what makes Bitcoin’s current setup unique is its fractal nature.

Rather than simply forming a standard double bottom, each of the two major lows contains its own smaller “W” formation, while the central peak resembles a smaller “M” pattern.

Zooming out even further, Bollinger noted that the weekly chart also appears to be developing a larger-scale fractal “W,” suggesting the current correction could represent only one component of a broader long-term reversal.

Fractals refer to repeating chart structures that appear across multiple timeframes. These repeating formations may indicate that market psychology behaves similarly across scales, making higher-timeframe confirmations particularly valuable.

Still, Bollinger stopped well short of declaring victory for the bulls. Instead, he posed a simple question to traders: after several bullish formations failed during Bitcoin’s prolonged decline, will this pattern finally break the downtrend?

That question remains unanswered because the pattern has yet to produce its most important element, a confirmed breakout.

Technical and On-chain Signals Strengthen the Bullish Case

Several supporting factors have emerged alongside Bollinger’s chart pattern.

Bitcoin has repeatedly defended the $60,000 area despite months of persistent selling, preventing a decisive breakdown below the lower Bollinger Band.

Multiple successful tests of this region suggest buyers continue stepping in whenever prices approach those levels.

On-chain data also points to improving market conditions. CryptoQuant contributor Axel Adler Jr. highlighted renewed institutional buying activity, arguing that larger investors appear to be absorbing selling pressure rather than exiting positions.

Institutional flows have also shown early signs of stabilization. US spot Bitcoin ETFs recently recorded their first day of net inflows after a prolonged streak of outflows that removed roughly $4.4 billion from the products between mid-May and early June.

Although a single day does not establish a trend, it could indicate that investor sentiment is beginning to improve.

Macroeconomic developments have provided additional support.

A weaker-than-expected US employment report reinforced expectations that the Federal Reserve could eventually adopt a more accommodative monetary stance, helping Bitcoin recover above $62,000 as investors priced in a less aggressive policy outlook.

Another noteworthy detail is Bollinger’s own positioning. Earlier this year, he disclosed that he had opened a long Bitcoin position through his investment vehicle, meaning his latest observations align with his personal market exposure rather than representing purely theoretical analysis.

Why Confirmation Above $65,000 Remains the Key Hurdle

Despite the improving technical picture, several obstacles remain in Bitcoin’s way.

The Federal Reserve still projects a relatively restrictive interest-rate environment, with members signaling that rates could remain elevated well into 2026.

Higher Treasury yields generally reduce the appeal of non-yielding assets such as Bitcoin by increasing returns available in traditional fixed-income markets.

Geopolitical uncertainty also continues to support defensive positioning across global markets. Ongoing tensions in the Middle East have encouraged investors to maintain cautious allocations, limiting appetite for higher-risk assets.

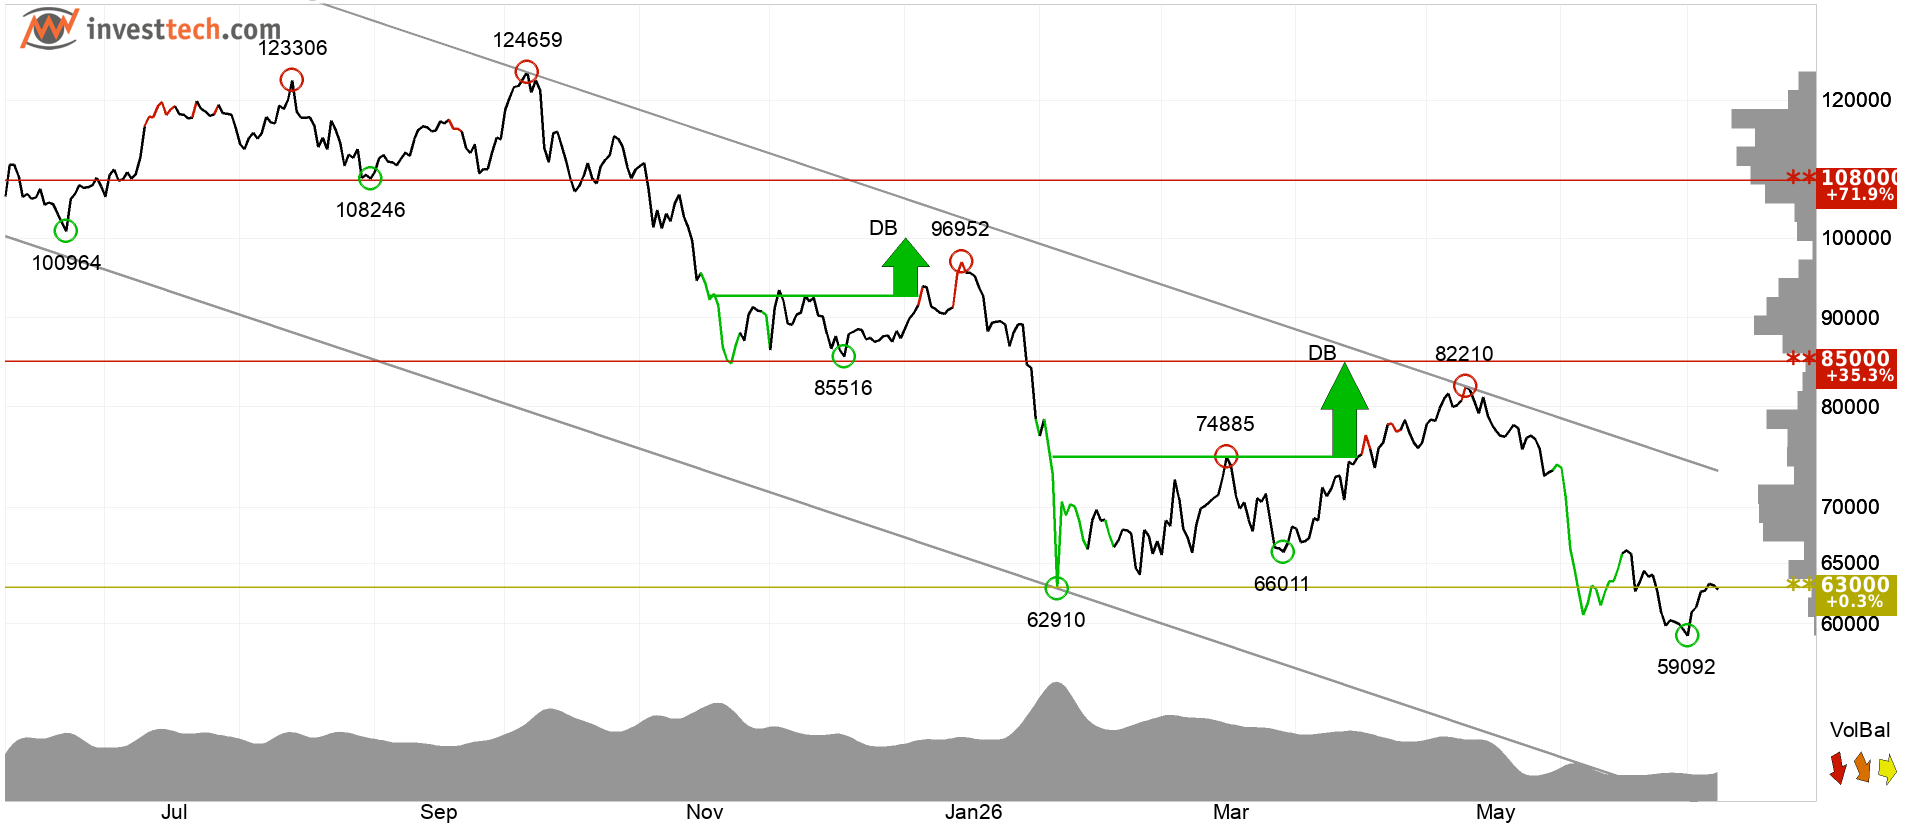
Bitcoin technical analysis
Bitcoin shows weak development in a falling trend channel. | Credit: InvestTech

Meanwhile, corporate Bitcoin holder Strategy remains under pressure after accumulating substantial unrealized losses on its massive Bitcoin position.

Although the company continues to hold more than 840,000 BTC, weakness in its preferred stock has raised questions about its flexibility to continue providing meaningful buying support during future market declines.

Most importantly, Bollinger himself stressed that the pattern remains incomplete. A double bottom becomes a confirmed reversal only when price breaks above the midpoint between the two lows.

Until Bitcoin produces a decisive daily close above approximately $65,000, the fractal “W” remains an intriguing possibility rather than confirmation that the bear market has ended.

Disclaimer: The information provided in this article is for informational purposes only. It is not intended to be, nor should it be construed as, financial advice. We do not make any warranties regarding the completeness, reliability, or accuracy of this information. All investments involve risk, and past performance does not guarantee future results. We recommend consulting a financial advisor before making any investment decisions.
Giuseppe Ciccomascolo

Giuseppe Ciccomascolo began his career as an investigative journalist in Italy, where he contributed to both local and national newspapers, focusing on various financial sectors.

Upon relocating to London, he worked as an analyst for Fitch's CapitalStructure and later as a Senior Reporter for Alliance News. In 2017, Giuseppe transitioned to covering cryptocurrency-related news, producing documentaries and articles on Bitcoin and other emerging digital currencies. He also played a pivotal role in establishing the academy for a cryptocurrency exchange website. Crypto remained his primary area of interest throughout his tenure as a writer for ThirdFloor.

Related

Survey Icon
Help us improve
1 of 4
Is this your first time here?
What brought you here today?
What are you most interested in?
Would you be interested in:
Thank you icon
Thank you for your feedback!
DMCA.com Protection Status