Meet the Top 101 in Crypto

Bitcoin Price Surges Above $63K: Is a Breakout to $67K Next?

Published 06 July 2026
Giuseppe Ciccomascolo
Authors

Key Takeaways

  • Bitcoin has reclaimed $63,000 after rebounding from a 21-month low near $58,000, improving short-term market sentiment.
  • The $65,000-$67,000 resistance zone is the key technical hurdle, with a breakout potentially opening the door to a move toward $72,000.
  • Positive spot Bitcoin ETF inflows will be the key confirmation signal, indicating that fresh demand, not just exhausted selling, is driving the recovery.

Bitcoin has extended its early July recovery, climbing back above $63,000 after briefly plunging below $60,000 at the end of June.

The rebound has been fueled by a combination of improving macroeconomic conditions, signs of institutional accumulation, and a technical recovery from deeply oversold levels.

While the move has restored optimism across the crypto market, Bitcoin is now approaching one of its most significant resistance zones of 2026.

Whether bulls can clear the $65,000-$67,000 range may determine if the latest rally evolves into a broader trend reversal or fades into another corrective bounce.

Try Our Recommended Crypto Exchanges
Sponsored
Disclosure
Opened in 2018
Promotions
Deposit $100, Get an Extra $300 in GOLD!
Coins
Shiba Inu Bitcoin PAX Gold Ampleforth Ethereum +70
Promotions
Receive up to $100,000 worth of exclusive gifts for newcomers upon registration.
Coins
Bitcoin Ethereum Tether USD Coin Solana +76
Opened in 2017
Promotions
Experience a 1-minute swap on a non-custodial platform.
Coins
Bitcoin Ethereum Tether Build'N'Build USD Coin +217
Show More

Technical Momentum Improves as Bitcoin Approaches Major Resistance

From a chart perspective, Bitcoin’s recovery has become increasingly constructive.

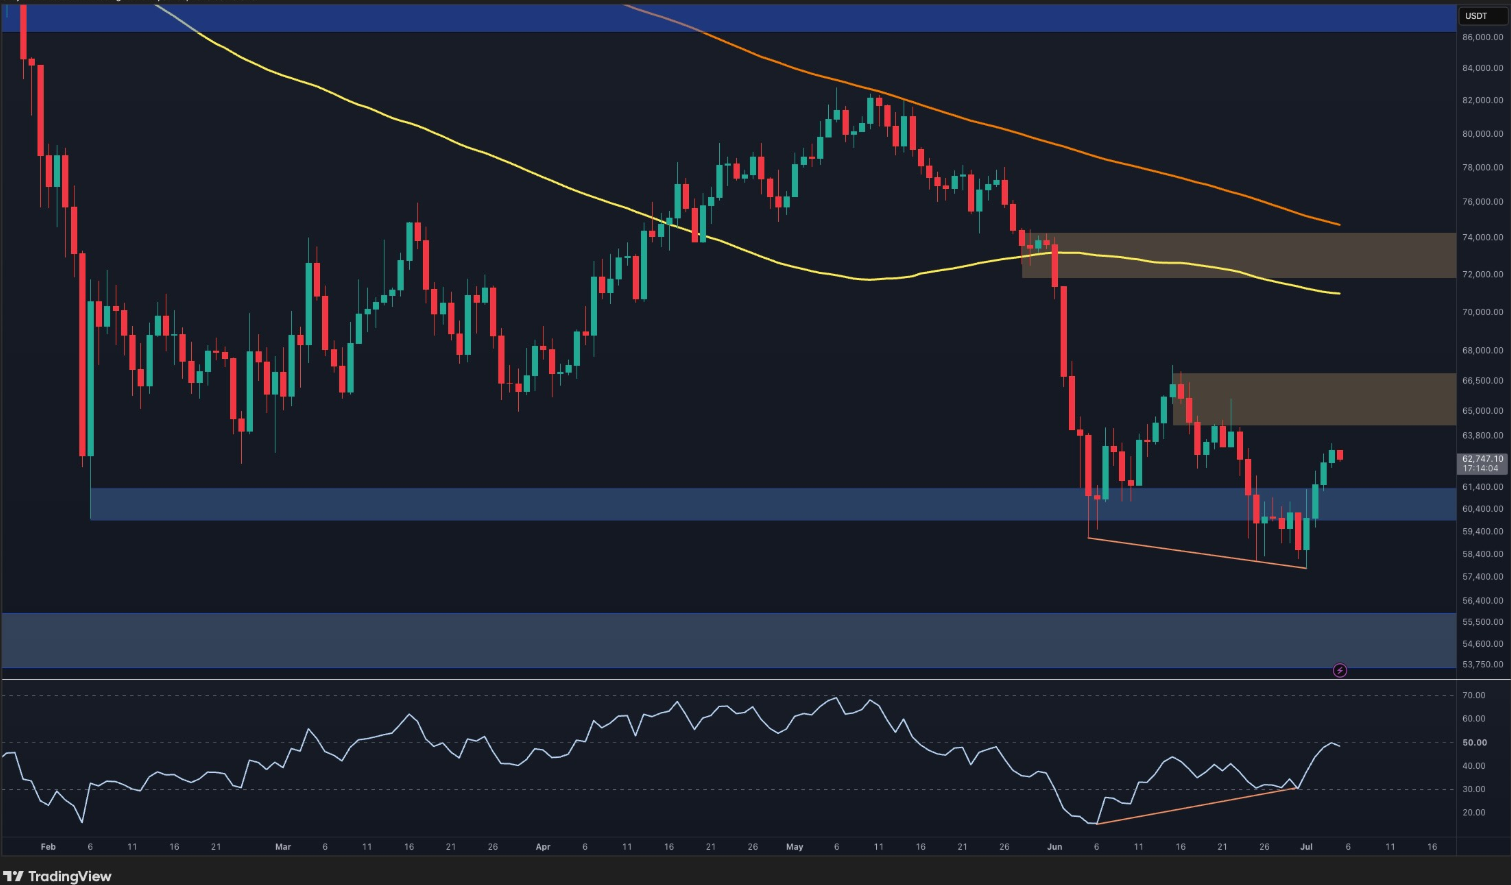
After defending the $58,000-$61,000 support zone, BTC rebounded sharply and reclaimed the $63,000 level, recovering much of June’s losses.

One of the most encouraging technical signals has been the bullish divergence in the daily Relative Strength Index (RSI), where momentum began to improve even as Bitcoin printed comparable lows.

Historically, this type of divergence often appears near market bottoms as selling pressure begins to weaken.

Bitcoin price analysis
Bitcoin price analysis. | Credit: TradingView

On the four-hour chart, Bitcoin has also been forming a falling wedge, a pattern frequently associated with bullish reversals. The cryptocurrency is now testing the wedge’s upper trendline as it approaches a broader supply zone between $64,000 and $66,500.

A decisive breakout above this area would strengthen the bullish case and could open the path toward the key $67,000 resistance level. Beyond that, traders would likely shift their attention to the former support region around $72,000-$74,000, which became resistance after June’s sharp selloff.

However, the broader trend has yet to fully reverse. Bitcoin continues to trade below its declining 100-day and 200-day moving averages, both of which remain important dynamic resistance levels.

Until those are reclaimed, the current advance is technically still part of a broader corrective structure.

Should buyers fail to break above the current resistance cluster, Bitcoin could return to consolidate around the $60,000- $61,000 support area before another attempt higher.

Macro Conditions and Institutional Positioning Support the Recovery

Beyond the charts, macroeconomic conditions have become more favorable for risk assets.

Bitcoin’s latest advance followed weaker-than-expected US employment data. In fact, June nonfarm payrolls increased by only 57,000 jobs versus expectations above 110,000.

The softer labor market reinforced expectations that the Federal Reserve may have greater room to ease monetary policy later this year. This may push Treasury yields and the US dollar lower.

That environment has benefited both gold and Bitcoin, although the cryptocurrency has outperformed the precious metal during the recent rebound. Bitcoin has gained roughly 10% since the start of July, compared with about 8% for gold over the same period.

Institutional positioning also suggests that selling pressure may be easing.

Yusuf Fakhro, Partner at ARP Digital, told CCN the market has moved from panic selling toward a more balanced phase.

“Bitcoin reclaiming the low $60,000s after touching a 21-month low near $58,000 at the start of July is the most constructive signal crypto has offered in weeks.”

Fakhro noted that the June decline was accompanied by clear capitulation signals.

“Five-day ETF outflows hit 34,000 BTC, the second-largest on record… Spot ETP holdings fell to their lowest since May 2025. This was forced, indiscriminate selling, and it is exactly the kind of flush that tends to mark local exhaustion rather than the start of a fresh leg lower.”

He also pointed to falling institutional participation, with CME Bitcoin futures open interest dropping to a 32-month low and six-month put skew reaching one of its highest readings on record. These conditions have historically coincided with important market bottoms.

Why ETF Flows Could Decide Whether BTC Reaches $67K

Despite the improving outlook, analysts caution that Bitcoin has not yet confirmed a sustainable trend reversal.

While whale-sized transactions remain elevated, suggesting that larger investors continue to accumulate near current prices, leveraged positioning has started to increase again.

Rising perpetual futures funding rates indicate that some traders are becoming more aggressive in betting on higher prices. And this increases volatility risk if the rally loses momentum.

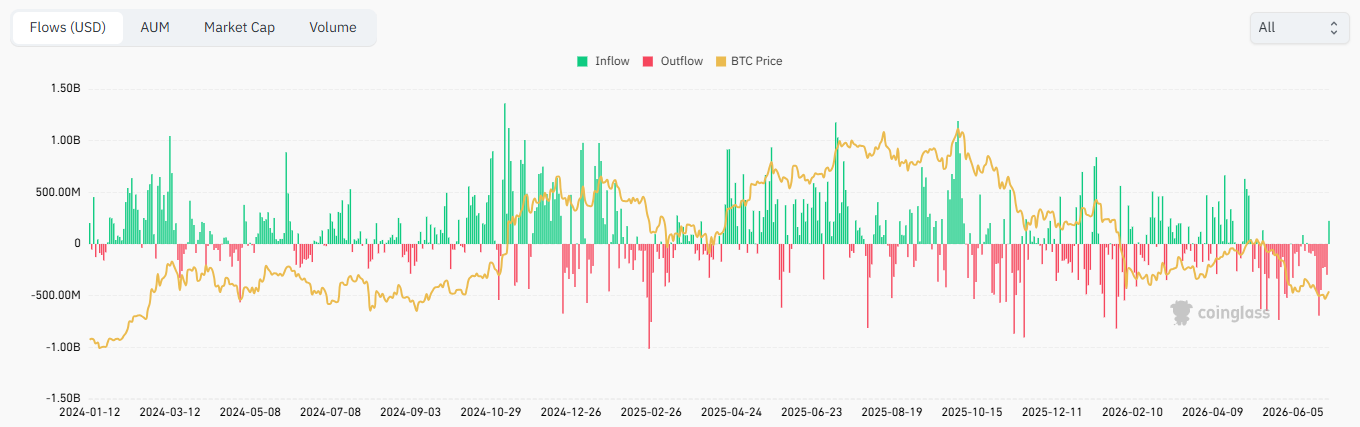
Bitcoin spot ETF net inflow
Total Bitcoin spot ETF net inflow. | Credit: Bitcoin spot ETF net inflow

Fakhro believes the market has entered a healthier phase but says confirmation is still needed.

“For investors, the setup has shifted from falling knife to contested floor.”

However, he added that traders should remain disciplined rather than assume the correction is over.

“That does not make the bottom confirmed. It makes this a level to accumulate with discipline rather than chase, watching ETF flows to turn positive as the signal that demand, not just exhausted supply, has returned.”

That observation aligns closely with Bitcoin’s current technical picture. The recovery has improved sentiment, but a decisive break above $65,000- $67,000 is necessary to validate a larger bullish reversal.

Disclaimer: The information provided in this article is for informational purposes only. It is not intended to be, nor should it be construed as, financial advice. We do not make any warranties regarding the completeness, reliability, or accuracy of this information. All investments involve risk, and past performance does not guarantee future results. We recommend consulting a financial advisor before making any investment decisions.
Giuseppe Ciccomascolo

Giuseppe Ciccomascolo began his career as an investigative journalist in Italy, where he contributed to both local and national newspapers, focusing on various financial sectors.

Upon relocating to London, he worked as an analyst for Fitch's CapitalStructure and later as a Senior Reporter for Alliance News. In 2017, Giuseppe transitioned to covering cryptocurrency-related news, producing documentaries and articles on Bitcoin and other emerging digital currencies. He also played a pivotal role in establishing the academy for a cryptocurrency exchange website. Crypto remained his primary area of interest throughout his tenure as a writer for ThirdFloor.

Related

Survey Icon
Help us improve
1 of 4
Is this your first time here?
What brought you here today?
What are you most interested in?
Would you be interested in:
Thank you icon
Thank you for your feedback!
DMCA.com Protection Status