Meet the Top 101 in Crypto

Bitcoin Price Faces Critical $65.8K Resistance as Bulls Eye Breakout

Published 07 July 2026
Giuseppe Ciccomascolo
Authors

Key Takeaways

  • BTC has recovered above $64,000 but faces strong resistance between $65,700 and $65,800.
  • Bitcoin is trading above its 20-day EMA, and the hourly charts show bullish momentum, with the price holding above all major moving averages.
  • Shrinking stablecoin market capitalization and rising whale inflows to exchanges suggest liquidity remains weak and profit-taking could limit further upside.

Bitcoin has staged an impressive recovery to start July, climbing more than 8% from recent lows and reclaiming the $64,000 level.

Yet despite the improving momentum, the cryptocurrency now faces what many analysts consider its biggest technical hurdle: a dense resistance zone around $65,700-$65,800 that could determine whether the latest rally develops into a sustained uptrend or fades into another lower high.

The recovery comes as macro sentiment improves following softer US economic data and renewed optimism around monetary policy, but investors remain cautious.

The Fear & Greed Index remains firmly in “Extreme Fear” territory, while on-chain metrics suggest liquidity remains fragile and that whales have started taking profits into the rebound.

Adding another layer of uncertainty, Strategy completed its largest-ever Bitcoin sale, offloading approximately $216 million worth of BTC.

Try Our Recommended Crypto Exchanges
Sponsored
Disclosure
Opened in 2018
Promotions
Deposit $100, Get an Extra $300 in GOLD!
Coins
Shiba Inu Bitcoin PAX Gold Ampleforth Ethereum +70
Promotions
Receive up to $100,000 worth of exclusive gifts for newcomers upon registration.
Coins
Bitcoin Ethereum Tether USD Coin Solana +76
Opened in 2017
Promotions
Experience a 1-minute swap on a non-custodial platform.
Coins
Bitcoin Ethereum Tether Build'N'Build USD Coin +217
Show More

Bitcoin’s technical picture improves, but $65.8K remains the key battleground

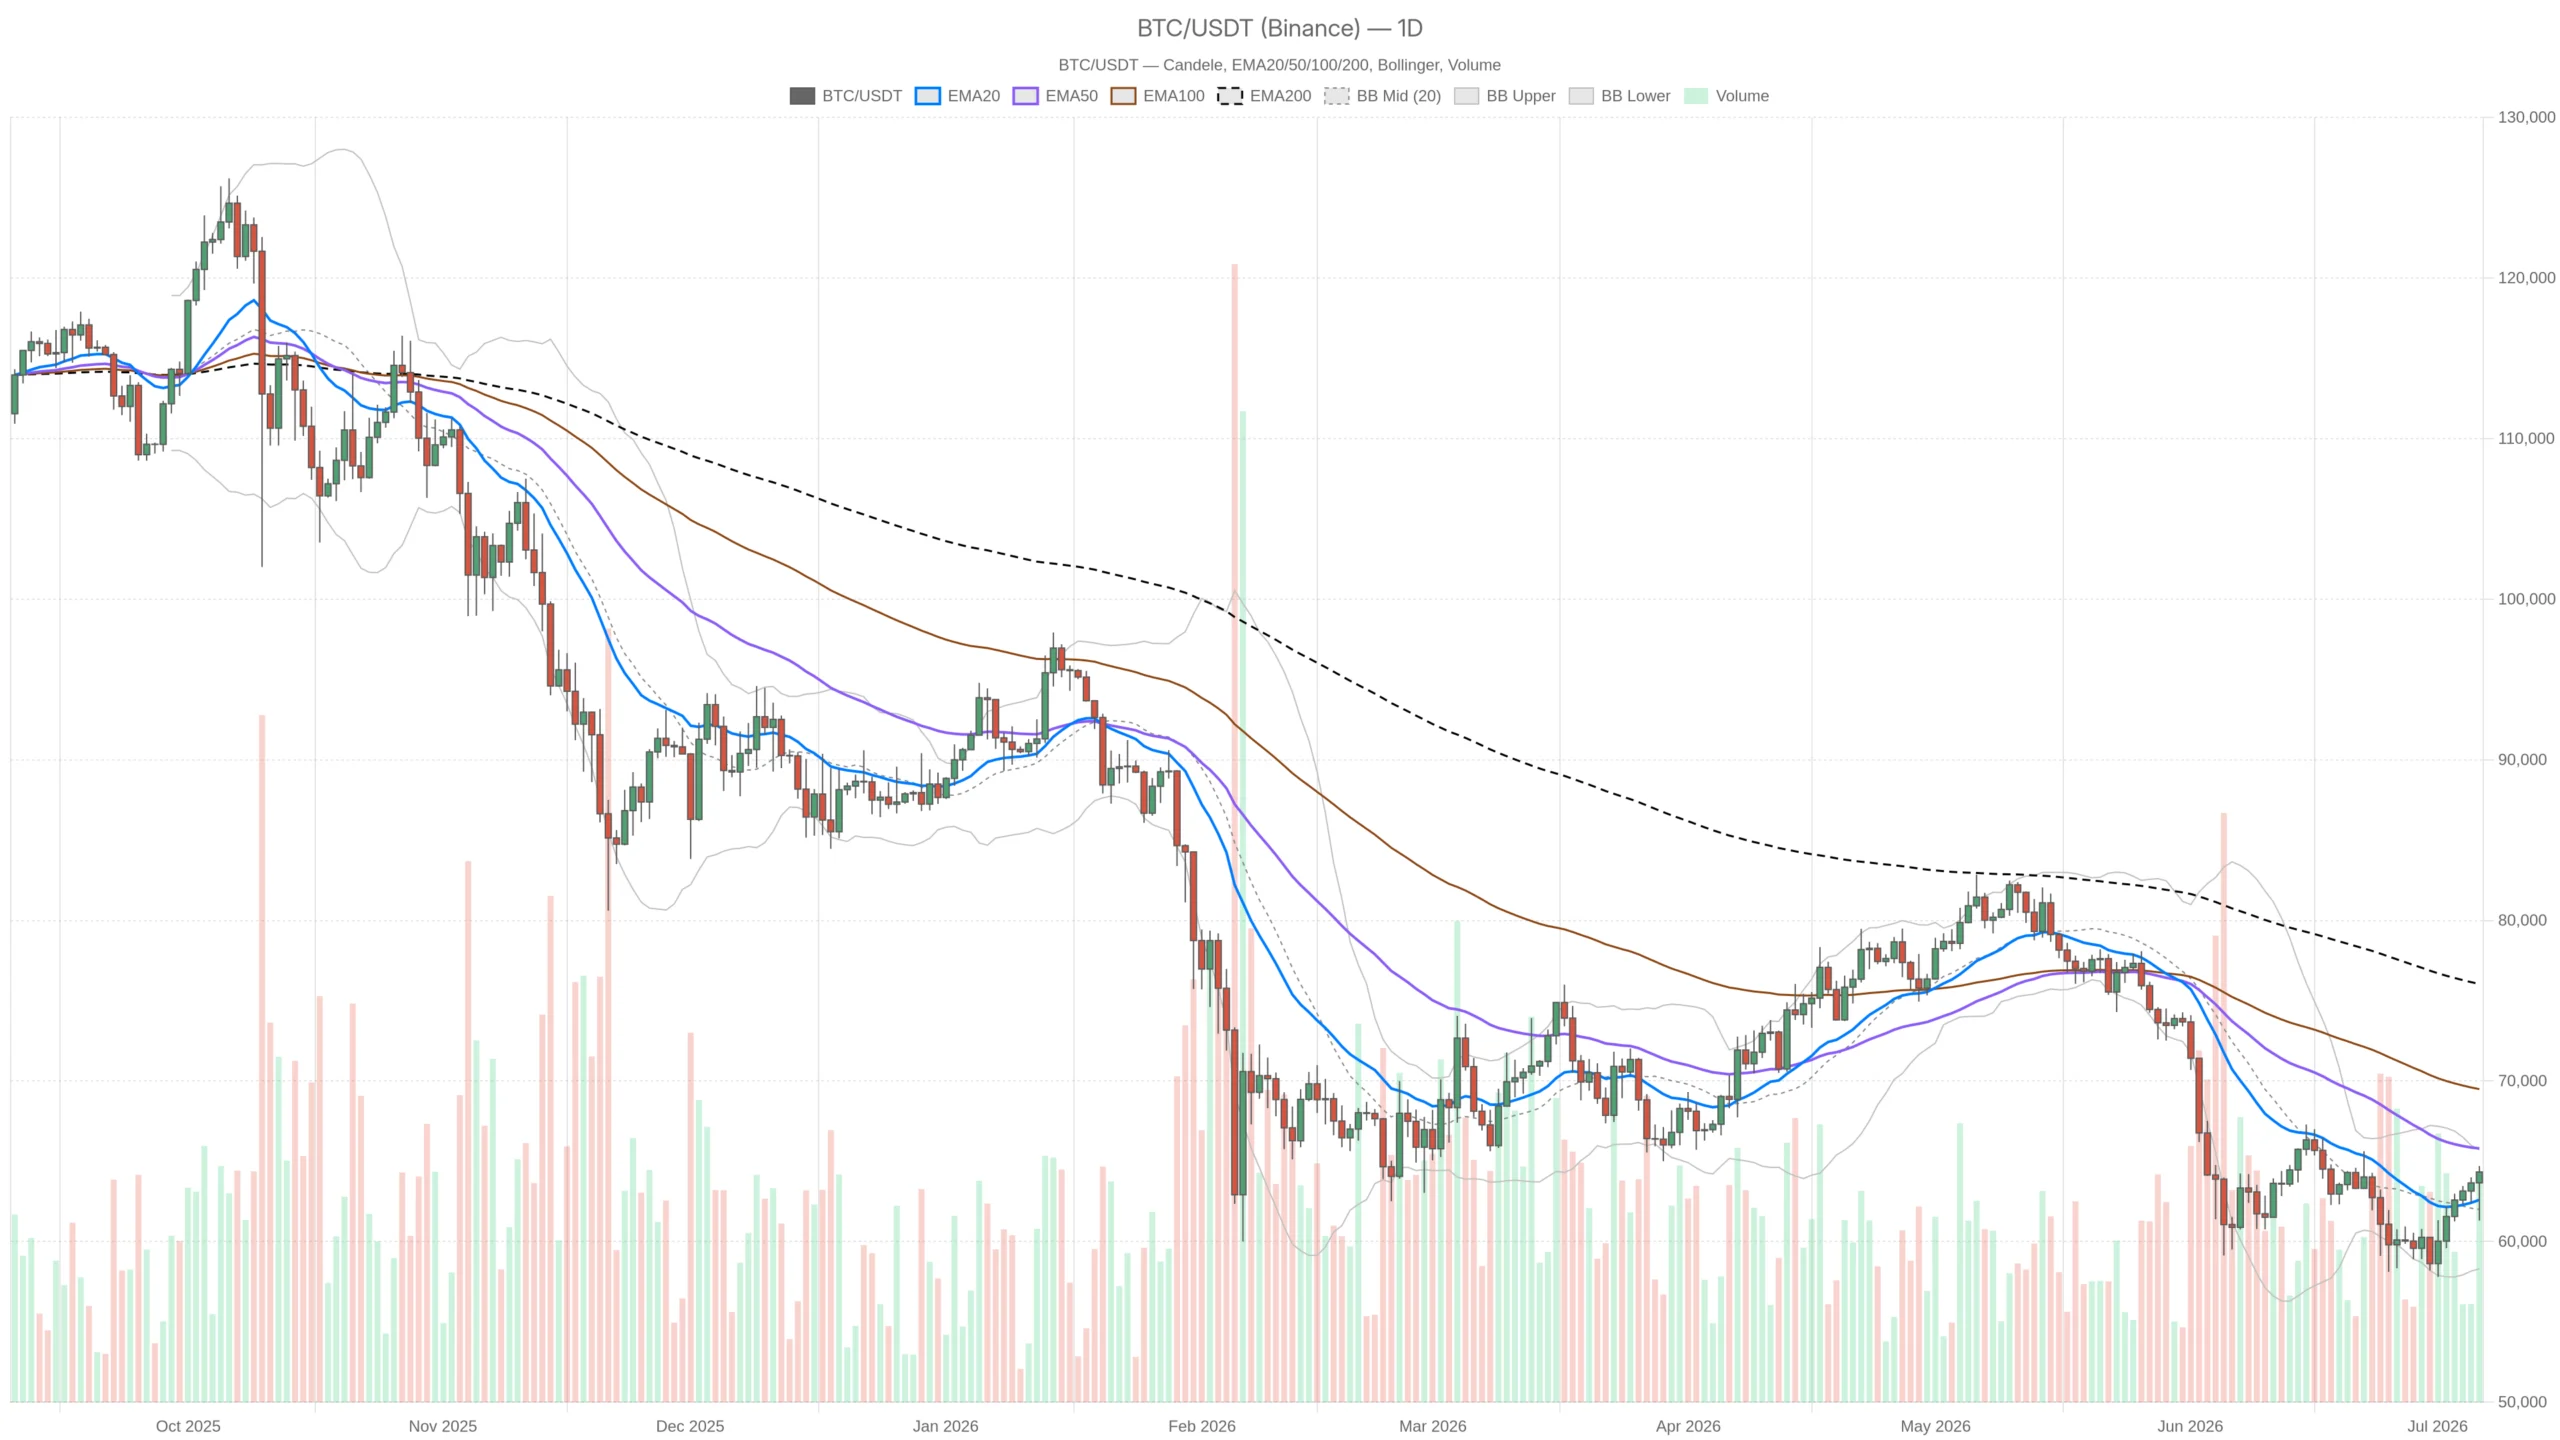
From a chart perspective, Bitcoin is showing encouraging signs of recovery but has not fully confirmed a bullish trend.

The cryptocurrency is trading above its 20-day exponential moving average (EMA), suggesting short-term momentum has shifted in favor of buyers.

However, the 50-day EMA near $65,800 continues to cap upside attempts, creating a significant technical barrier alongside the upper Bollinger Band.

This convergence of resistance levels makes the $65,700-$65,800 zone particularly important. A decisive daily close above it would signal that buyers have regained control and could open the door toward the next resistance area between $68,000 and $70,000.

BTC/USDT daily chart
BTC/USDT daily chart. | Credit: TradingView

Momentum indicators paint a mixed picture.

The Relative Strength Index (RSI) has recovered to neutral territory around the mid-50s, suggesting there is still room for additional upside before conditions become overbought.

Meanwhile, the Moving Average Convergence Divergence (MACD) has generated an early bullish crossover, although the broader trend remains below the zero line, indicating that the recovery has yet to fully establish a bull trend.

Short-term charts appear considerably stronger. On hourly timeframes, Bitcoin trades above all major moving averages, while momentum indicators continue to point higher.

This alignment suggests buyers remain in control over shorter periods, even if the daily chart still requires confirmation.

The challenge for bulls is converting that intraday strength into a decisive breakout on higher timeframes.

Strategy Sale, Whale Activity, and Weak Liquidity Keep Risks Elevated

Technical indicators are only one part of the equation.

One of the week’s biggest headlines came from Strategy, which sold approximately $216 million worth of Bitcoin, marking the company’s largest disposal of the cryptocurrency to date.

While the transaction raised concerns among investors accustomed to Strategy’s long-term accumulation strategy, the market has so far avoided a sharp selloff.

The ability to absorb such significant selling pressure may itself be interpreted as a sign of underlying demand. However, other on-chain indicators suggest caution remains warranted.

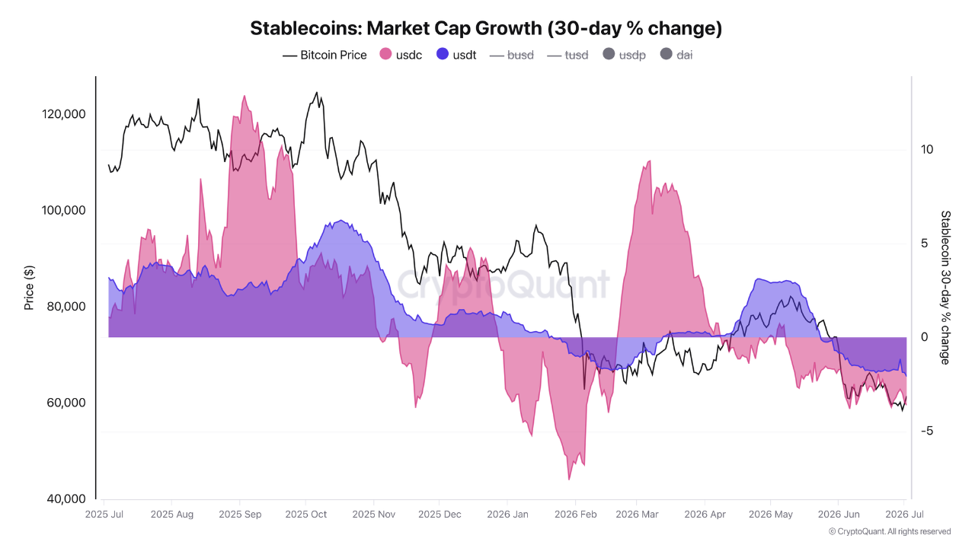
CryptoQuant data shows that stablecoin market capitalization contracted during June, indicating fresh liquidity has not yet returned to crypto markets.

Historically, sustained Bitcoin rallies have coincided with expanding USDT and USDC supplies, providing additional capital to fuel higher prices.

Instead, current spot demand appears relatively modest.

Stablecoin market cap
Stablecoin market cap shrank in June. | Credit: CryptoQuant

Whale behavior also deserves attention. The Bitcoin Exchange Whale Ratio has risen steadily over the past few days. This suggests that large holders have increased transfers to exchanges during the recovery.

Activities like this often precede profit-taking and can limit upside if institutional buying fails to absorb the additional supply.

This divergence between improving price action and weakening liquidity conditions explains why several analysts remain cautious despite Bitcoin’s recent rebound.

Can Bitcoin break above resistance?

The coming sessions may prove decisive for Bitcoin’s short-term direction.

The bullish scenario remains relatively straightforward. If Bitcoin successfully closes above $65,800 with strong trading volume, the move would invalidate the recent series of lower highs and potentially trigger fresh buying toward the $68,000-$70,000 range.

Such a breakout would also confirm that buyers have absorbed both Strategy‘s large sale and ongoing whale distribution.

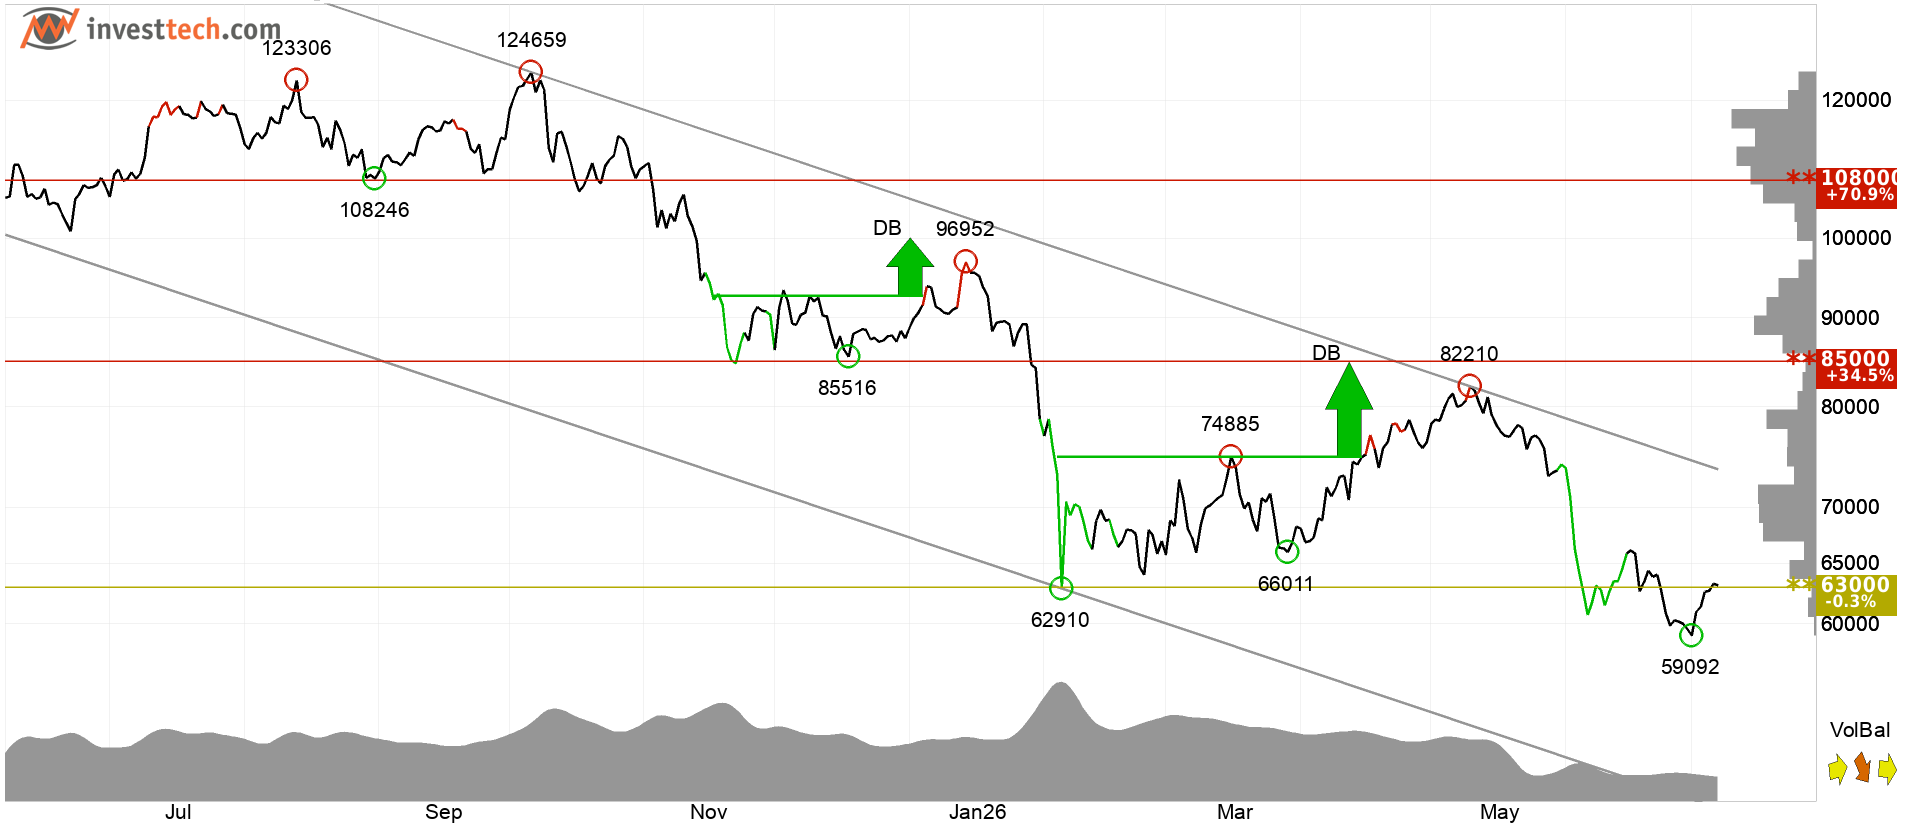
Bitcoin technical analysis
Investors have accepted lower prices over time to get out of Bitcoin. | Credit: InvestTech

On the other hand, failure at resistance could quickly shift sentiment.

A rejection from the $65,700 area followed by a move below $63,000 would reinforce the view that the current rally is simply a relief bounce within a broader corrective trend.

Additional weakness beneath the $62,000 support area could expose Bitcoin to a retest of the lower Bollinger Band near $58,000. Especially if liquidity conditions continue deteriorating.

Macro events remain another important wildcard. Investors will closely monitor upcoming Federal Reserve communications for clues about future interest rate policy. Any improvement in global liquidity conditions could provide the catalyst Bitcoin currently lacks.

Disclaimer: The information provided in this article is for informational purposes only. It is not intended to be, nor should it be construed as, financial advice. We do not make any warranties regarding the completeness, reliability, or accuracy of this information. All investments involve risk, and past performance does not guarantee future results. We recommend consulting a financial advisor before making any investment decisions.
Giuseppe Ciccomascolo

Giuseppe Ciccomascolo began his career as an investigative journalist in Italy, where he contributed to both local and national newspapers, focusing on various financial sectors.

Upon relocating to London, he worked as an analyst for Fitch's CapitalStructure and later as a Senior Reporter for Alliance News. In 2017, Giuseppe transitioned to covering cryptocurrency-related news, producing documentaries and articles on Bitcoin and other emerging digital currencies. He also played a pivotal role in establishing the academy for a cryptocurrency exchange website. Crypto remained his primary area of interest throughout his tenure as a writer for ThirdFloor.

Related

Survey Icon
Help us improve
1 of 4
Is this your first time here?
What brought you here today?
What are you most interested in?
Would you be interested in:
Thank you icon
Thank you for your feedback!
DMCA.com Protection Status