BTC and ETH dipped as markets digested the Fed decision and strong Big Tech Q1 earnings | Credit: Hameem Sarwar
Share
Key Takeaways
Strong Big Tech earnings and $710 billion in AI capex plans failed to lift major crypto assets.
BTC and ETH dropped amid unchanged Fed policy and capital rotation into the equities/AI sector.
Near term, crypto remains range-bound, with direction depending on whether key resistance levels will break.
On April 29, Big Tech companies reported earnings that mostly exceeded expectations, totaling $710 billion.
Yet Bitcoin (ETH) and Ethereum (ETH) prices fell. Here is how it all happened and what could be next for the market.
What Big Tech Reported
Big Tech’s latest earnings season was spectacular.
Alphabet (Google) reported $109.9 billion in revenue and $62.6 billion in net income for the first quarter, with CEO Sundar Pichai saying AI investments are “lighting up every part of the business.”
Amazon followed with $181.5 billion in net sales and $30.3 billion in net income.
Sponsored
Disclosure
We sometimes use affiliate links in our content, when clicking on those we might receive a commission at no extra cost to you. By using this website you agree to our terms and conditions and privacy policy.
CEO Andy Jassy pointed to continued growth in AWS and rising demand for AI-related services.
Microsoft posted $82.9 billion in revenue and $31.8 billion in net income for the quarter ending March 31, 2026.
Leadership emphasized strong momentum in its cloud division and AI offerings.
Meanwhile, Meta reported $56.31 billion in revenue and $26.77 billion in net income.
The company also raised its capital expenditure guidance to support ongoing AI and infrastructure expansion, with CEO Mark Zuckerberg describing the quarter as a key milestone in Meta’s AI push.
Why Is the Market Punishing Crypto?
Despite strong earnings from Big Tech, crypto markets have struggled to keep pace.
According to CCN’s findings, Q1 results helped lift several major tech stocks, though not all shared the upside—Amazon, for example, saw its stock decline.
Meanwhile, Bitcoin failed to retest the $80,000 level, and Ethereum was unable to break above the key $2,500 psychological mark.
So what’s behind the disconnect?
First, expectations didn’t match reality. Markets had already priced in strong earnings alongside hopes of a more accommodative monetary policy.
Second, the $710 billion capex push from Big Tech hyperscalers signals a major long-term investment cycle.
While this supports sectors like semiconductors and cloud infrastructure, it doesn’t directly benefit crypto—and may even divert capital away from it.
At the same time, spot ETF flows and exchange data pointed to net selling pressure, with higher inflows into exchanges during the period.
When large funds or systematic traders reduce exposure following major macro or corporate events, crypto liquidity tends to thin out, leading to increased volatility.
Taken together, Big Tech’s Q1 earnings appear to have triggered a classic “sell the news” reaction in crypto markets, weighing on both BTC and ETH.
Bitcoin Price Prediction
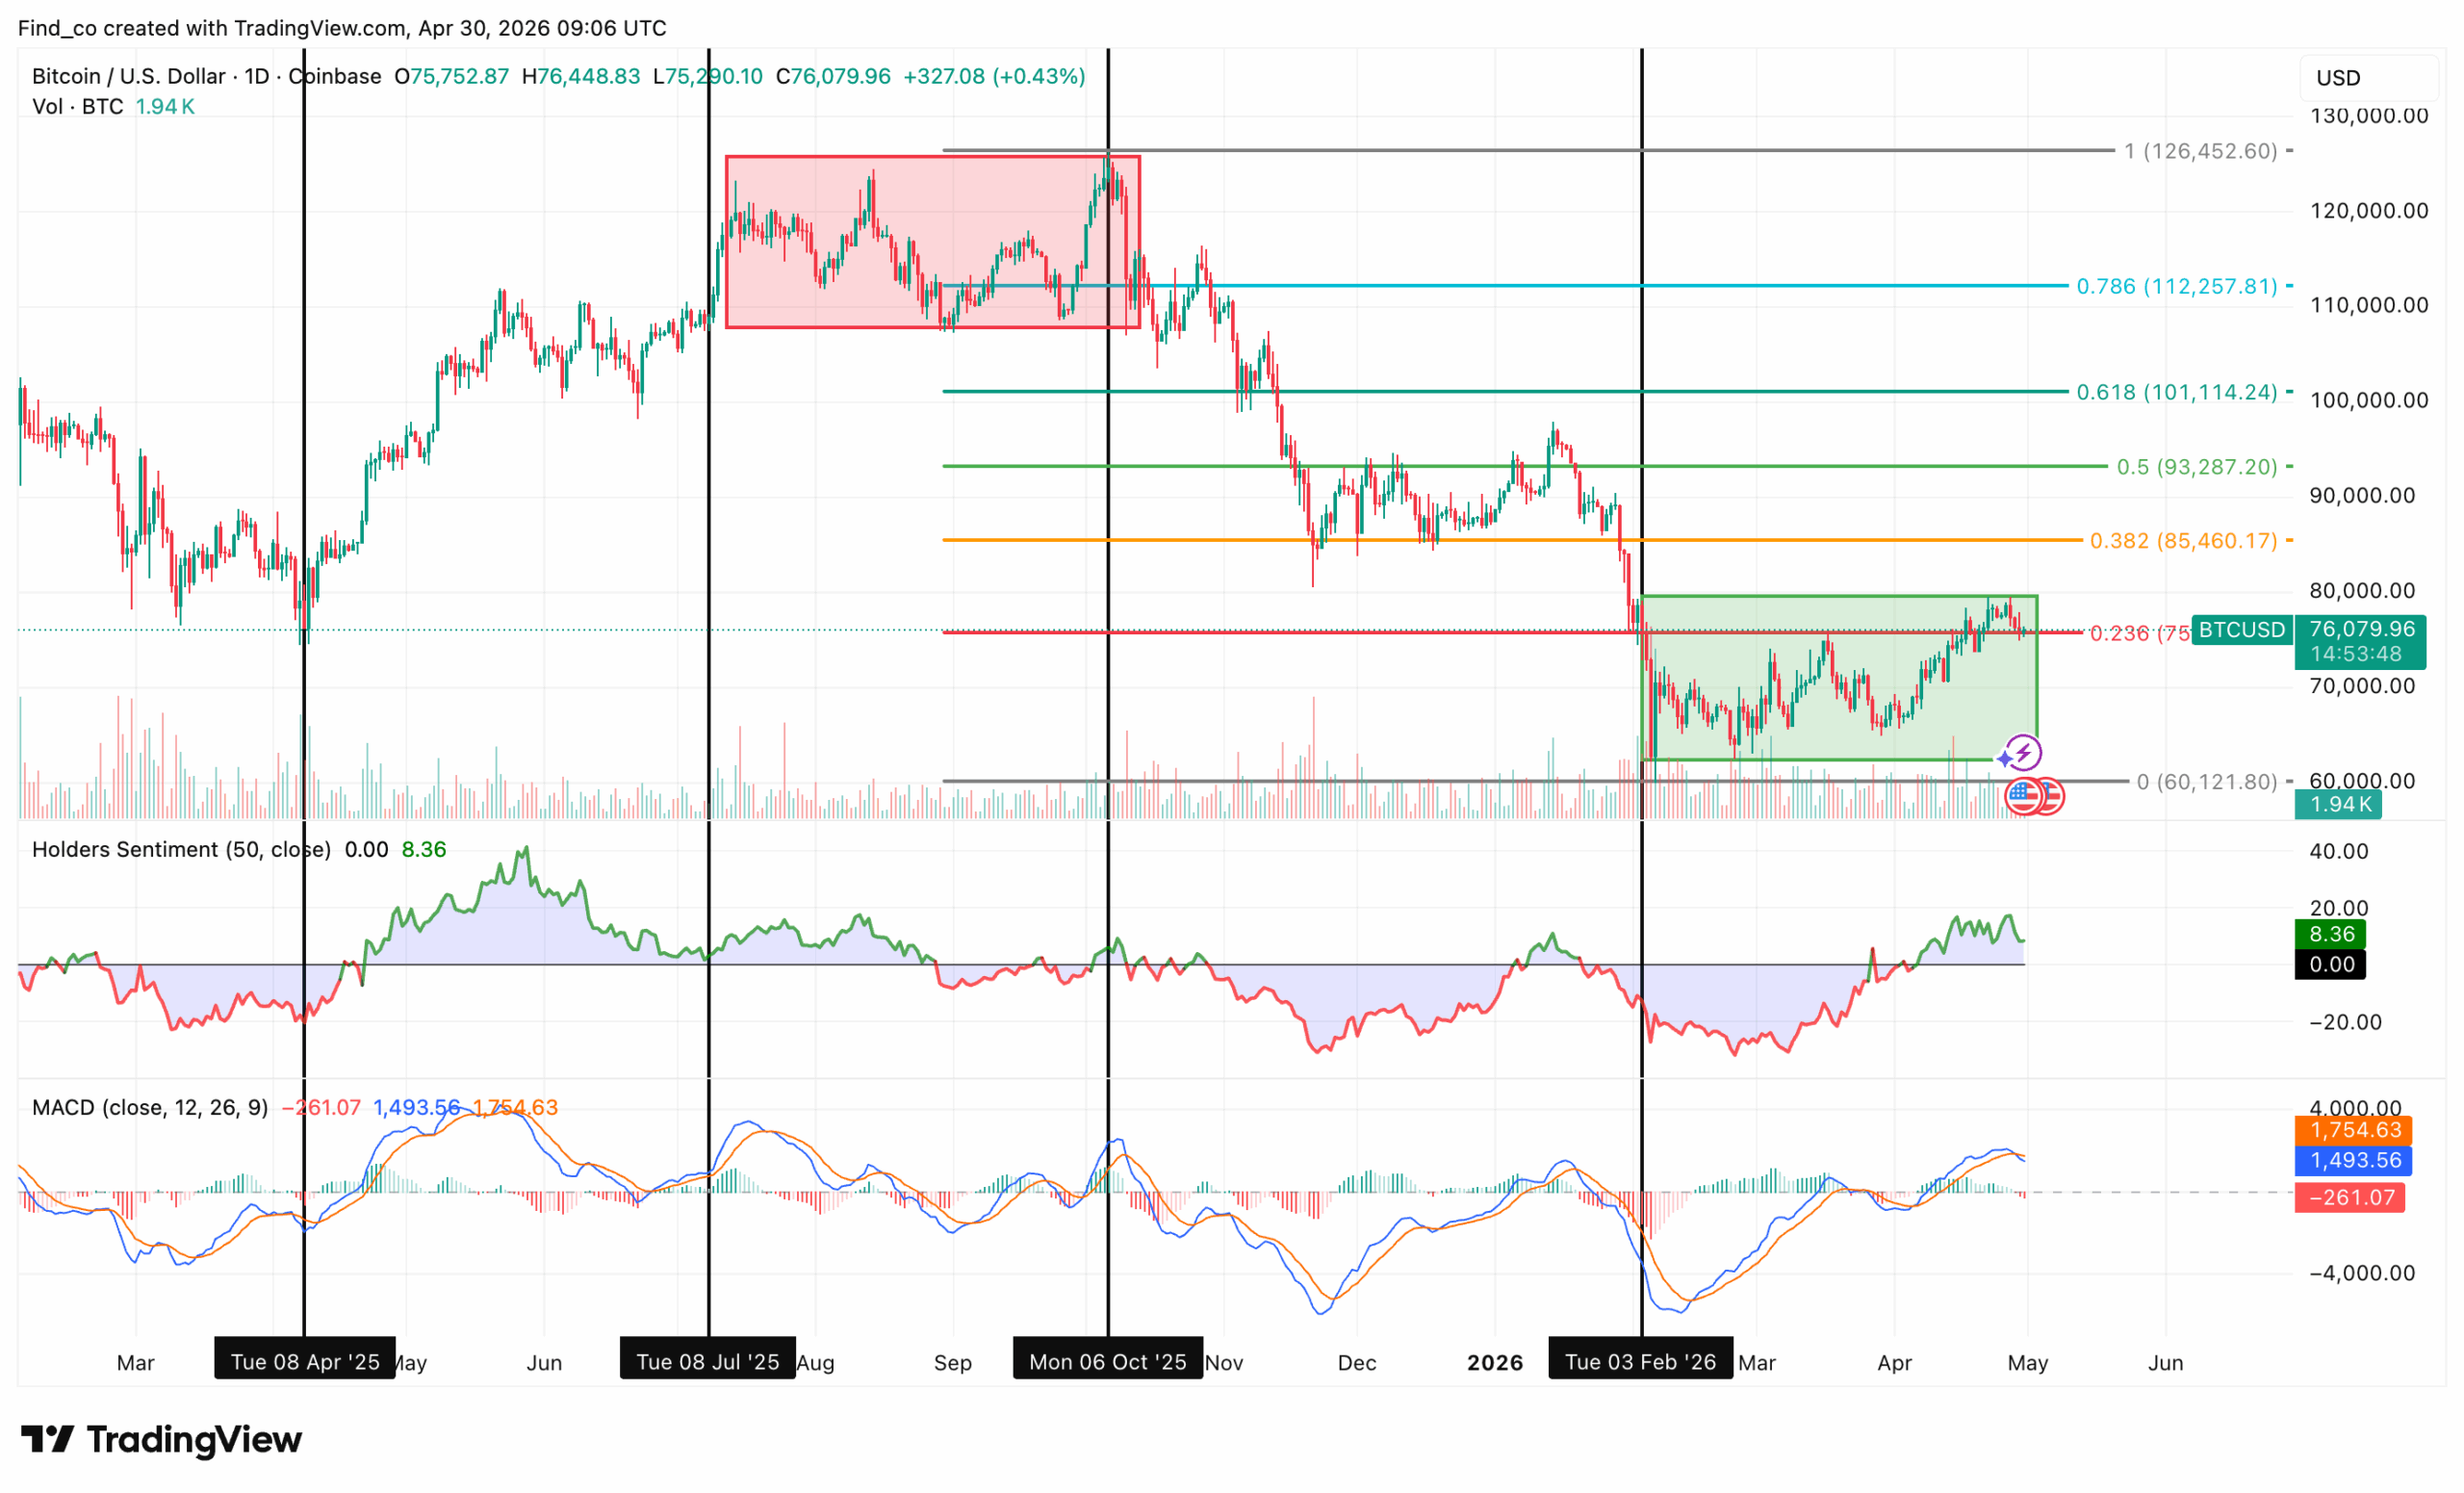
On the technical side, Bitcoin’s price is currently grinding into a key reclaim zone after its breakdown earlier this year.
At the time of writing, BTC’s price is pushing back into the 0.236 fib region around $77,000, which is acting as immediate resistance.
This level is important because it sits right at the top of the current recovery range.
A break and hold above this zone would signal that the market is ready to transition out of this consolidation and target higher levels, with the next key areas sitting around $85,000 (0.382) and then $93,000 (0.5).
What’s supporting the move is the steady recovery in holders’ sentiment, which has flipped back positive and is trending higher.
That suggests longer-term participants are regaining confidence after the capitulation phase earlier in the year.
At the same time, MACD has already printed a bullish crossover and is pushing higher, confirming that momentum has shifted in favor of buyers.
However, this is still a range until proven otherwise.
The rejection from the $77,000 area would keep price rotating inside the green box, with support sitting back down toward $65,000, where the last major demand zone formed after the breakdown.
So the key read here is simple. Bitcoin’s price is attempting to reclaim range highs with improving sentiment and momentum.
However, the real confirmation comes only when it flips $76,000 into support.
If that happens, the path toward 85,000 opens up. If not, this remains a sideways market with risk of another pullback into the lower range.
Ethereum Price Prediction
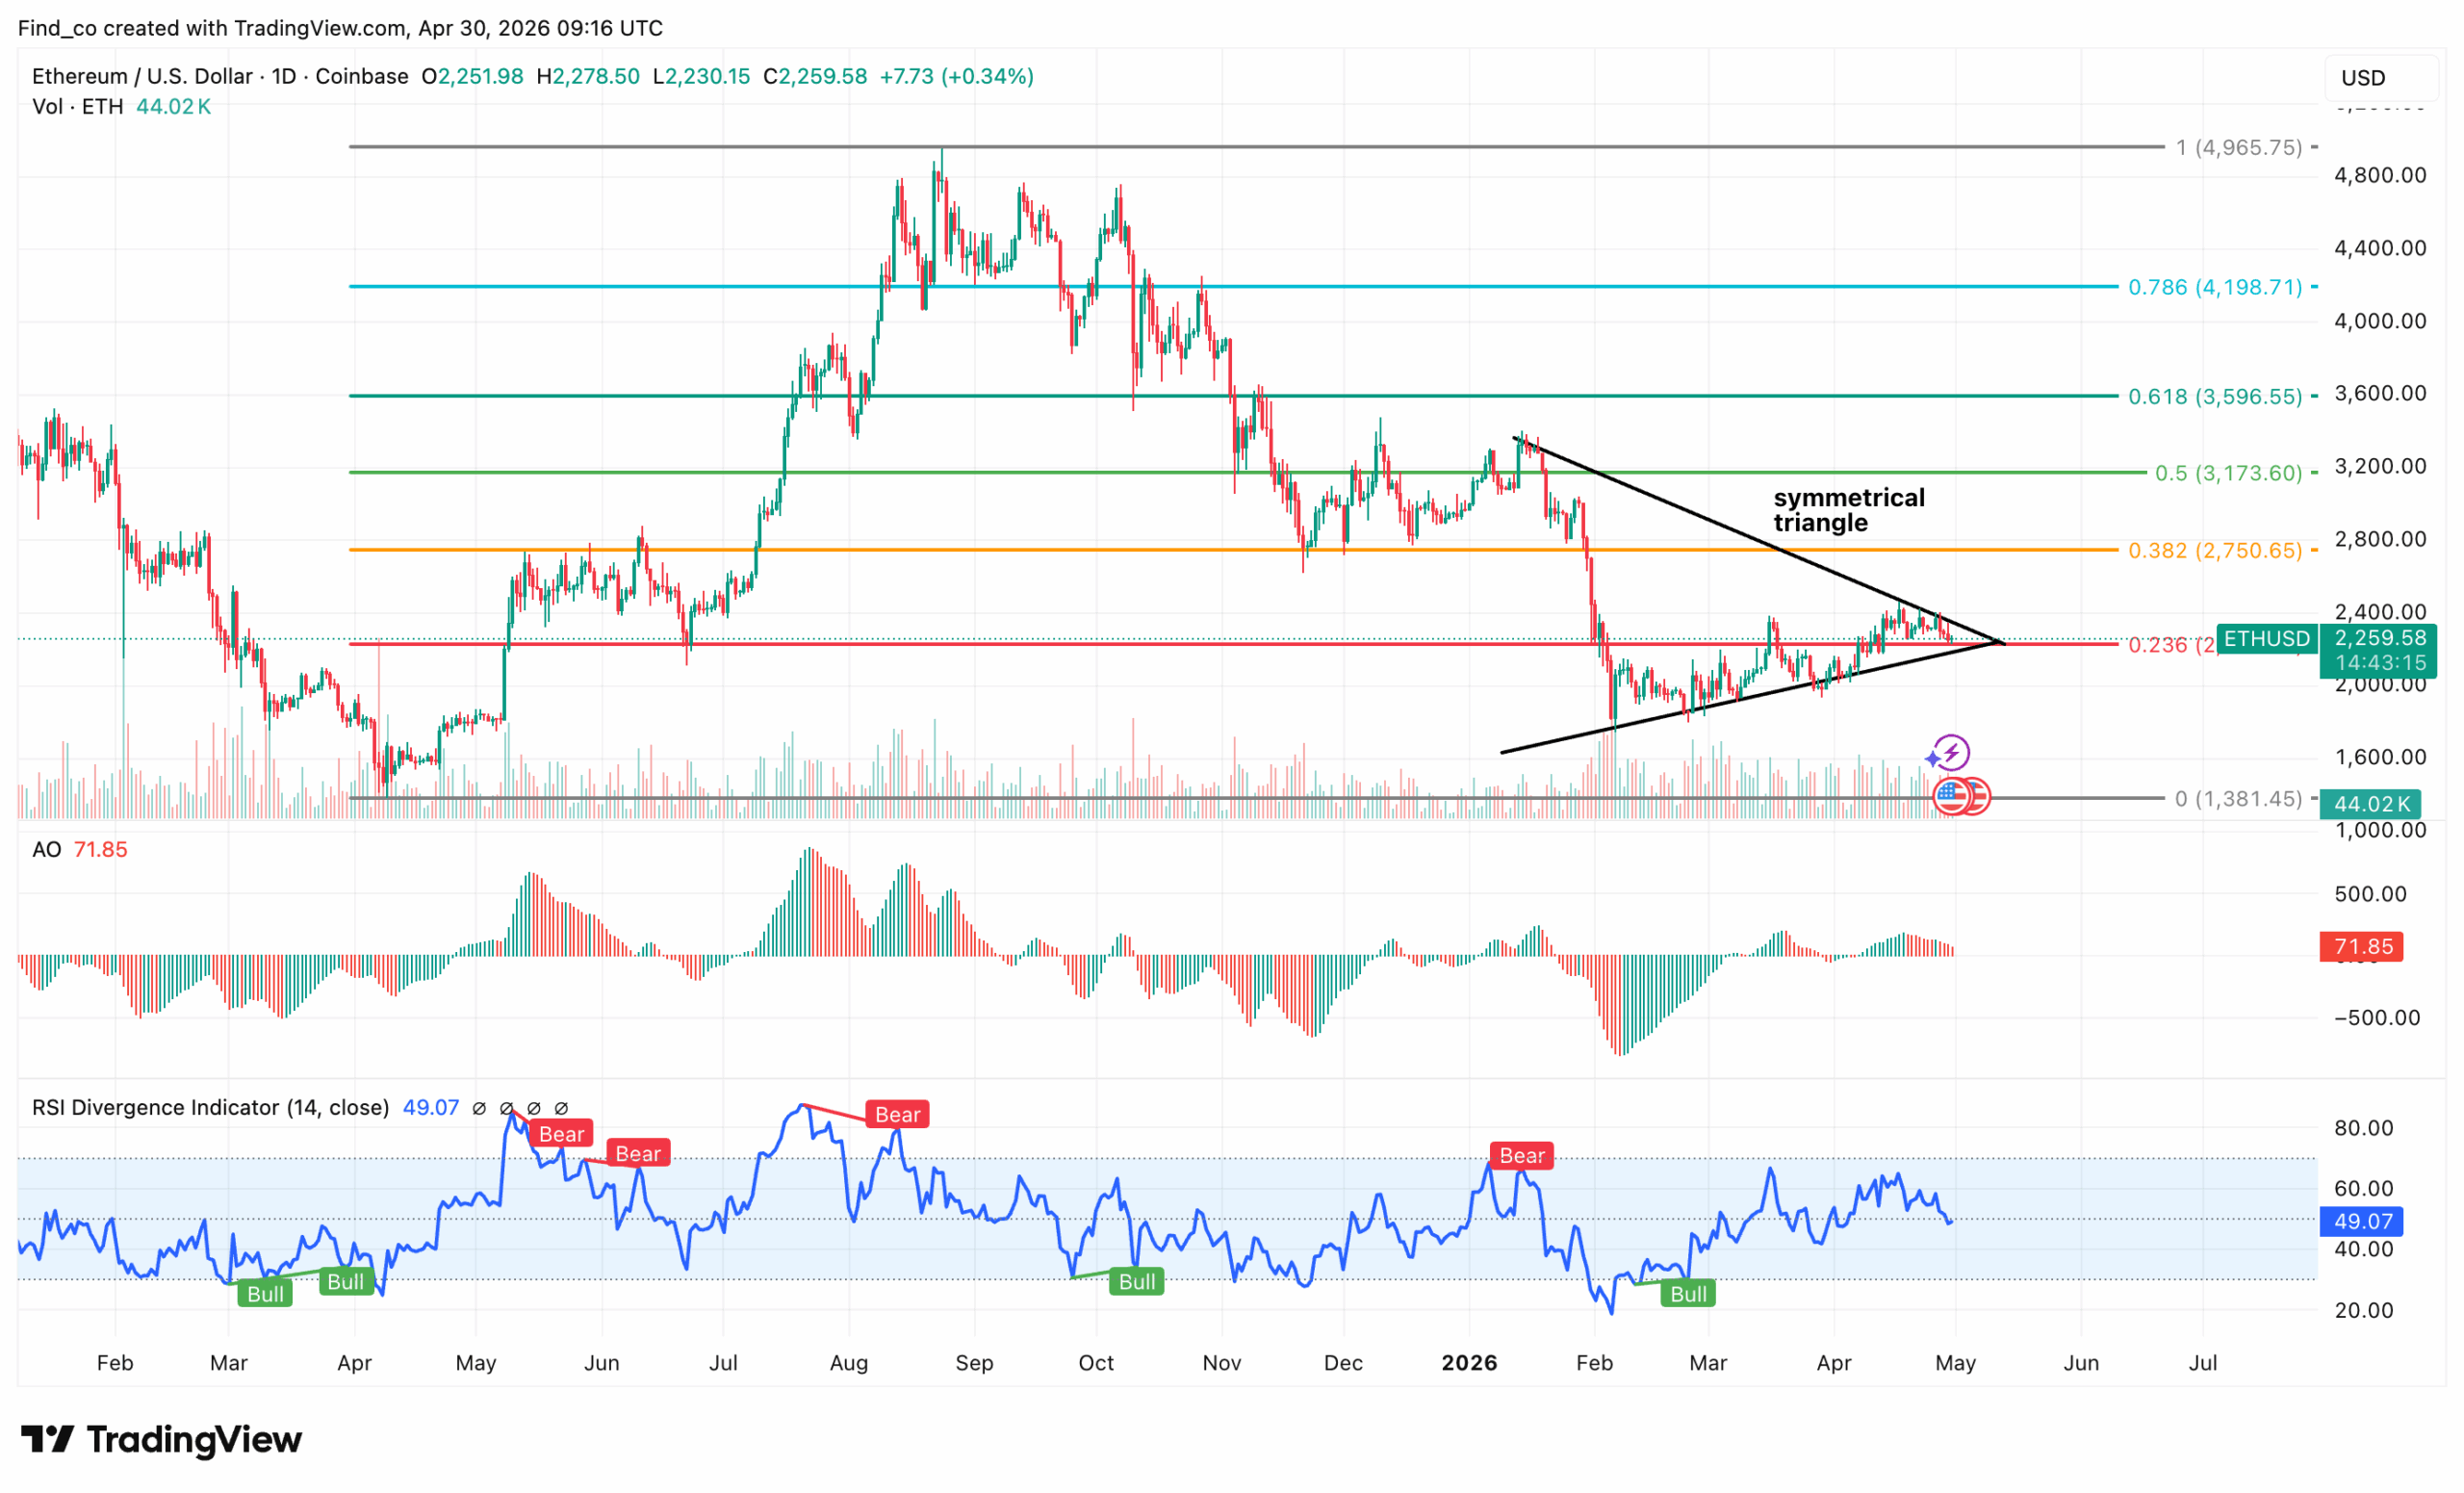
Ethereum is coiling into a tight decision point, with price compressing within a symmetrical triangle at the 0.236 fib, making this a high-probability breakout setup.
The broader structure is still corrective after the macro top, but the selling pressure has clearly slowed.
As shown below, the Awesome Oscillator (AO) flattens, indicating neutral momentum.
Besides that, the Relative Strength Index (RSI) is sitting around neutral, meaning momentum is balanced and waiting for direction rather than trending.
What matters here is the breakout direction.
If ETH’s price breaks above the triangle and reclaims $2,400 clean, that would likely trigger a continuation toward $2,750 (0.382), then potentially into the $3,100 (0.5) if momentum builds.
That’s where the structure starts shifting back toward a more bullish recovery.
On the downside, if the triangle breaks lower, the next key area is the $2,000 region, with deeper support closer to $1,600, where the last strong base formed.
Disclaimer:
The information provided in this article is for informational purposes only. It is not intended to be, nor should it be construed as, financial advice. We do not make any warranties regarding the completeness, reliability, or accuracy of this information. All investments involve risk, and past performance does not guarantee future results. We recommend consulting a financial advisor before making any investment decisions.
Victor Olanrewaju is a crypto analyst and reporter at CCN with deep roots in on-chain research and technical analysis. His crypto journey began in 2017, but it was the 2020 Uniswap airdrop that sparked a full-time pivot into the space.
With a foundation in copywriting, Victor honed his craft creating high-converting content for leading crypto brokers — most notably an XRP price prediction that ranked #1 on Google during the 2021 bull run.
He later joined AMBCrypto in 2022, where he combined storytelling with technical and on-chain analysis to cover key market narratives.
In 2024, he expanded his expertise at BeInCrypto, collaborating with analysts and using tools like Glassnode, Santiment, and IntoTheBlock to break down Bitcoin and altcoin trends.
At CCN, Victor covers the top cryptocurrencies, memecoins, macro shifts, blending real-time insights with deep-dive metrics.
He holds a Bachelor’s degree in Physics from the University of Ibadan, equipping him to simplify complex data for a wide audience. Follow his work or connect on LinkedIn or X.