DEXE has dropped 16% from its $16.24 yearly high as a dense liquidity cluster fails to pull price up | Credit: CCN
Share
Key Takeaways
DEXE has dropped roughly 16% from its $16.24 yearly high to trade at $12.52, with the dense liquidity cluster around the high failing to pull the price higher.
Bearish signals are stacking across markets: a CMF at -0.09, a daily MACD bearish crossover since April 17, a 37% collapse in futures open interest, and persistently negative funding at -0.0103%.
A break below the $11.61 support opens the door to a deeper drop toward $9.41 — bulls need to reclaim $14.73 to invalidate the setup and put the $16.24 magnet back in play.
DEXE, the governance token powering the decentralized DAO infrastructure protocol DeXe, has been hit by a wave of profit-taking since revisiting its yearly high of $16.24 on April 19, 2026.
The token is changing hands at $12.14 at press time, having shed roughly 16% of its value in just over a week.
Interestingly, a liquidity cluster has formed around this yearly high. These dense liquidity zones are often called price magnets. But this time, bearish forces have continued to dominate the DEXE market, pushing the token in the opposite direction.
Sellers Tighten Grip on DEXE
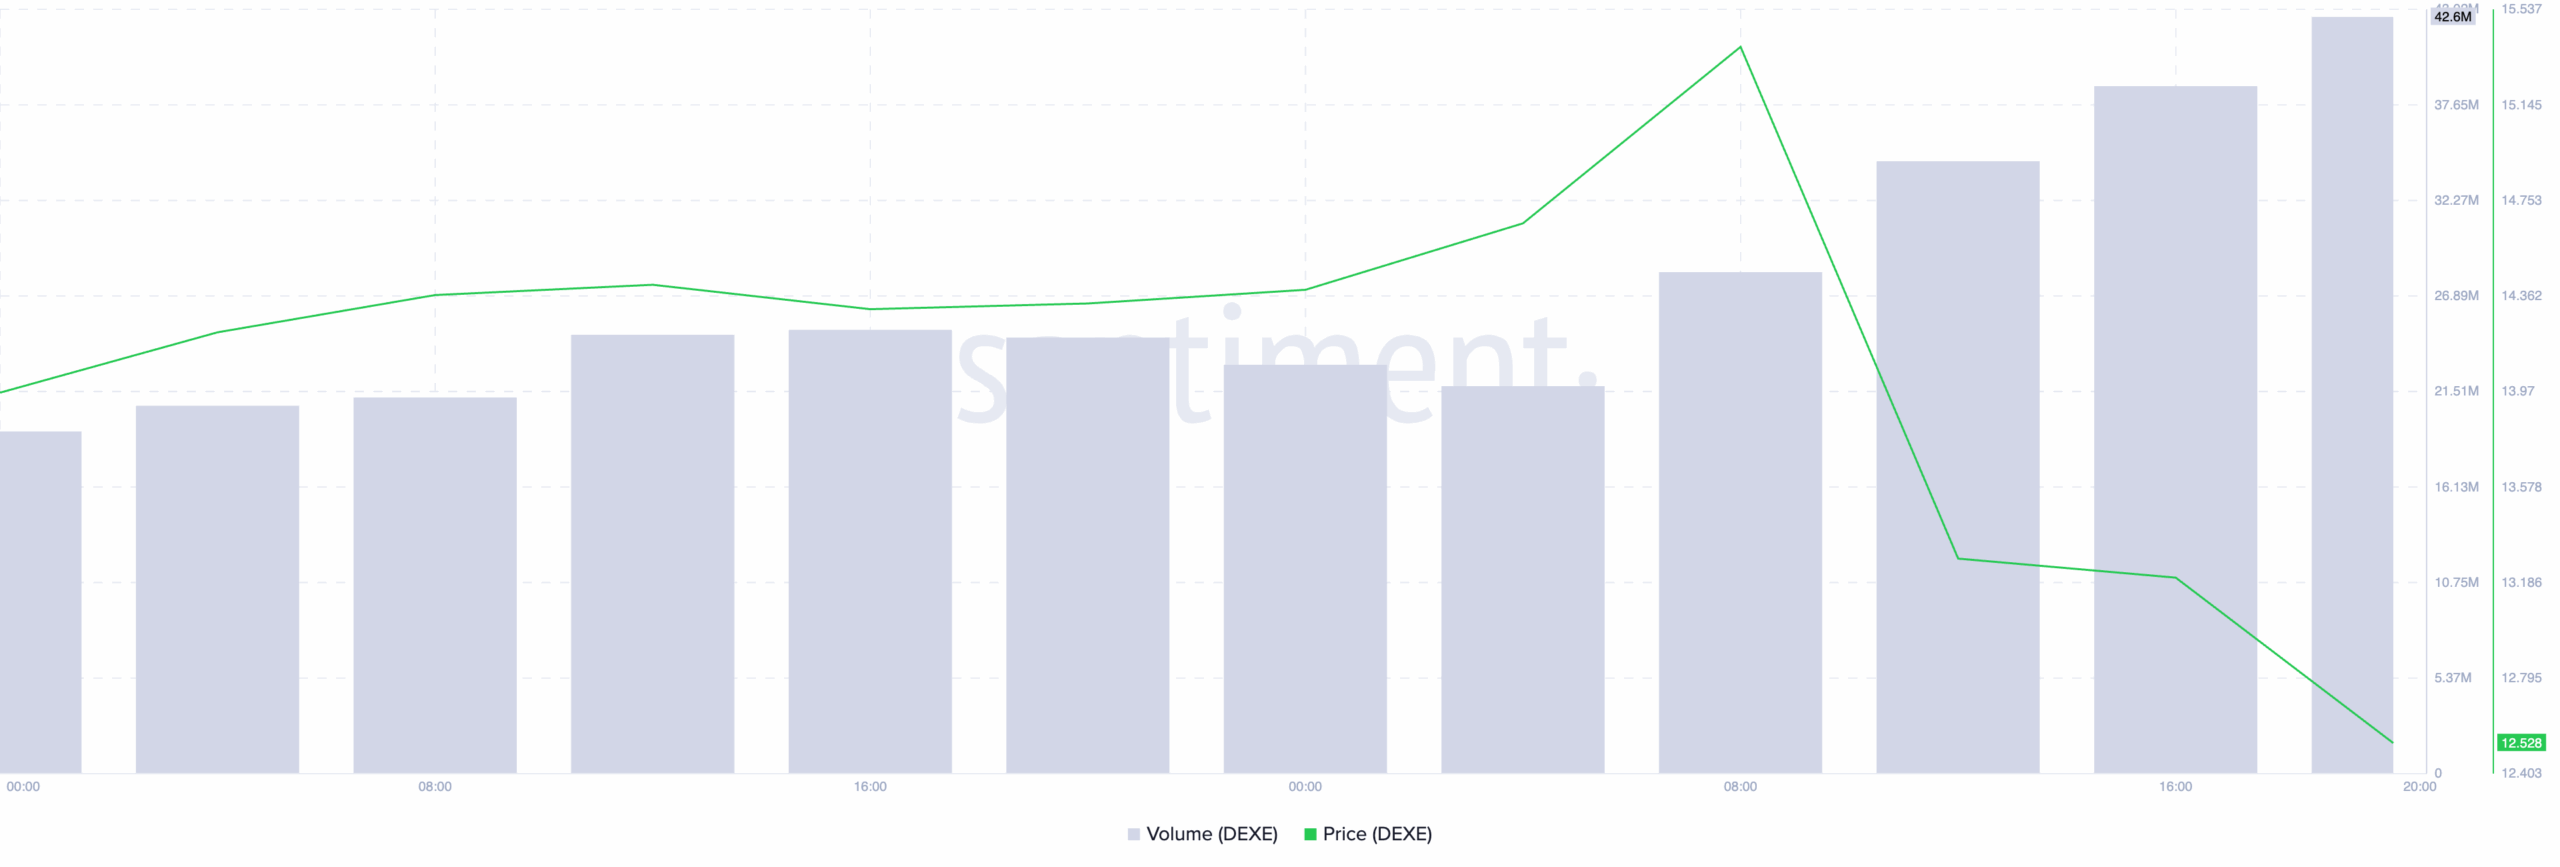
Over the past 24 hours alone, DEXE is down by 15%, while trading volume has climbed by over 100%. This creates a negative divergence that only exists when selling pressure is driving price action.
When an asset’s daily trading volume spikes during a downtrend, short sellers are distributing at the top to push the price lower.
This kind of price-volume behavior also signals that the late-stage buyers who chased DEXE into the $16.24 high are now underwater and dumping into any bid available.
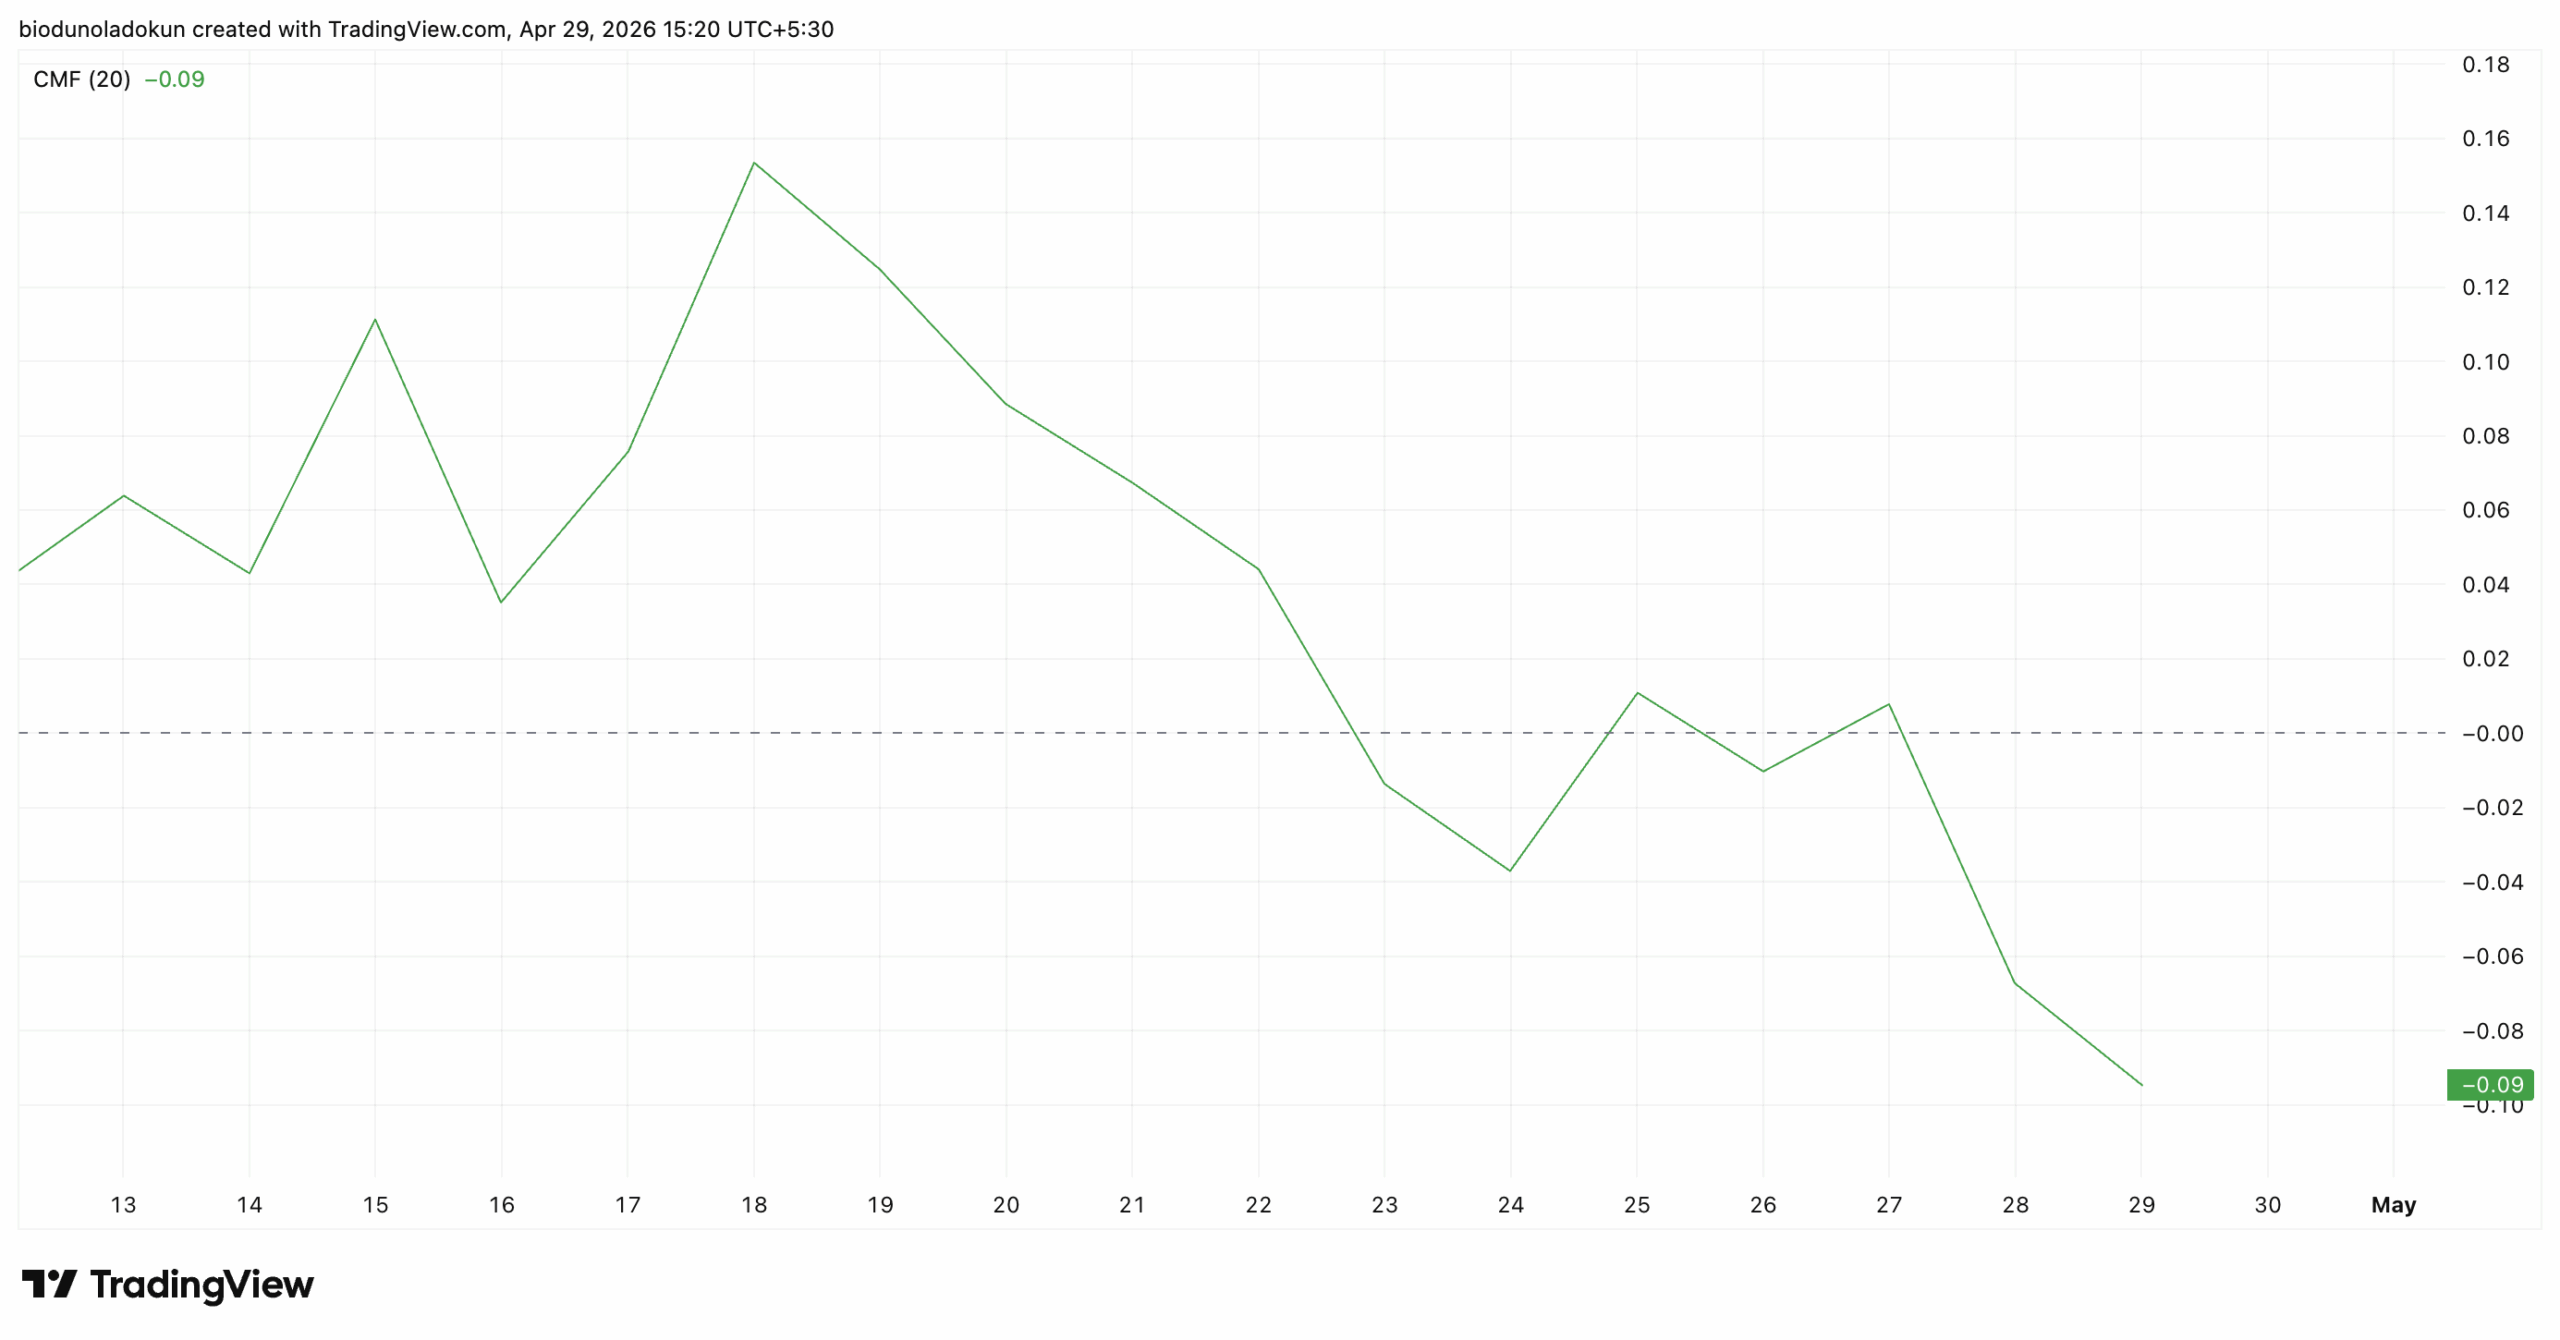
On the daily chart, DEXE’s falling Chaikin Money Flow (CMF) confirms the hike in sell-side pressure. This momentum indicator, which tracks money flows into and out of an asset, has fallen below the zero-neutral line, printing -0.09 as of this writing.
When CMF is negative and falls in tandem with an asset’s price, it confirms that capital is actively exiting the market.
Sustained moves below zero on CMF have historically preceded extended downtrends, especially when they follow a rally like the one DEXE had between March 13 and the yearly high on April 19.
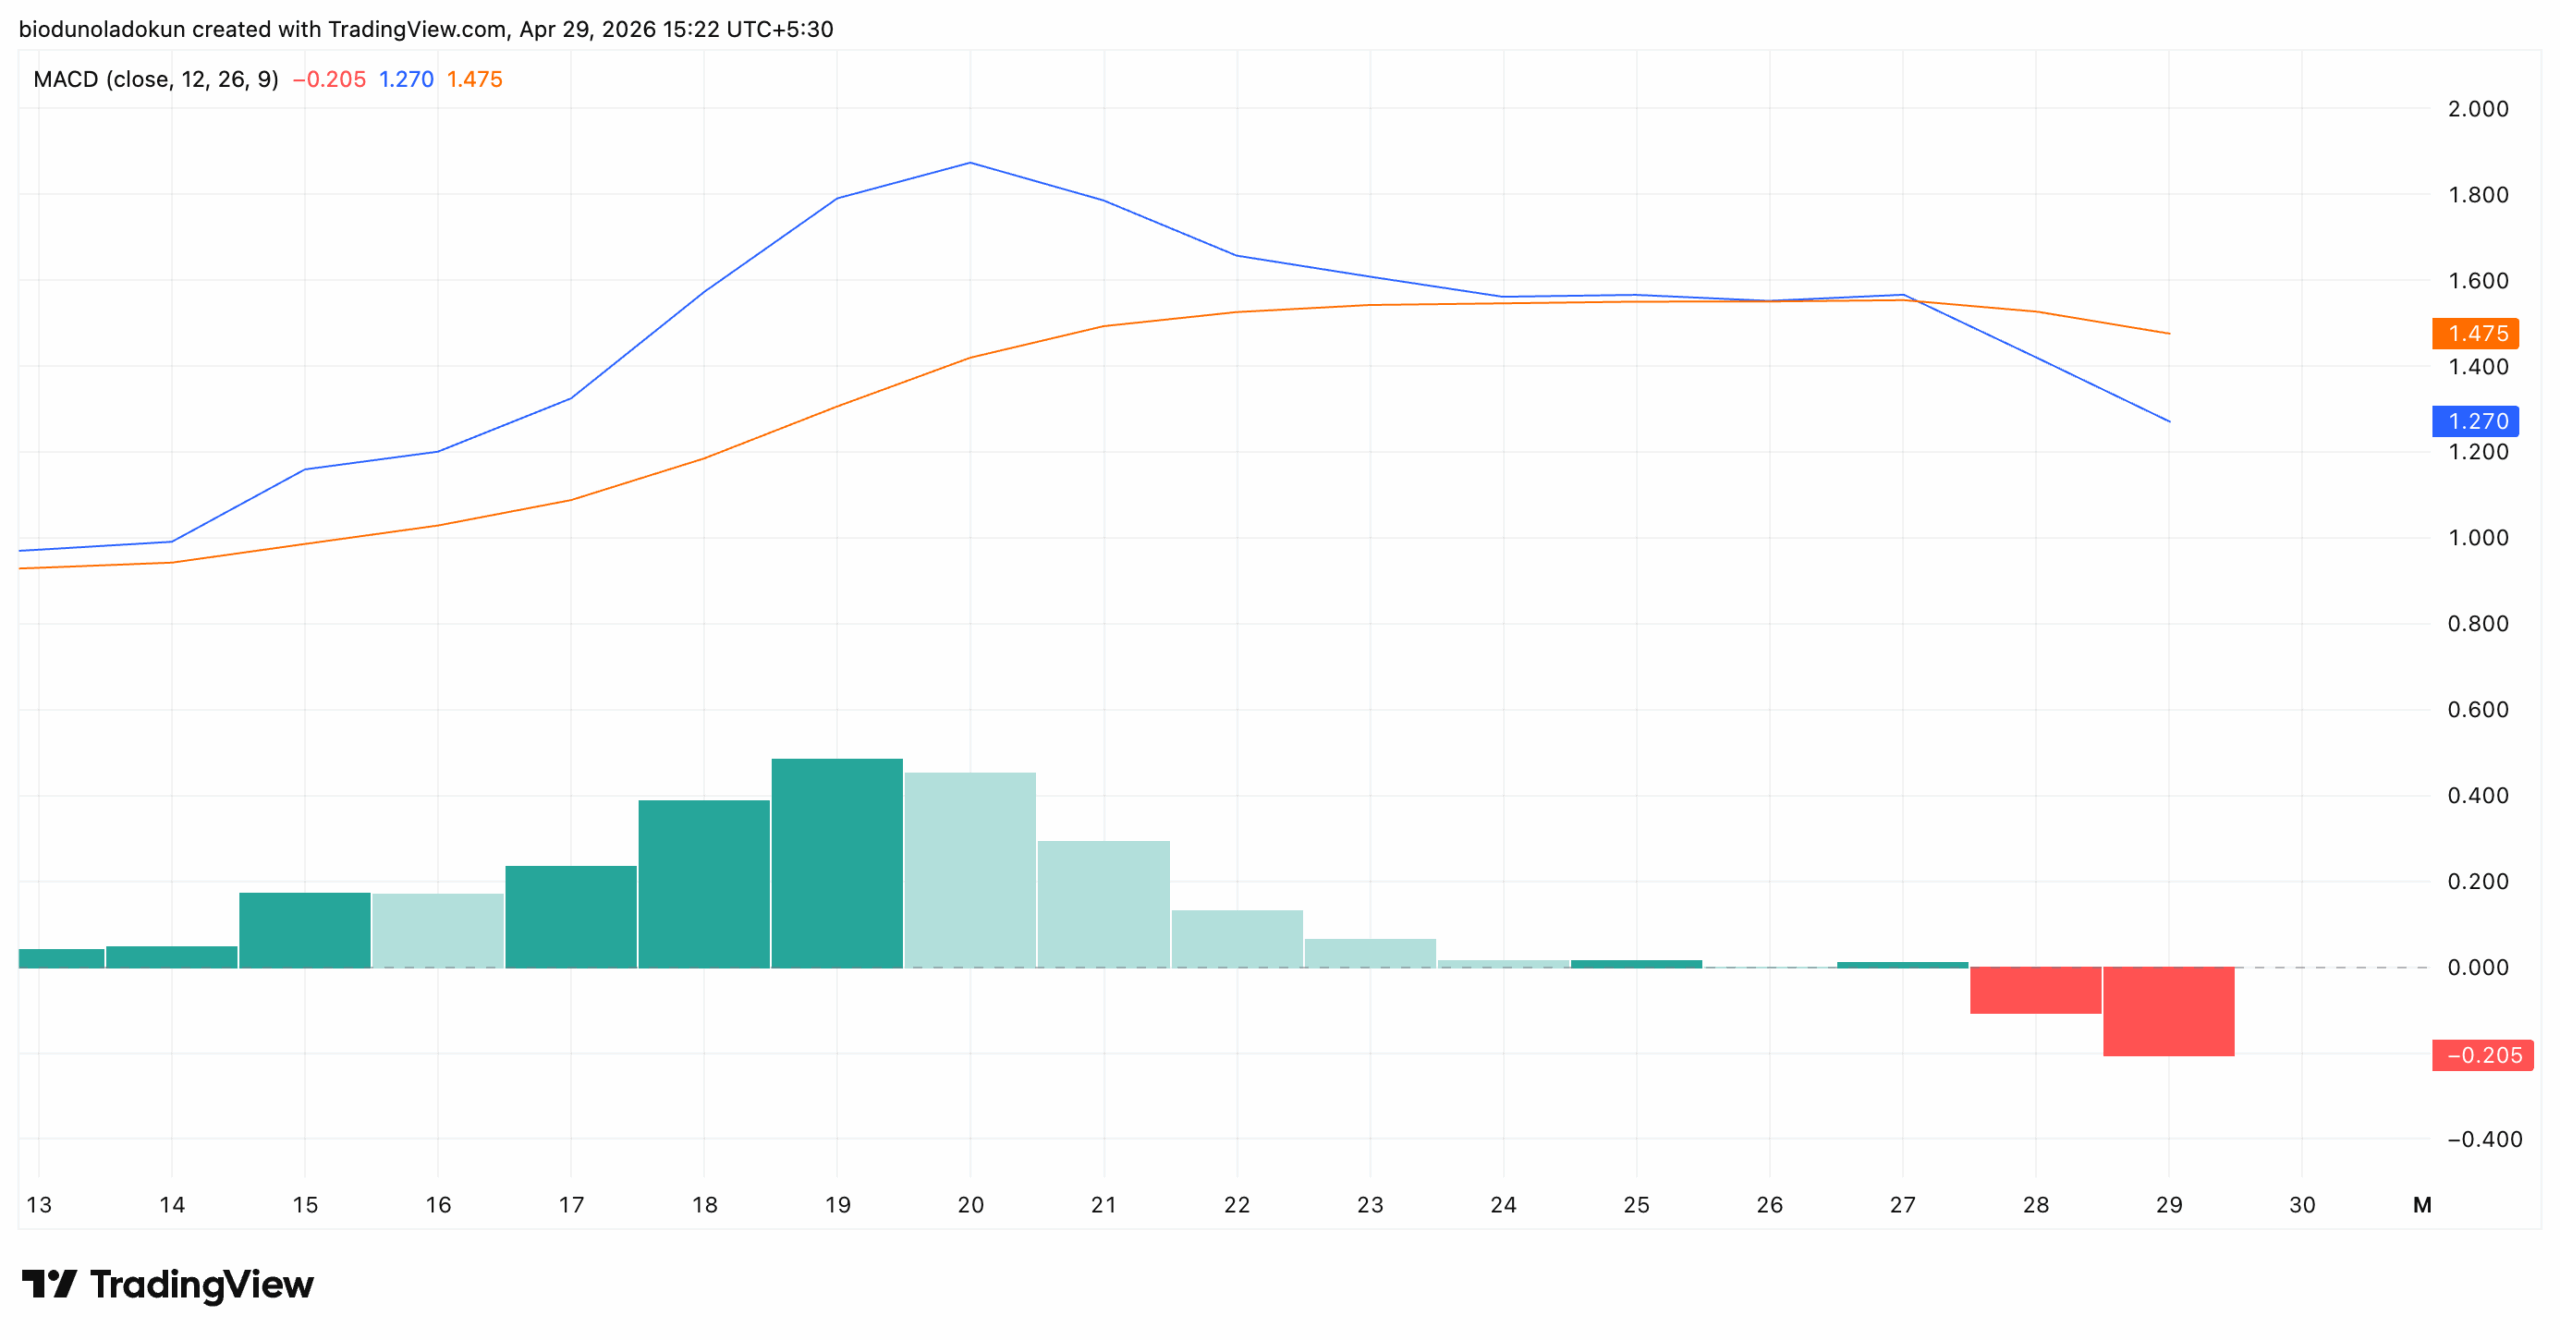
Furthermore, the token’s Moving Average Convergence Divergence (MACD) confirms the uptick in sell-side activity, with a bearish crossover observed since April 17.
This indicator helps traders gauge momentum by comparing short-term and long-term price movements. A bearish crossover forms when the MACD line crosses below the signal line, indicating that downward momentum has overtaken bullish strength.
For DEXE, this means the broader trend favors sellers, and a short-term attempt to boost prices may face significant resistance.
DEXE Futures Market Flashes Bearish
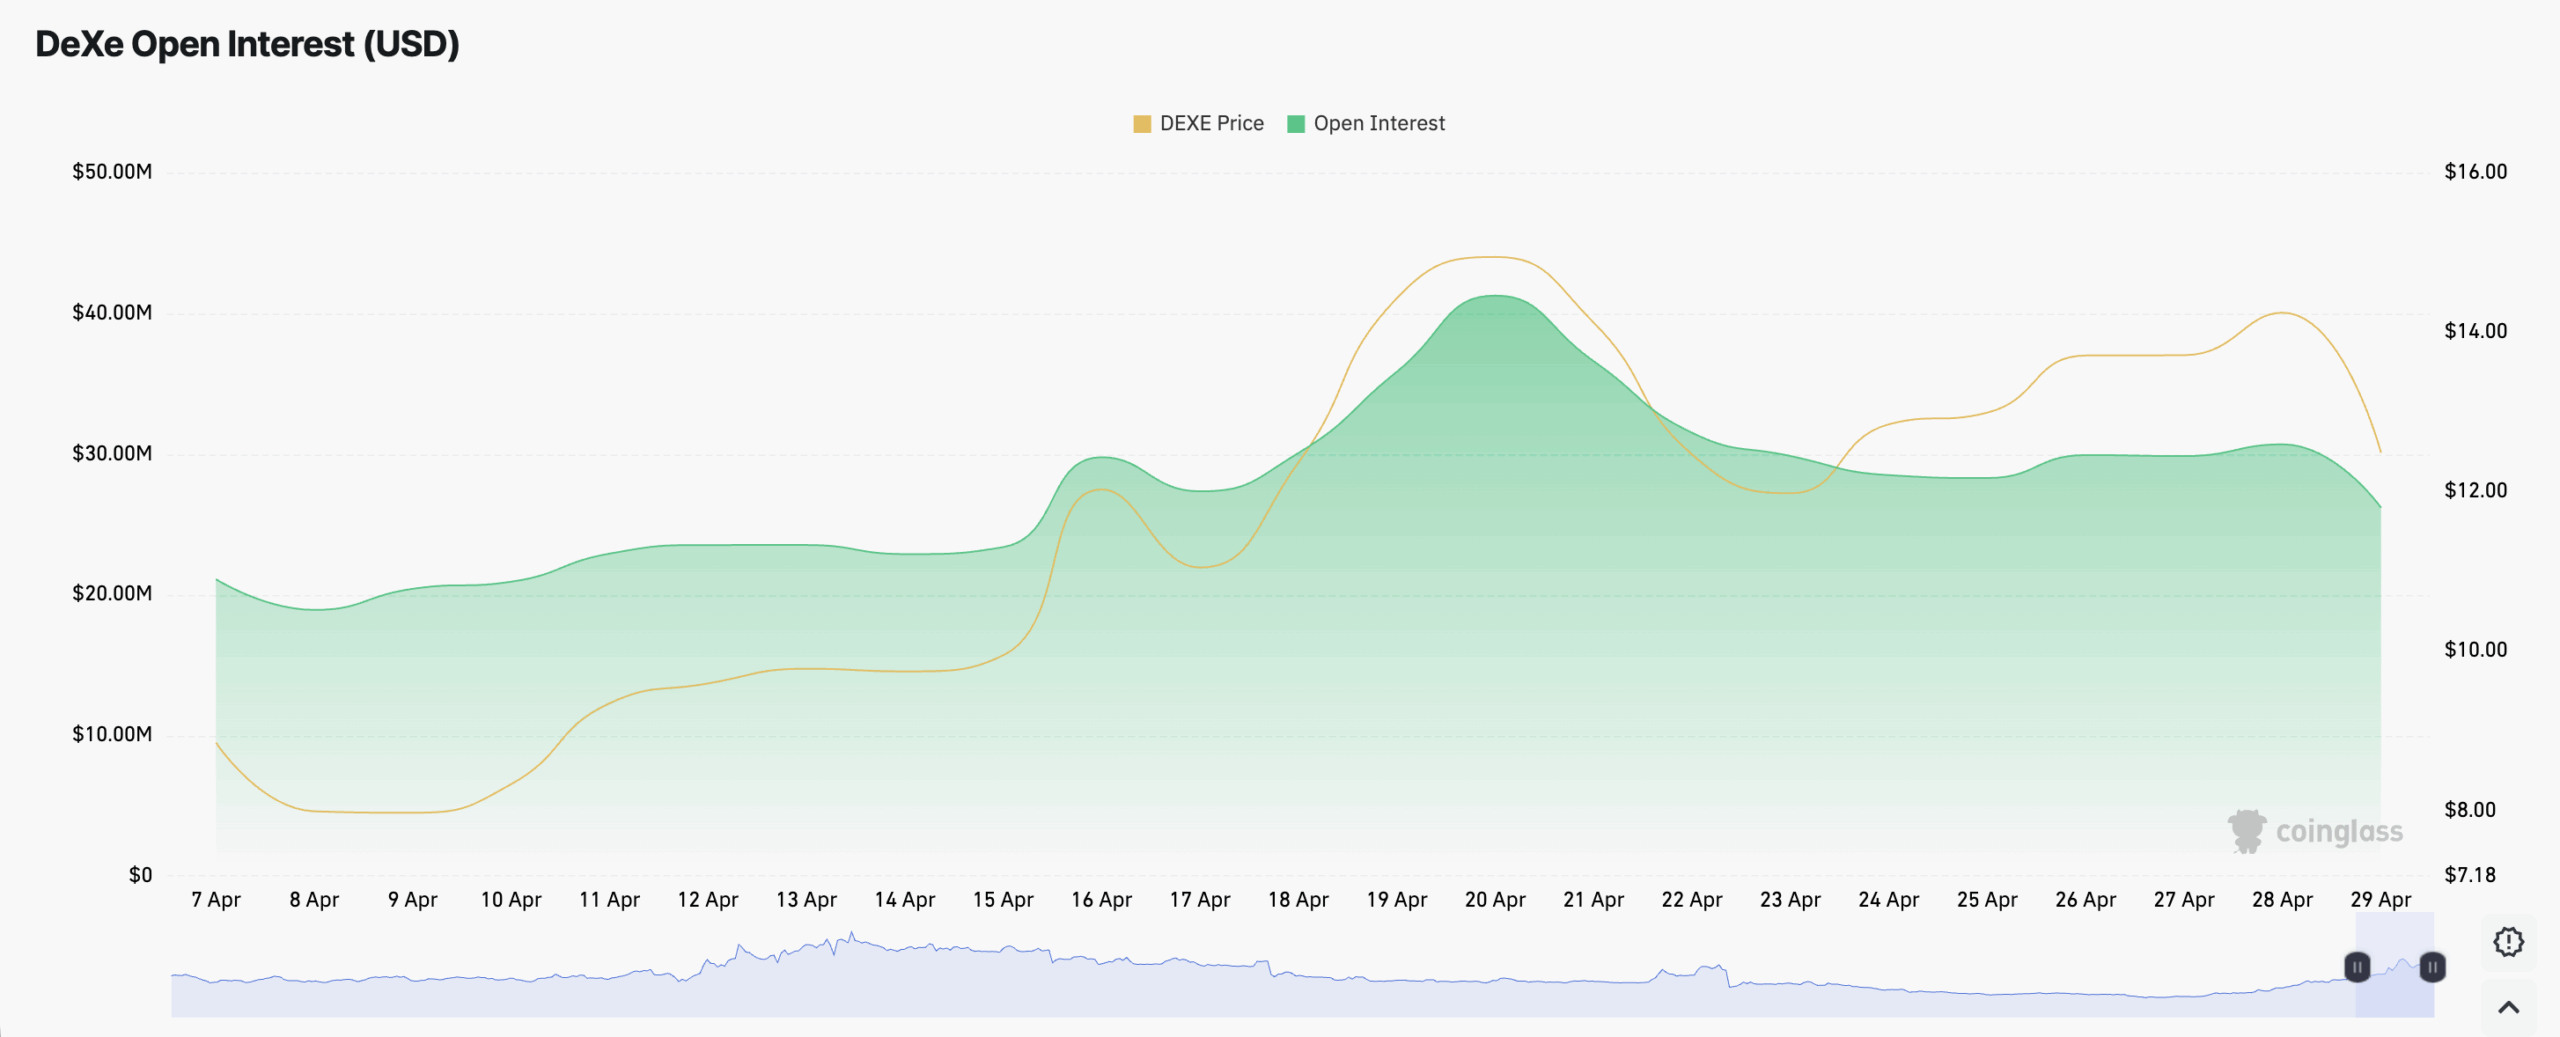
Trends in the DEXE derivatives market confirm the weakness in bullish sentiments around the altcoin. Per Coinglass data, its futures open interest has plummeted by 37% since April 20, sliding from a local peak above $40 million to $26 million at press time.
Open interest measures the total value of outstanding derivatives contracts that have not yet been settled. It is a real-time gauge of how much capital is actively positioned in an asset’s futures market. So when it falls this way, especially with spot price, it signals waning bullish conviction.
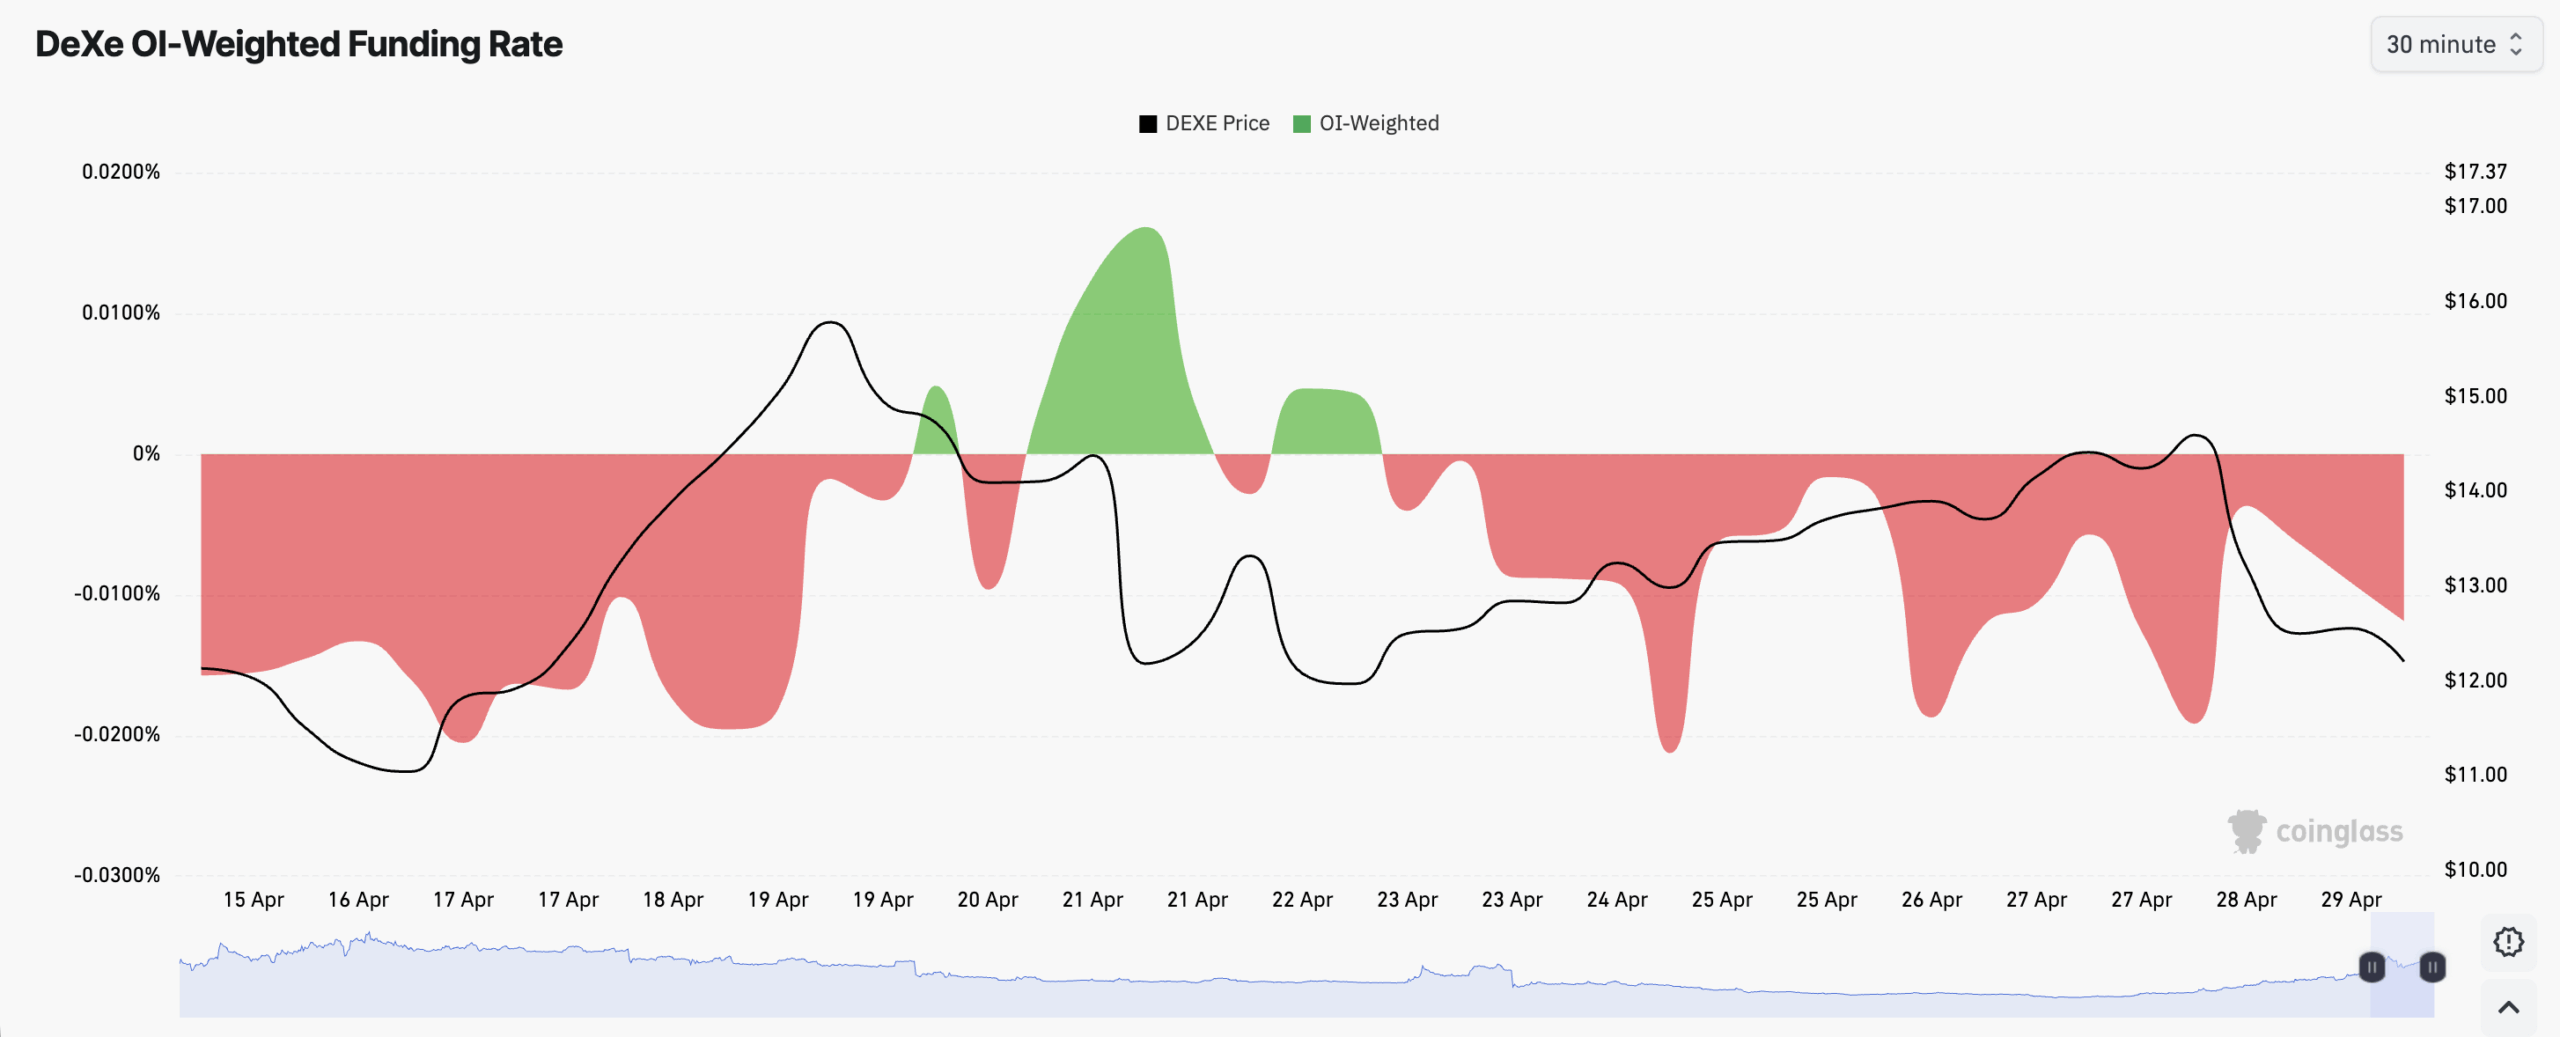
Furthermore, DEXE’s funding rate has been persistently negative since April 23. At press time, this stands at -0.0103%.
This means traders holding short positions are currently paying a fee to traders holding long positions to keep their bets open, a sign of a bearish-leaning market.
In a bullish market, funding rates are typically positive, with longs paying shorts. When funding flips negative and stays there for days like this, it signals strong demand for short exposure.
DEXE Eyes $9.41 If Bears Force Break of $11.61 Support
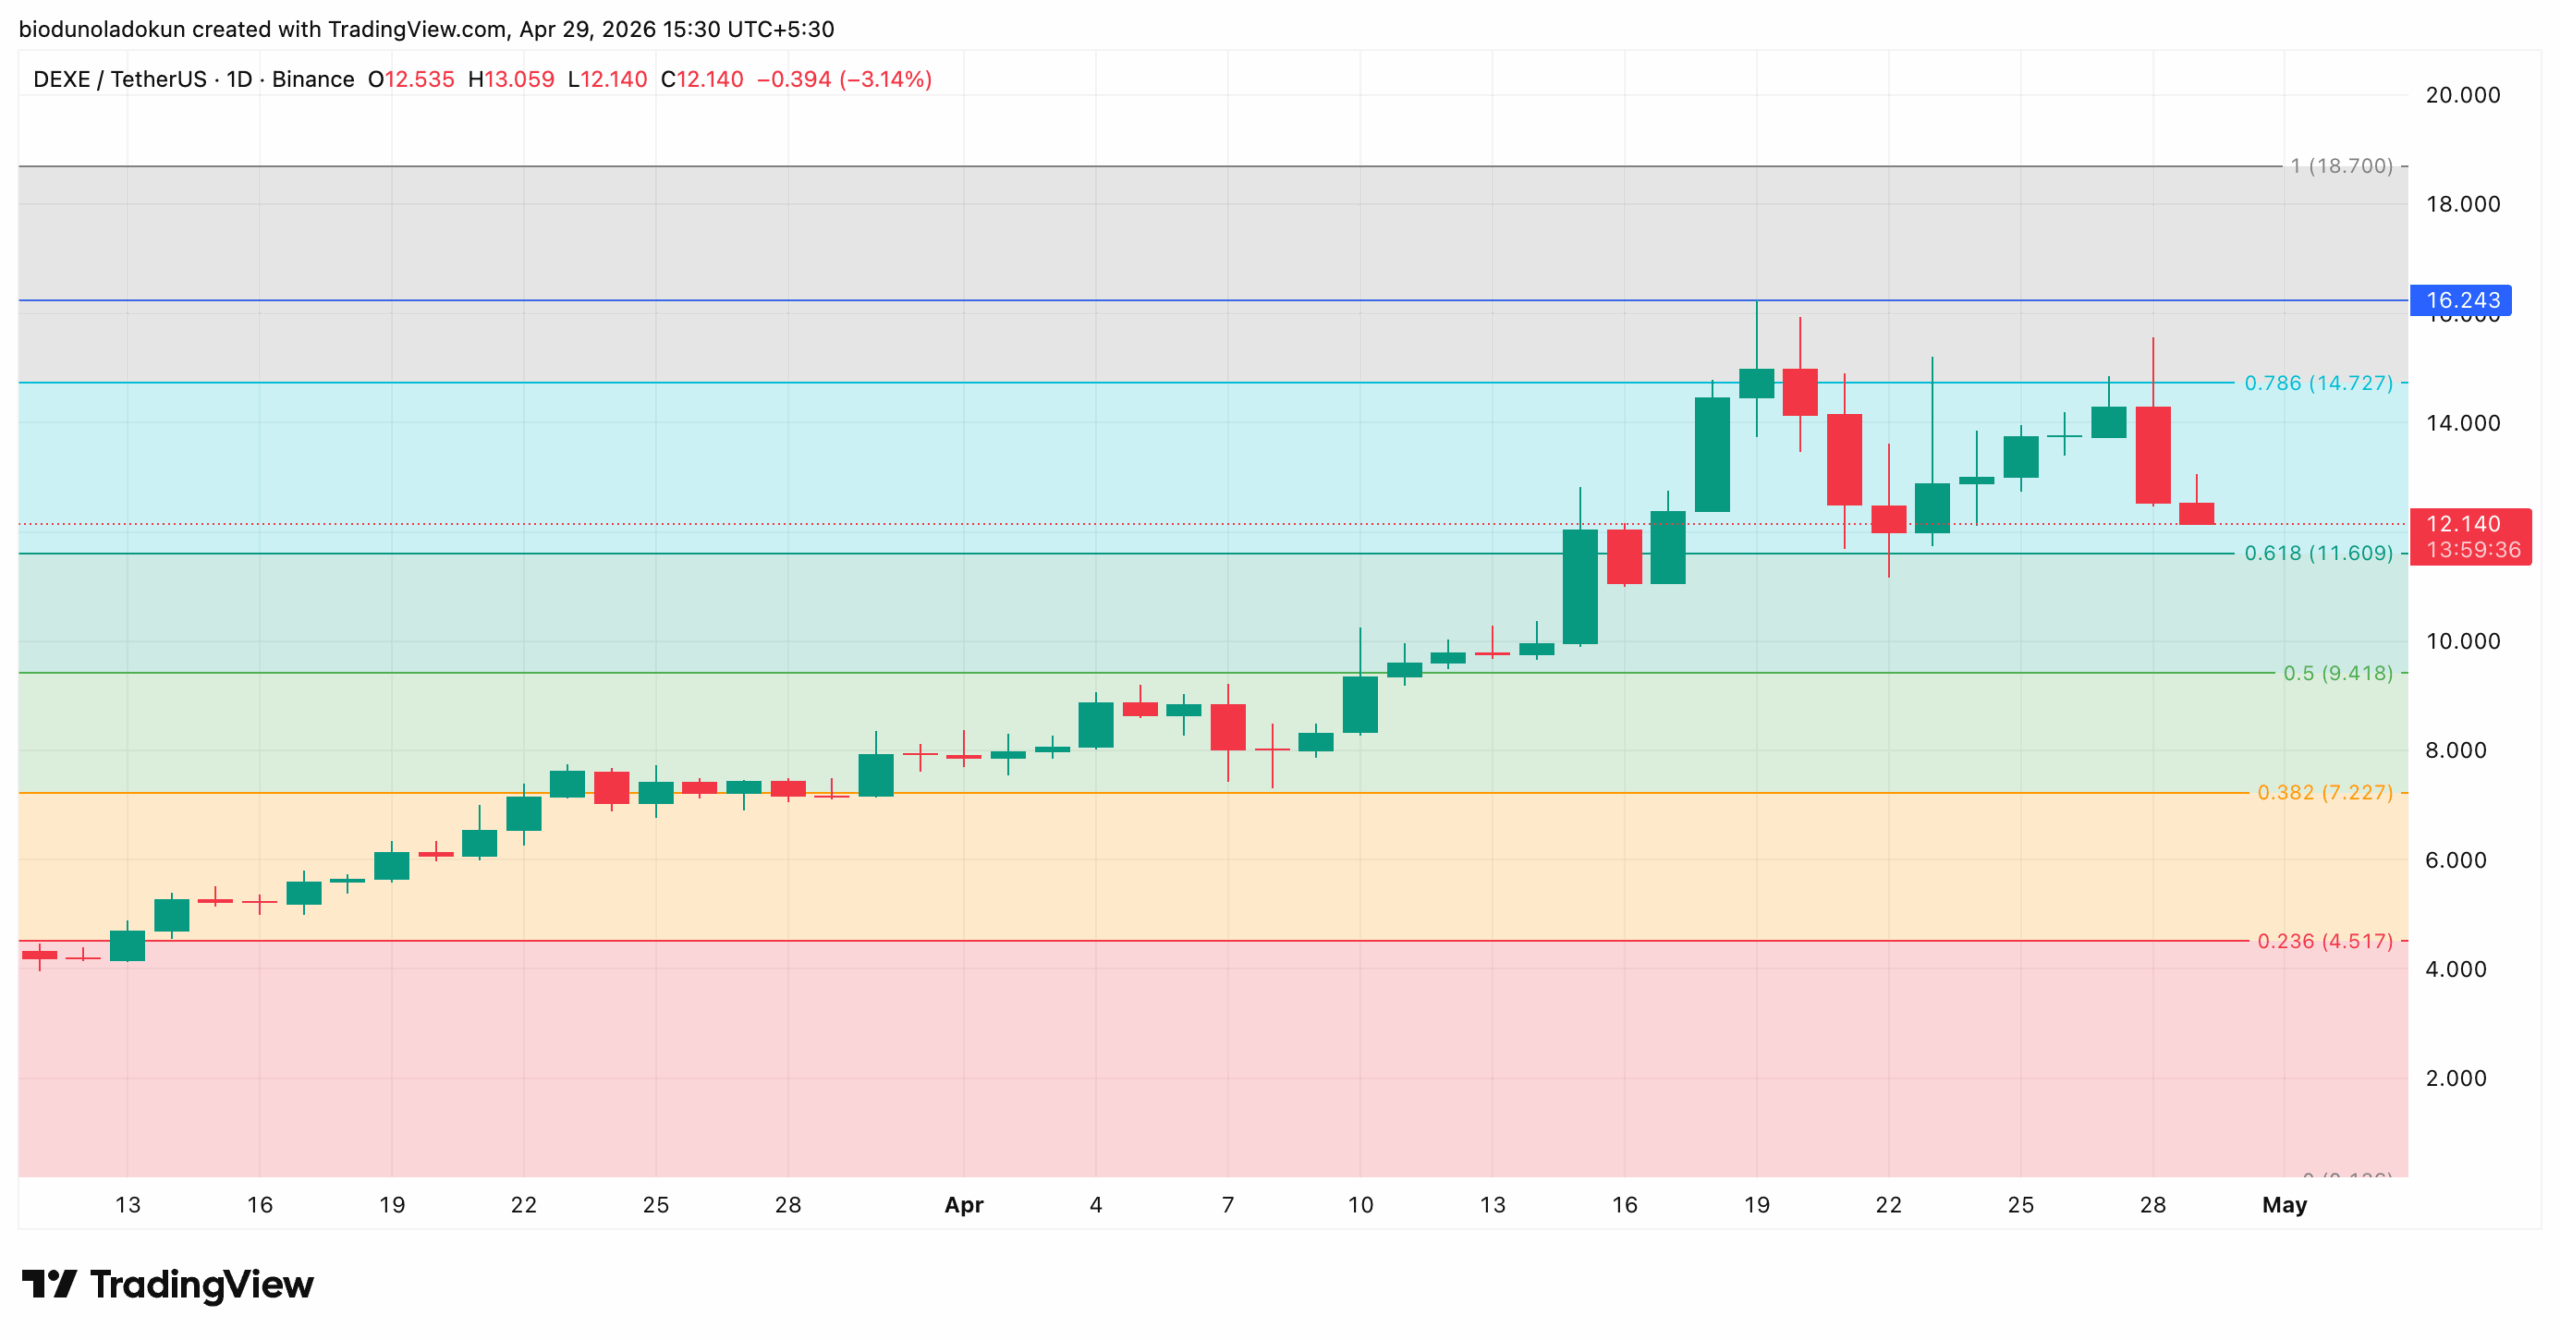
DEXE currently trades at $12.14, trading below the $14.72 overhead resistance that has capped every recovery attempt since the rejection from $16.24.
If profit-taking strengthens, DEXE risks testing support at $11.609. If demand remains low at this level, it gives way to a deeper decline toward $9.41.
DEXE/USD Daily Chart | Credit: TradingView
On the other hand, bulls need to reclaim and hold above the 0.786 Fib at $14.73 to invalidate the bearish structure and put the $16.24 liquidation magnet back in play. When that plays out, DEXE may extend its gains to $18.70
Disclaimer:
The information provided in this article is for informational purposes only. It is not intended to be, nor should it be construed as, financial advice. We do not make any warranties regarding the completeness, reliability, or accuracy of this information. All investments involve risk, and past performance does not guarantee future results. We recommend consulting a financial advisor before making any investment decisions.
Abiodun Oladokun is a Research Analyst at CCN, where he covers cryptocurrency markets with a focus on on-chain analysis, technical assessments, and emerging trends across decentralized finance (DeFi), real-world assets (RWA), artificial intelligence (AI), decentralized physical infrastructure networks (DePIN), Layer 2s, and meme coins.
Prior to CCN, he served as a Senior On-Chain Analyst at BeInCrypto, producing market reports spanning diverse crypto sectors.
Before that, he conducted technical analysis and market assessments of various altcoins at AMBCrypto, where he also contributed long-form quarterly research papers on DeFi, NFTs, DAOs, and scaling architectures, leveraging on-chain platforms including Messari, Santiment, DefiLlama, and Dune Analytics.
He began his crypto career as a research analyst at SixthSense DAO, developing blockchain forensic tools to trace the history of stolen assets.
Abiodun is a lawyer called to the Nigerian Bar and the founder of Ilé Ijó, a Lagos-based electronic dance music collective.