Is Ethereum's price poised for a deeper drop? | Source: CCN
Share
Key Takeaways
Ethereum has traded sideways since April 17, with the MACD’s bearish crossover, expanding red histogram bars, and an RSI drifting toward the 50.0 neutral line all pointing to weakening spot demand.
CryptoQuant analyst Arab Chain reports that ETH’s Perp–Spot Volume Imbalance on Binance has hit 0.87, with perpetual futures volume dwarfing spot volume — a signal that derivatives traders are aggressively chasing leveraged upside.
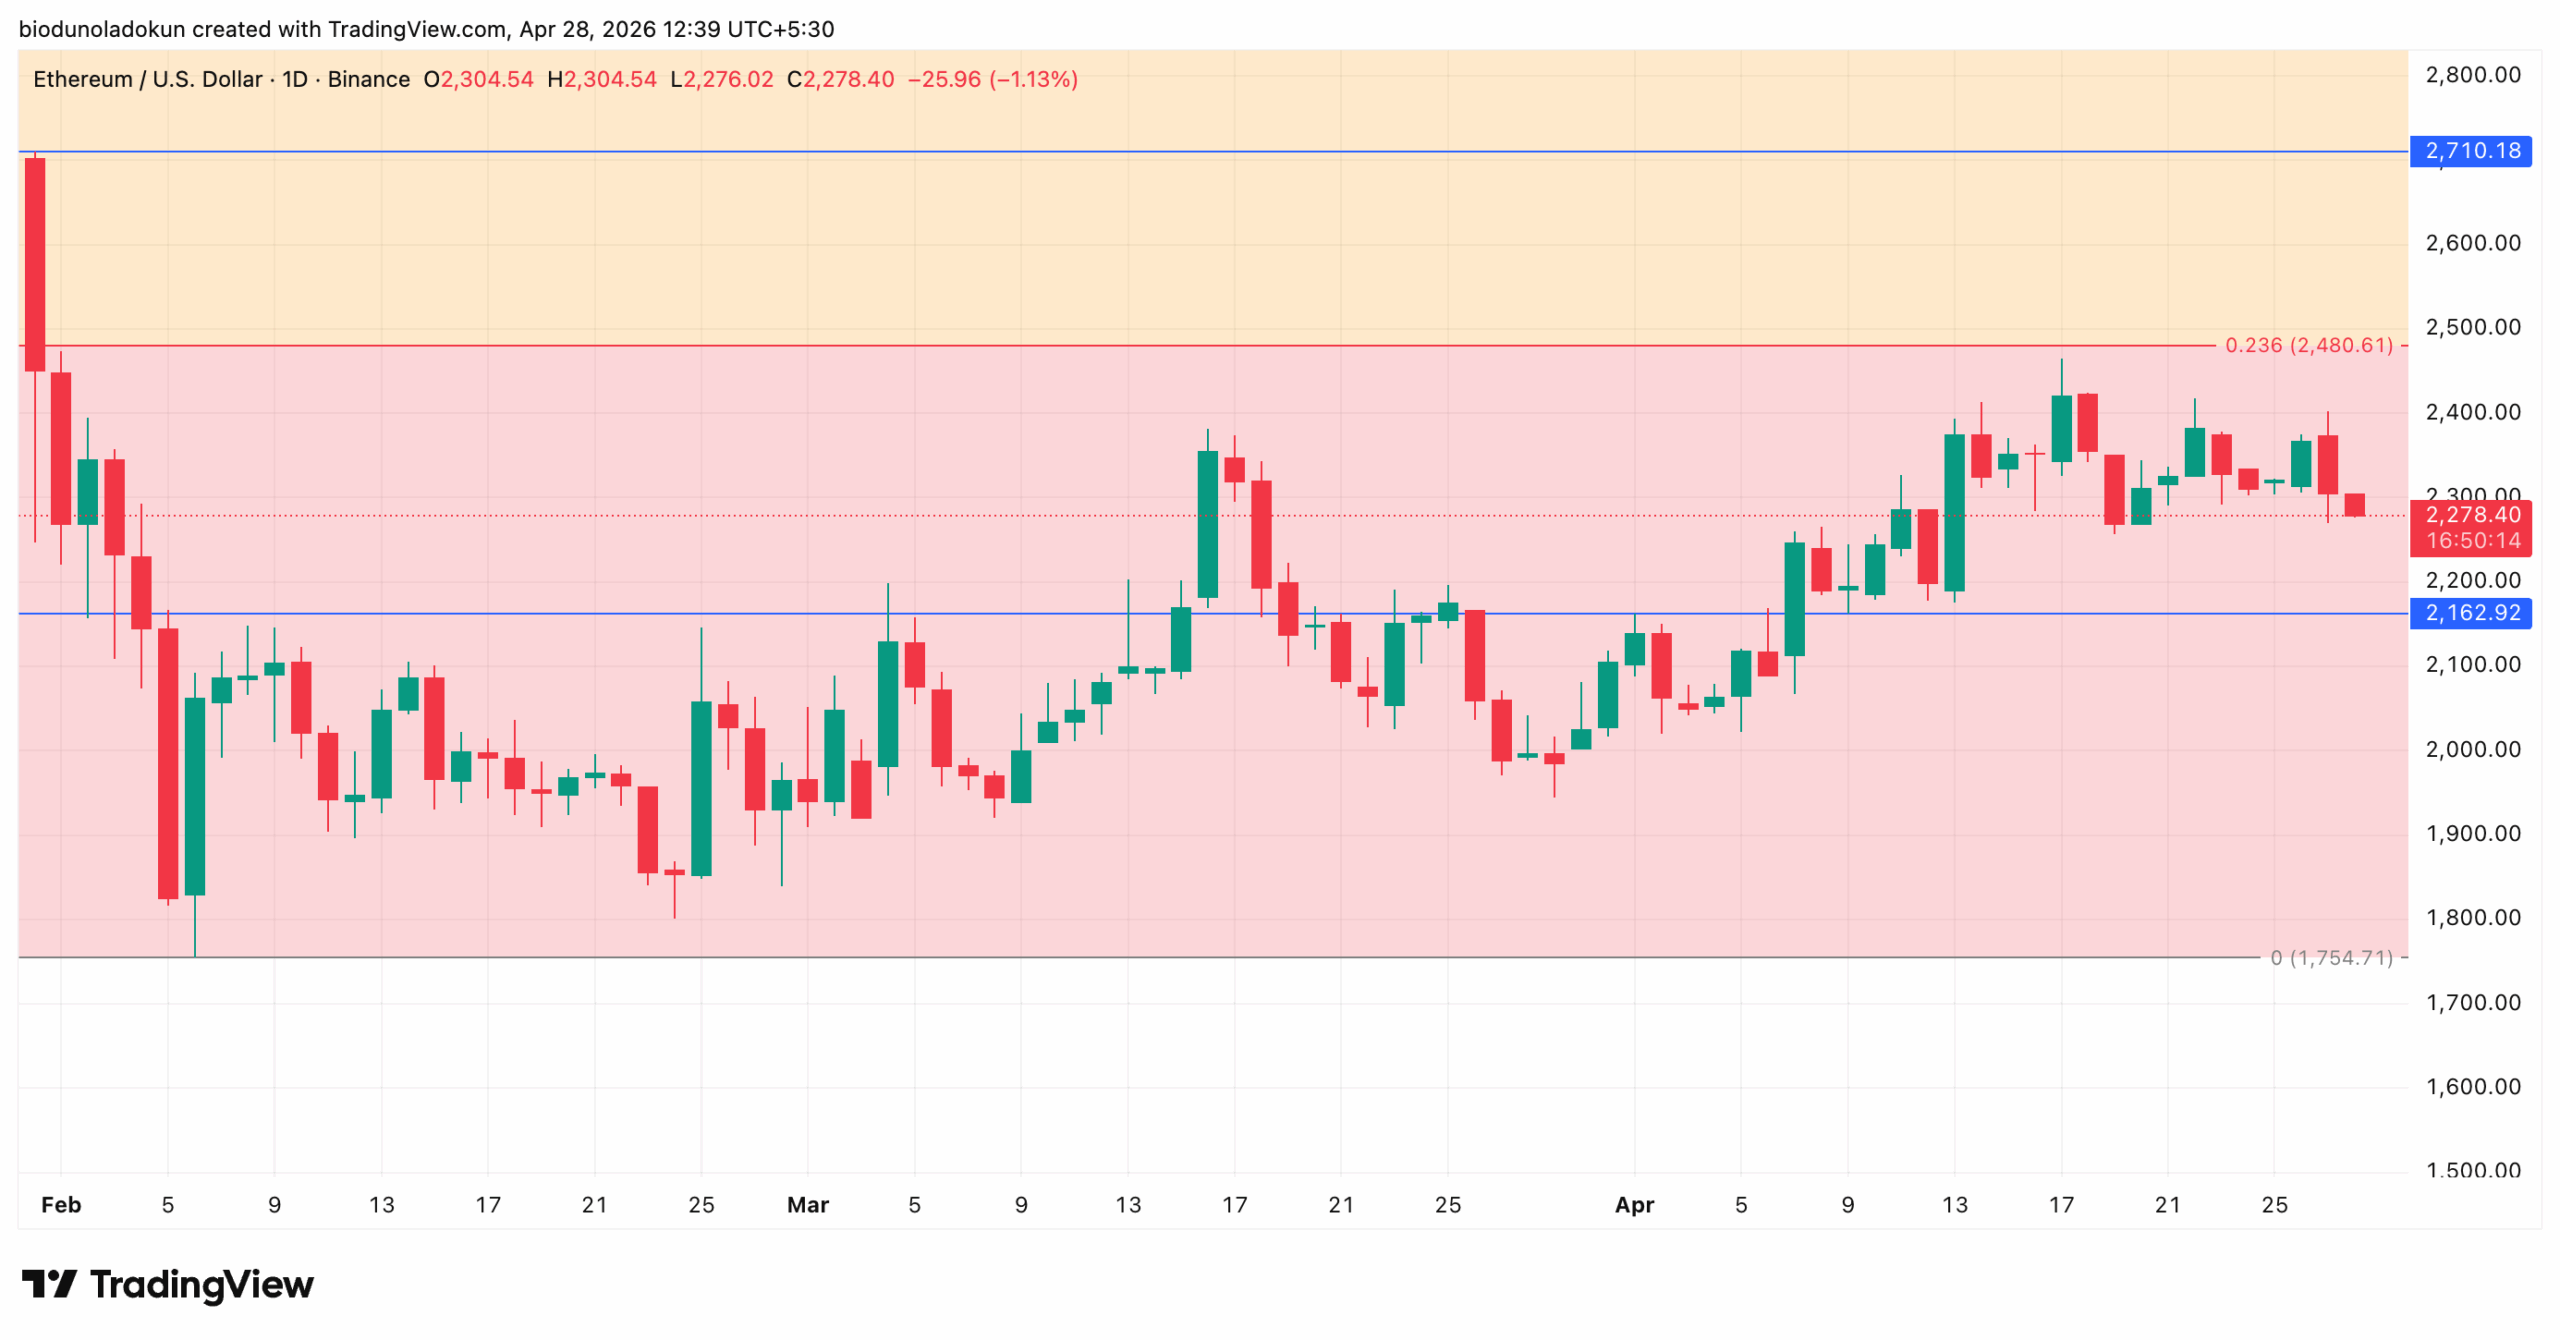
ETH currently trades near $2,291, with the $2,162 support level as the next critical battleground; a breakdown could expose $2,000 and the $1,754 swing low, while a reclaim of $2,480 would open the door to $2,710.
Since Ethereum’s failed attempt to reclaim the long-standing resistance at $2,480 on April 17, the leading altcoin has trended sideways, oscillating in a tight range.
Technical indicators now point to weakening spot market participation, with momentum readings flashing early signs of a dip toward the $2,162 support zone.
Yet, beneath the tepid spot market performance, derivatives traders are piling into leveraged positions at a pace that suggests rising risk appetite.
What does this mean for the altcoin in the meantime?
Spot Market Loses Steam as Bearish Bias Takes Hold
Since its last attempt to break the $2,480 overhead resistance on April 17, ETH has settled into a sideways trend that increasingly favors the bears.
A look at the daily chart shows a decline in momentum across multiple indicators, suggesting a plunge in buy-side pressure among spot traders.
Sponsored
Disclosure
We sometimes use affiliate links in our content, when clicking on those we might receive a commission at no extra cost to you. By using this website you agree to our terms and conditions and privacy policy.
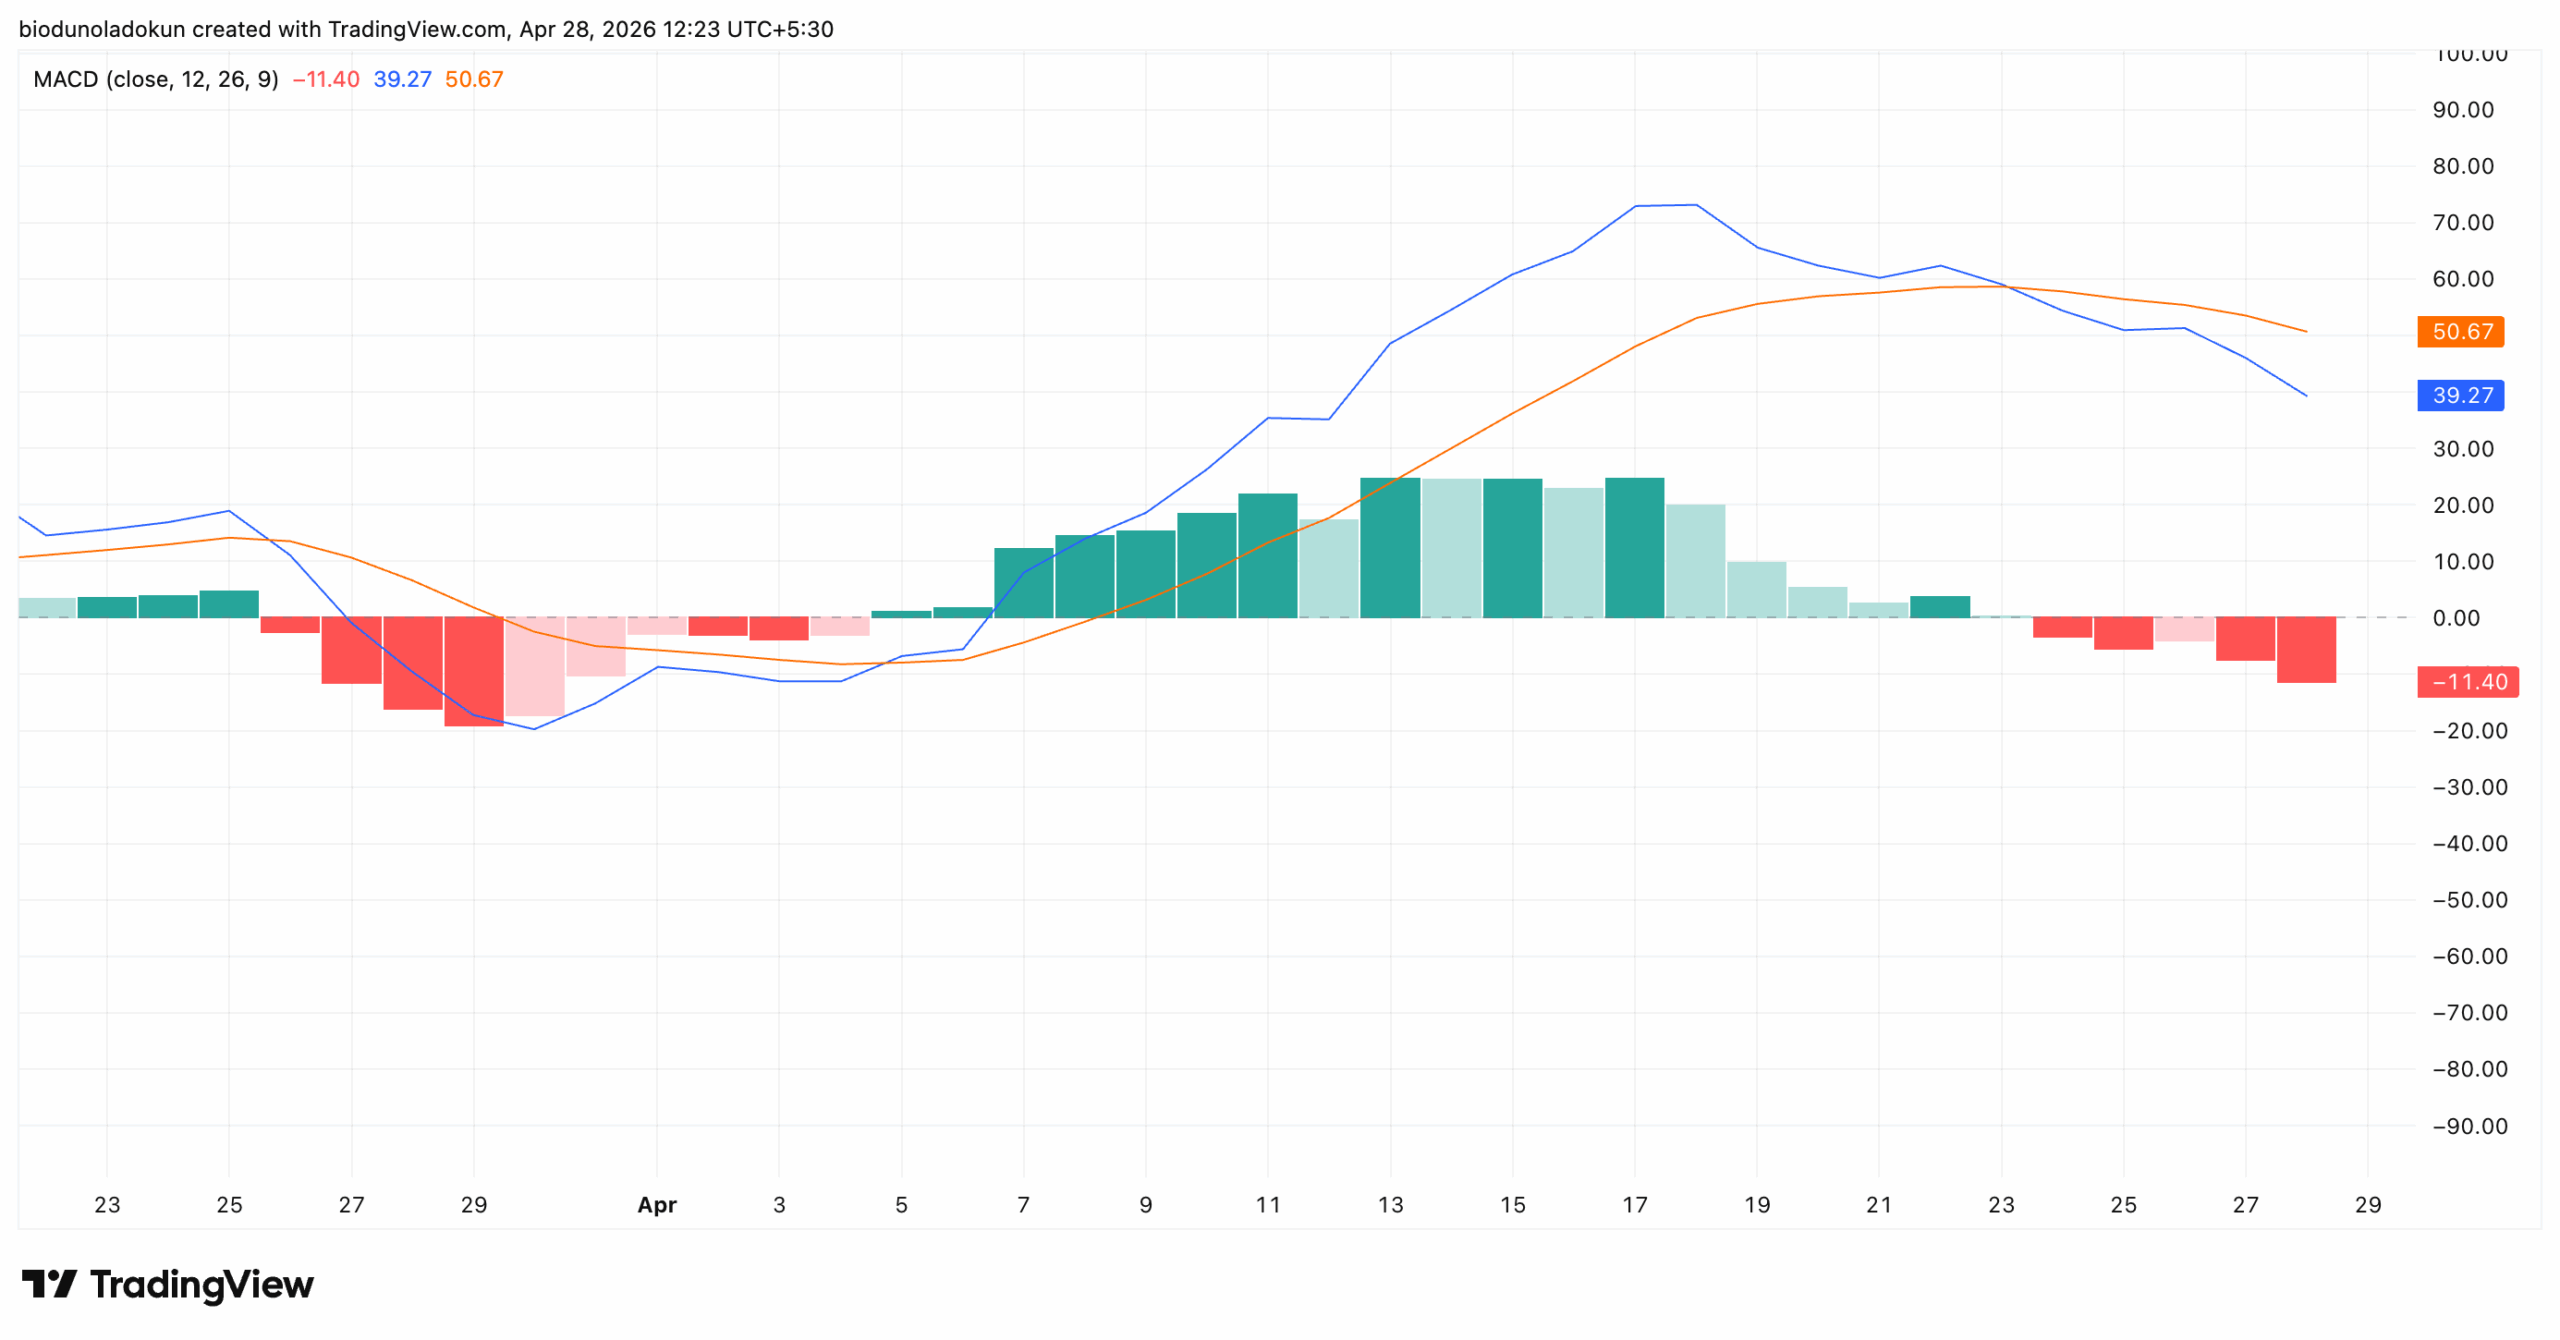
For example, ETH’s Moving Average Convergence Divergence (MACD) indicator has registered a bearish crossover since April 23, signaling that short-term momentum has flipped negative.
The MACD indicator helps traders gauge momentum by comparing short-term and long-term price movements.
A bearish crossover forms when the MACD line crosses below the signal line, indicating that downward momentum has overtaken bullish strength.
It often foreshadows further price declines.
Also, ETH’s MACD has been marked by red histogram bars whose sizes have grown progressively larger over the past five trading sessions.
This confirms the strengthening bearish momentum building beneath the surface of ETH’s range-bound price action.
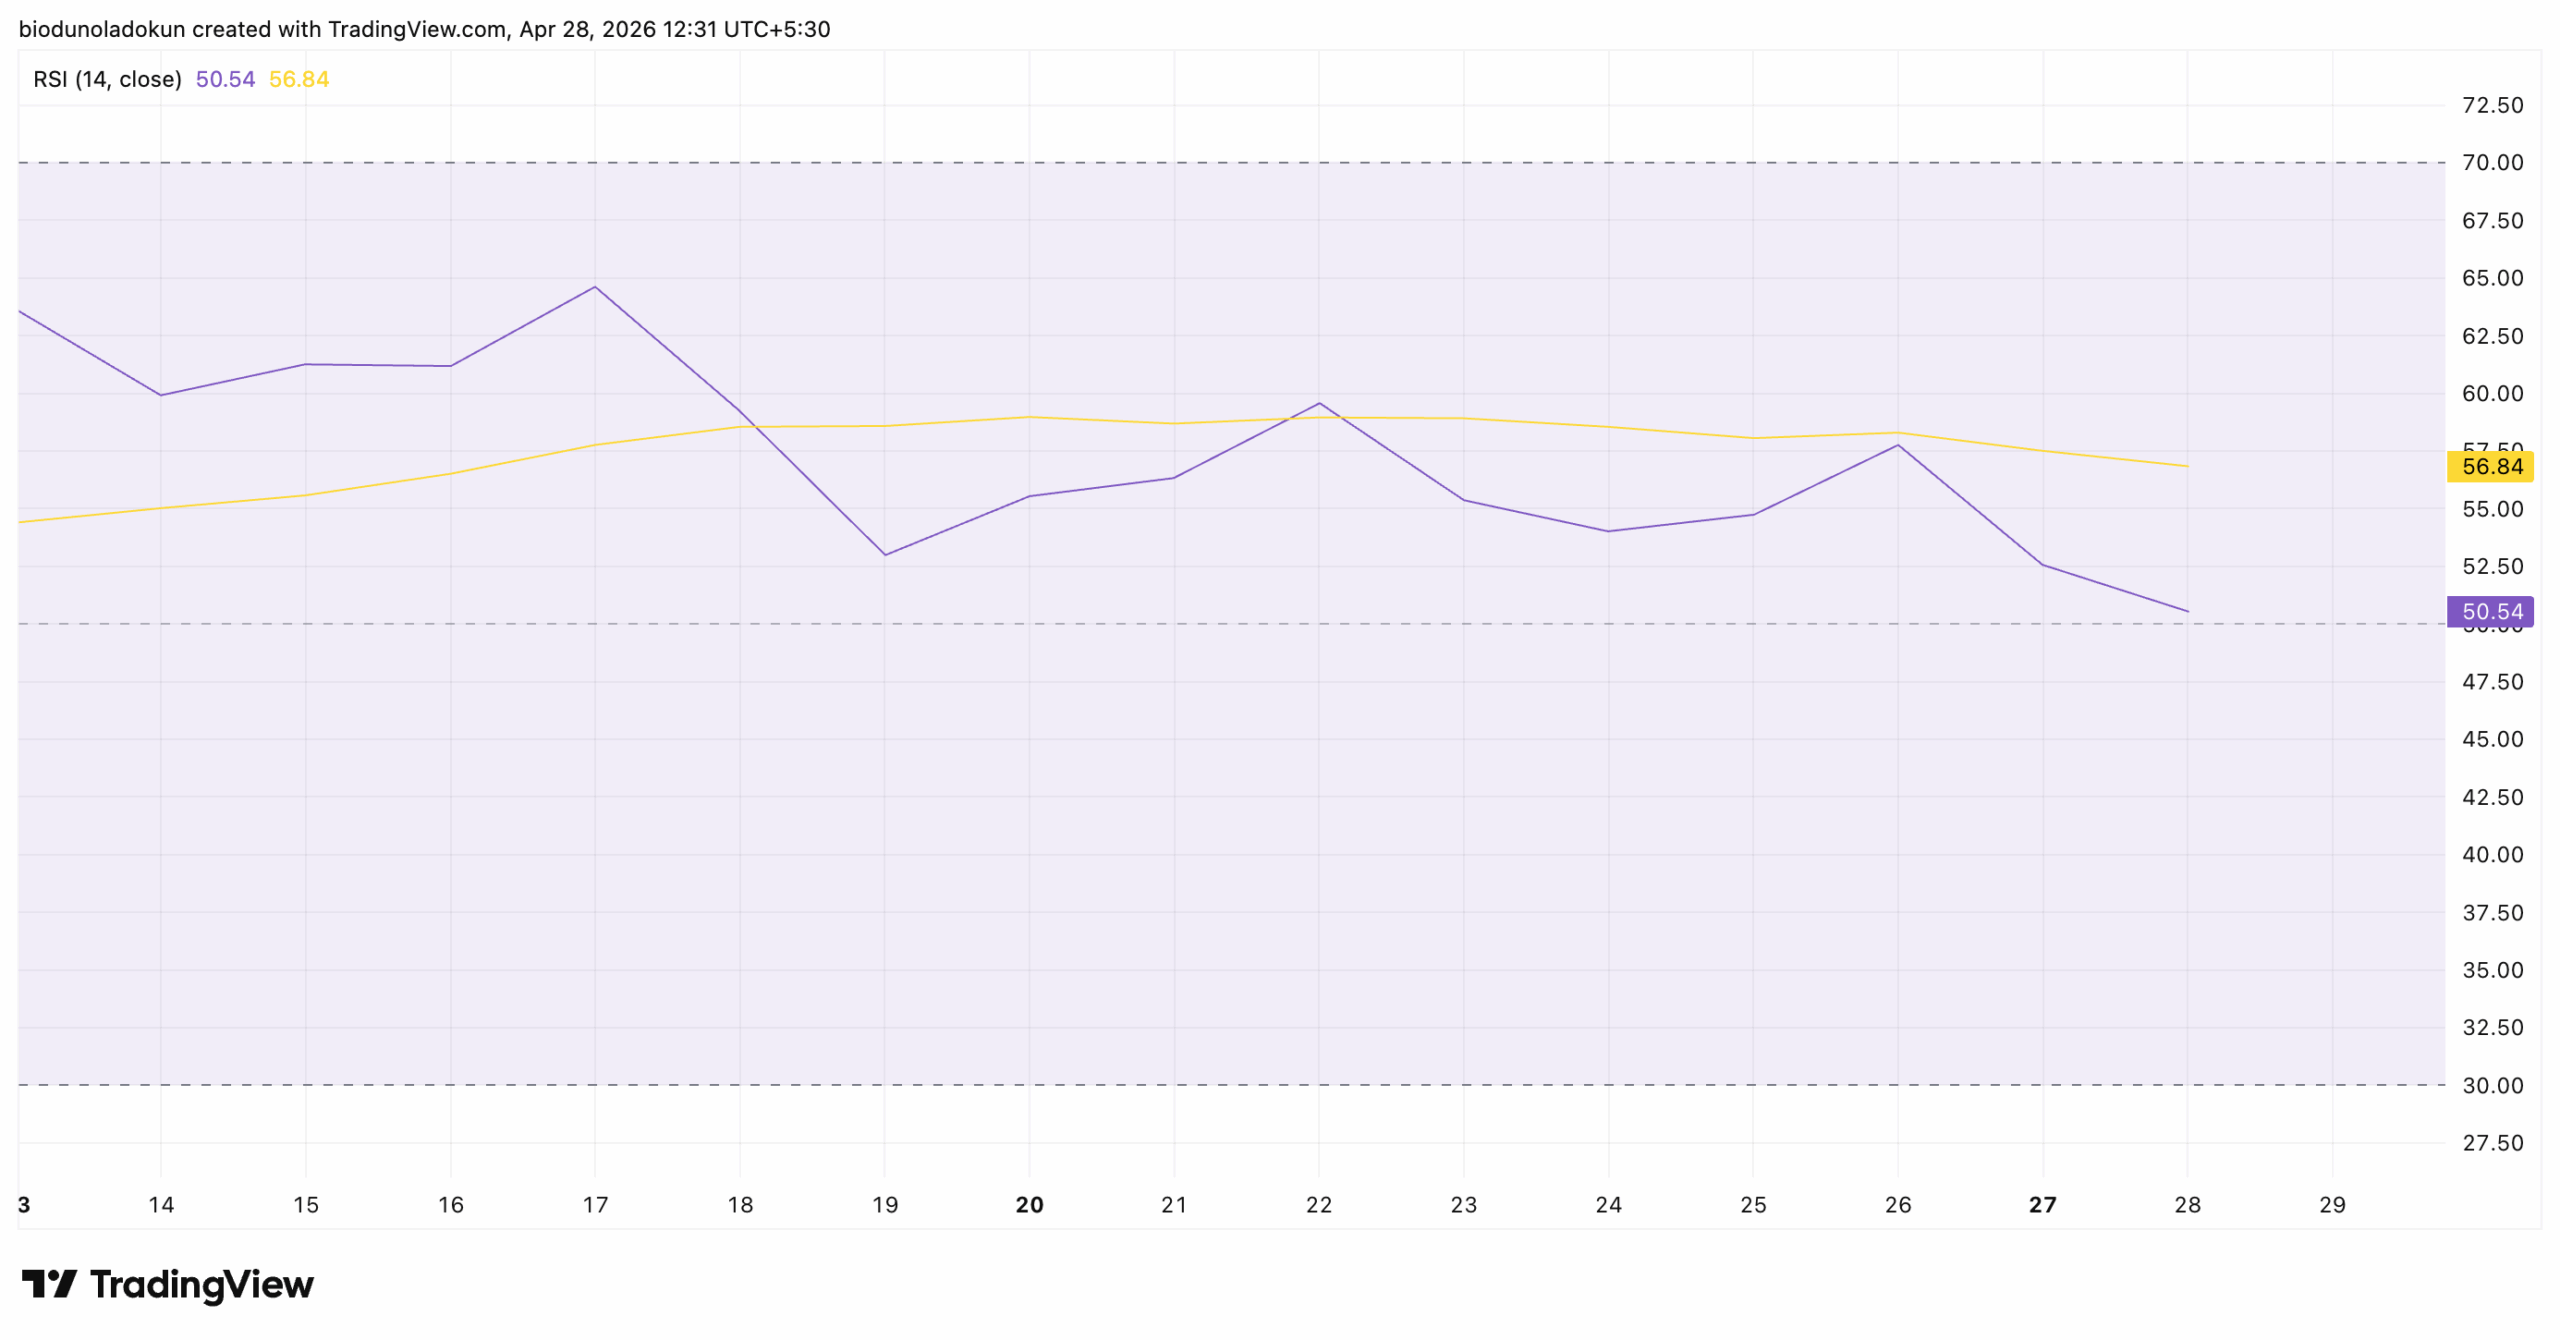
Furthermore, the altcoin’s falling Relative Strength Index (RSI) is now drifting toward the 50.0 neutral line, suggesting that buying pressure is fading and affirming the bearish outlook above.
As of this writing, this momentum indicator is at 50.54, down sharply from the local peak of 64.66 printed on April 17, the same session in which ETH was rejected at the $2,480 resistance.
When an asset’s RSI indicator falls toward the 50.0 neutral line, sellers are wrestling for market control from buyers.
A break below the 50 neutral line would confirm a bullish breakdown in ETH’s market structure, potentially triggering further price dips.
Derivatives Traders Tell a Different Story
While ETH’s spot participation is thinning, its derivatives traders are increasing their leveraged positions, signaling an expanding risk appetite.
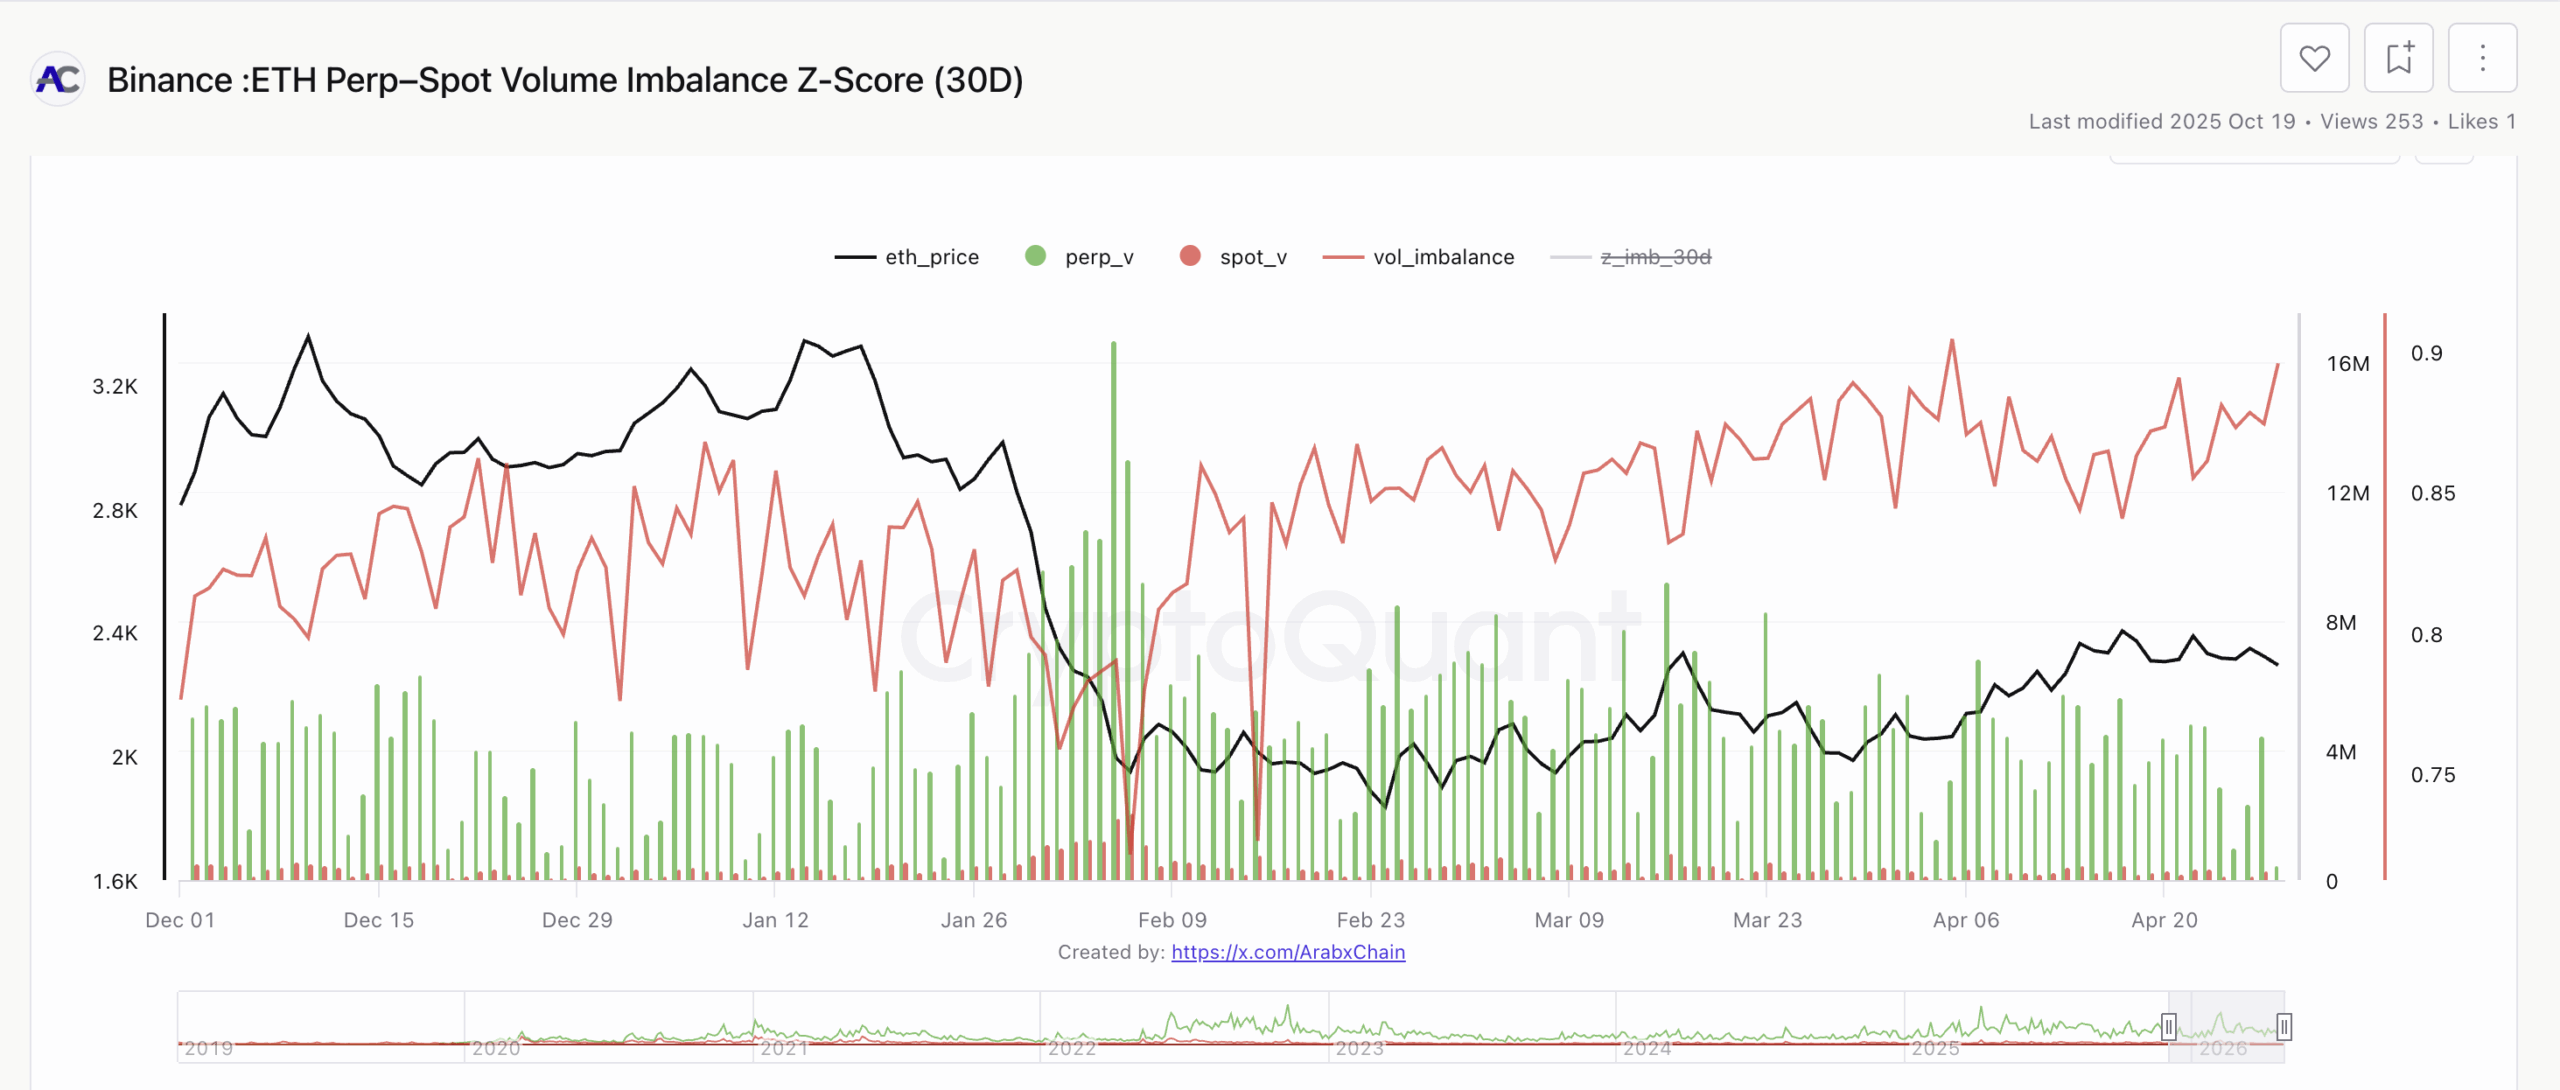
In a new report, a pseudonymous CryptoQuant analyst, Arab Chain, assessed ETH’s Perp–Spot Volume Imbalance indicator on Binance and found that perpetual futures activity has overwhelmingly dominated spot market flows on the exchange.
As of April 27, ETH’s perpetual futures volume totaled 4.47 million ETH, compared with just 300,000 ETH on the spot market.
That translates to a Volume Imbalance of 0.89, a level that signals a derivatives-led market.
ETH Perp–Spot Volume Imbalance | Credit: CryptoQuant
On what this means, Arab Chain noted:
“Such an elevated imbalance typically signals increased risk appetite among traders, as more participants rely on leveraged contracts to generate quick profits. This behavior is often associated with higher volatility, especially during sudden price movements that may trigger large-scale liquidations.”
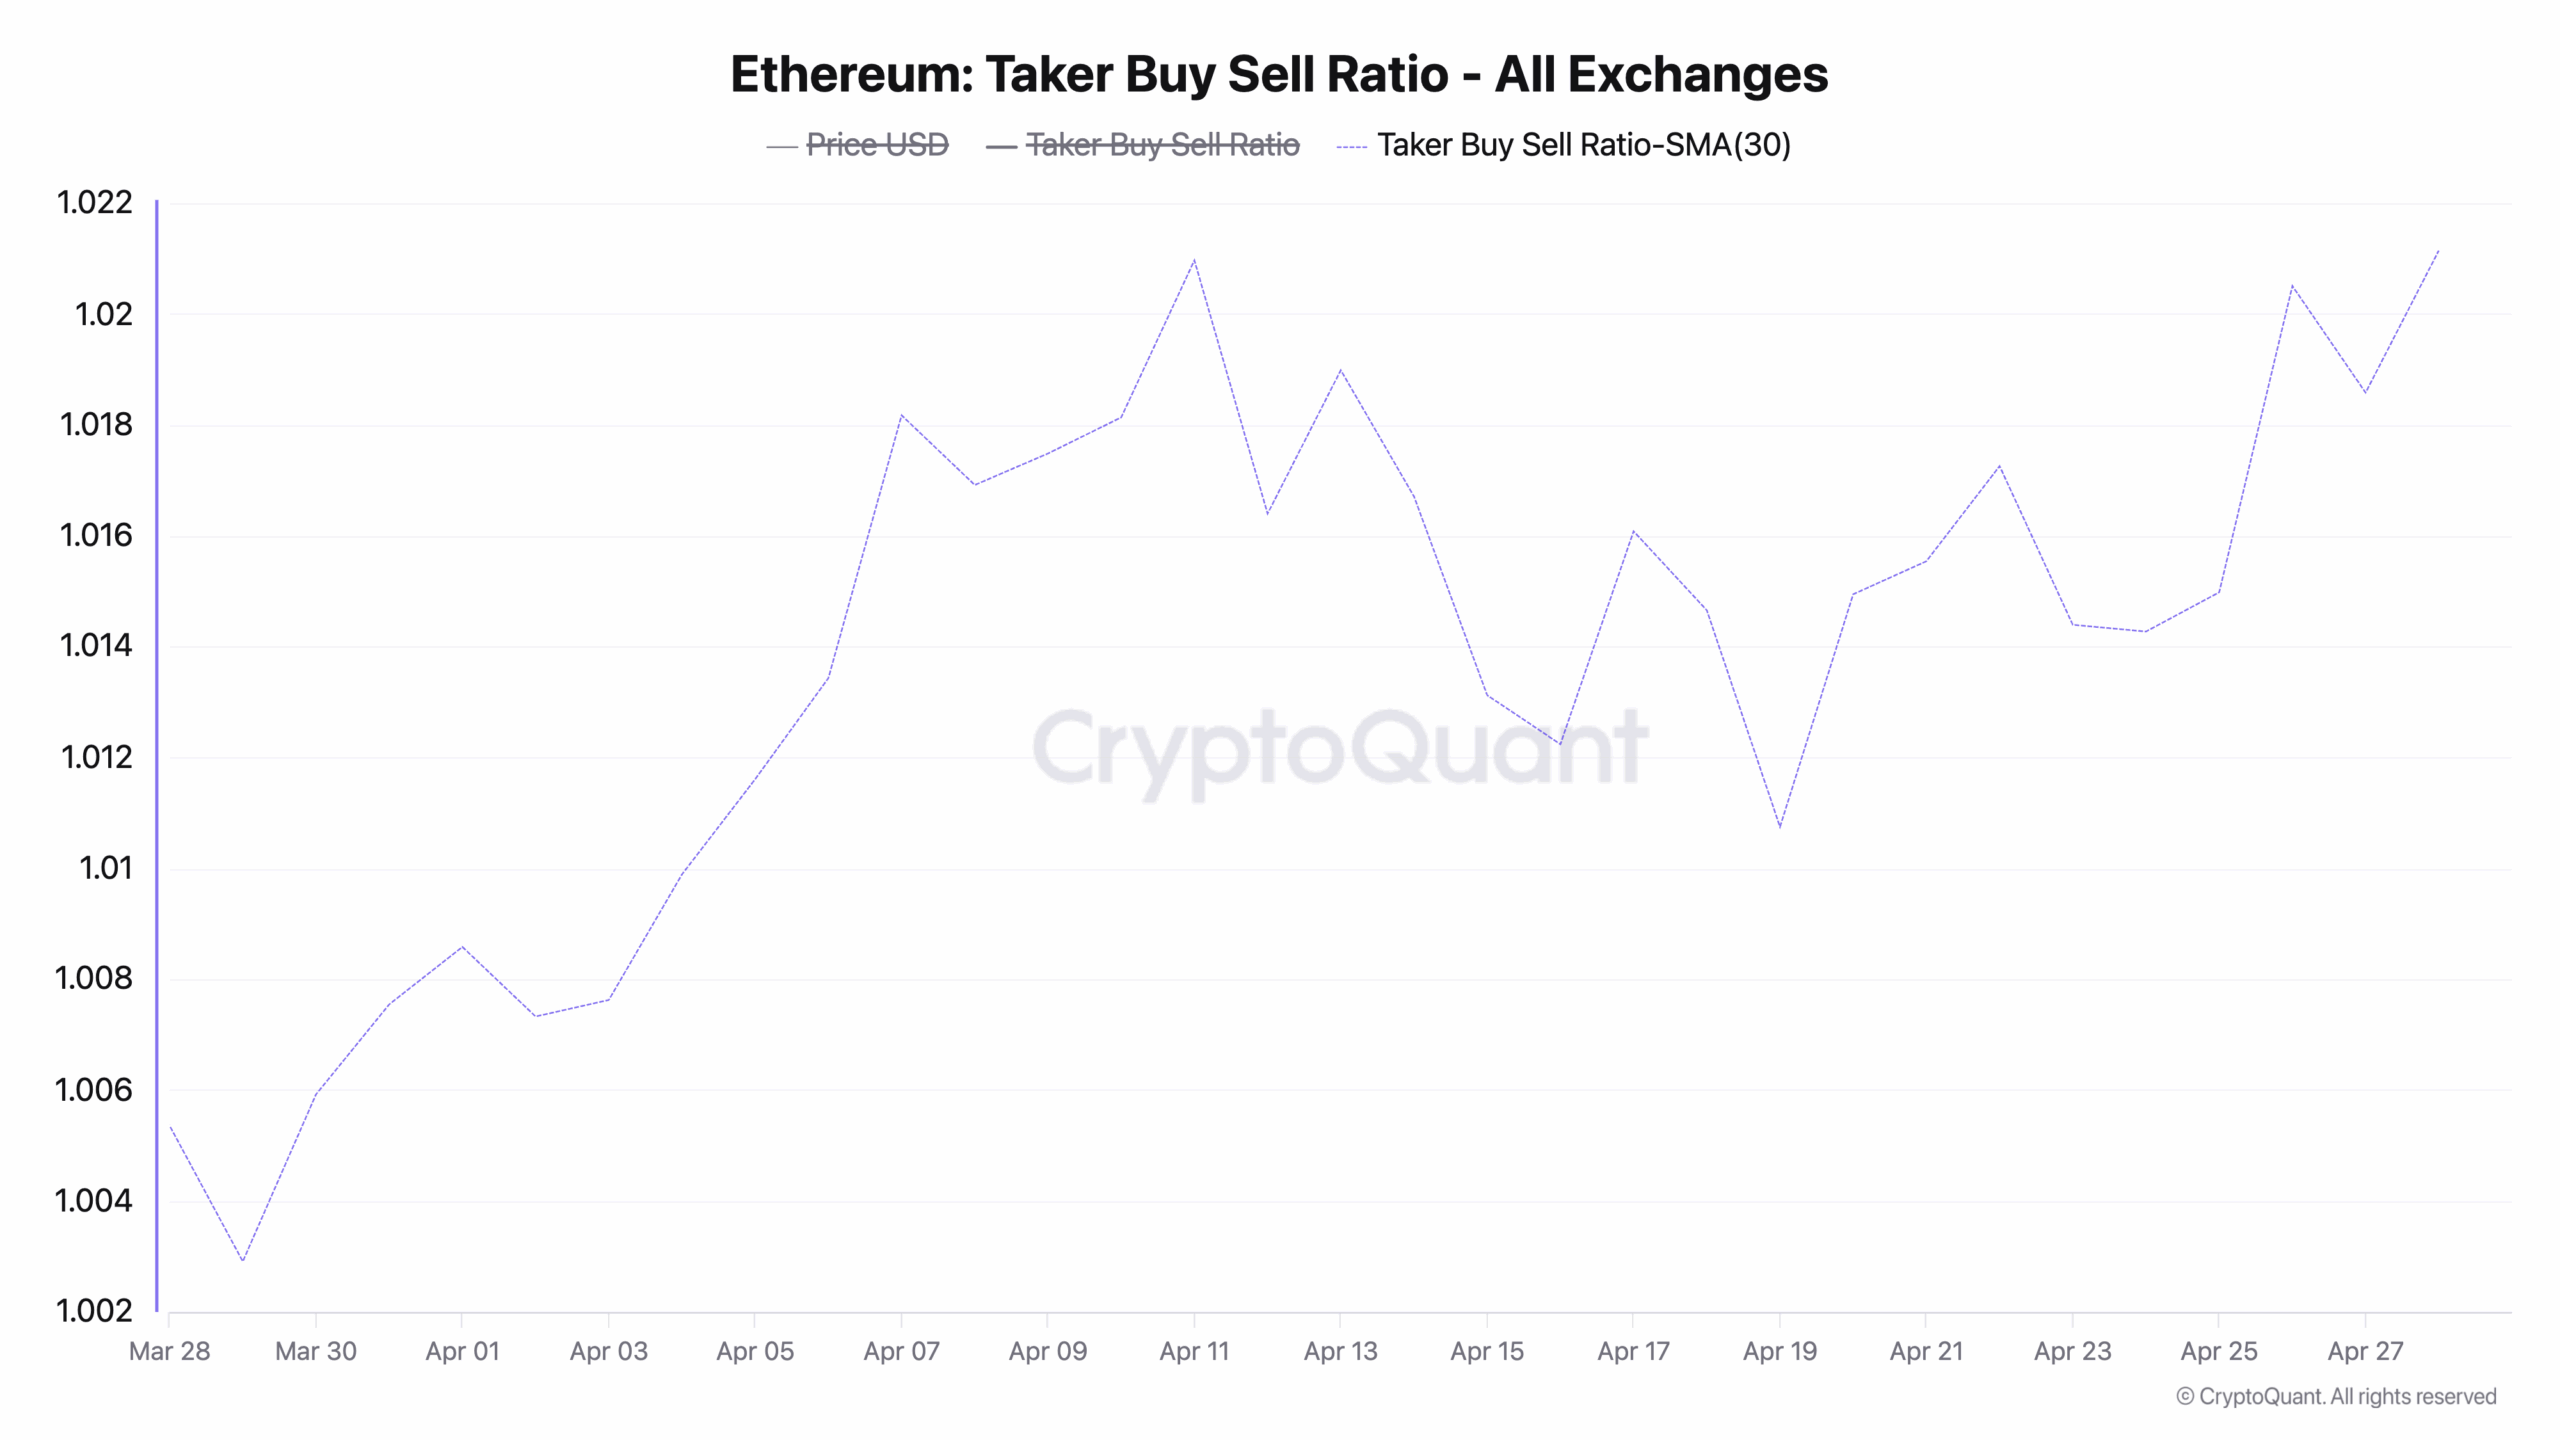
Moreover, the coin’s rising taker buy-sell volume ratio (30-day moving average) confirms the surge in buy-side orders on ETH’s derivatives market.
At press time, this sits at a 30-day high of 1.02, according to CryptoQuant’s data.
An asset’s taker buy-sell ratio measures the ratio of buy to sell volumes in its futures market.
Values above one indicate more buy than sell volume, while values below one suggest that more futures traders are selling their holdings.
This pattern means that while its spot price struggles, ETH derivatives traders continue to open leveraged positions, confident that the coin’s price may rebound in the short term.
Bears Eye $2,162 as Bulls Defend Range Lows
At press time, ETH trades at $2,278, down 1% today as sellers continue to dominate.
If the bearish patterns signaled by ETH’s momentum indicators persist, the token risks falling to the $2,162.92 support level.
A clean break below this zone could open the door to a deeper retracement toward the $2,000 psychological level, with the swing low at $1,754.71 sitting as the downside target should selloffs continue.
Conversely, a reversal in momentum could see ETH stage a breakout attempt on the $2,480.61 resistance.
Disclaimer:
The information provided in this article is for informational purposes only. It is not intended to be, nor should it be construed as, financial advice. We do not make any warranties regarding the completeness, reliability, or accuracy of this information. All investments involve risk, and past performance does not guarantee future results. We recommend consulting a financial advisor before making any investment decisions.
Abiodun Oladokun is a Research Analyst at CCN, where he covers cryptocurrency markets with a focus on on-chain analysis, technical assessments, and emerging trends across decentralized finance (DeFi), real-world assets (RWA), artificial intelligence (AI), decentralized physical infrastructure networks (DePIN), Layer 2s, and meme coins.
Prior to CCN, he served as a Senior On-Chain Analyst at BeInCrypto, producing market reports spanning diverse crypto sectors.
Before that, he conducted technical analysis and market assessments of various altcoins at AMBCrypto, where he also contributed long-form quarterly research papers on DeFi, NFTs, DAOs, and scaling architectures, leveraging on-chain platforms including Messari, Santiment, DefiLlama, and Dune Analytics.
He began his crypto career as a research analyst at SixthSense DAO, developing blockchain forensic tools to trace the history of stolen assets.
Abiodun is a lawyer called to the Nigerian Bar and the founder of Ilé Ijó, a Lagos-based electronic dance music collective.