A fresh batch of economic data risks plunging the US stock market toward its worst sell-off since 2015 - or maybe even the financial crisis. | Source: REUTERS / Brendan McDermid
But although a main yield curve inversion has heralded every recession for five decades, the contractions have lagged the inversion by an average of 22 months – nearly two years – and the S&P 500 has climbed by an average of 12% in the year following the inversion.
Consequently, the stock market should guarantee plenty of upside for investors, at least in the short term. Right?
Maybe not.
Retail Sales Boom Could Be a Fear-Driven False Flag
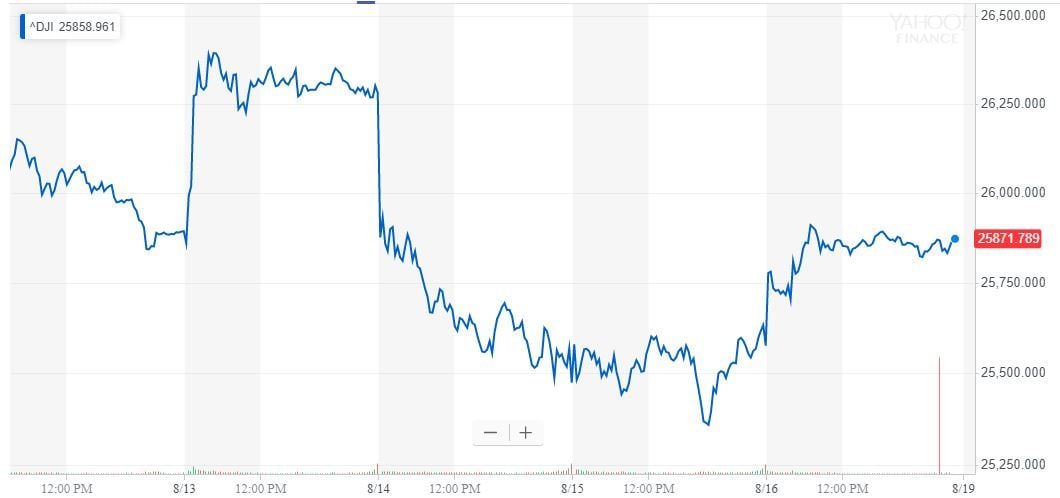
The Dow just closed the book on one of its most volatile weeks in recent memory. | Source: Yahoo Finance
Earlier this week, the Commerce Department published data demonstrating a surge in US retail sales in July. Consumer spending rose 0.7%, its largest gain in four months and more than double the 0.3% increase forecast by Reuters economists.
Investors took strong retail sales data as a bullish indicator, but that might have been a poor decision. | Source: Reuters
“[There’s no denying that consumption growth remains strong, which should prevent the weakness in manufacturing and business investment from dragging the economy into recession any time soon,” Michael Pearce, an economist at Capital Economics, said in a Financial Times interview.
However, contrarian analysts warn that the growth in retail sales data is a false flag and that investors should instead be paying more attention to other macro threats.
Alex Kuptsikevich, a financial analyst at FxPro, said that fear – not optimism – is driving the increase in retail sales.
What are consumers afraid of? President Trump’s trade war with China, which threatens to drive up prices on retail goods. While the White House has claimed that China will pay for the tariffs, most economists disagree. And it seems the public isn’t convinced either.
Kuptsikevich said:
“In our view, the growth of retail sales in the U.S. and UK is a rather bad sign for the economy. In the U.S., consumers may be in a hurry to buy goods before the introduction of new tariffs for supplies from China, which will raise the price of goods. A few months ago, this spike was on the companies’ side, and now the wave of frontloading has reached consumers, as the tariffs are already applied to consumer electronics.”
In other words, consumers aren’t necessarily spending more, they’re just splurging now on big-ticket items they fear will cost more later. (And since they’re speeding up the timelines on these purchases, there’s an even greater probability that they’re financing them with debt.)
US consumer sentiment just printed its lowest reading since January. | Source: Trading Economics
The data seem to support the argument that fear is driving retail sales growth. Consumer sentiment slid to 92.1 in August, its lowest reading since January – and far below analyst estimates.
Factory Output Data Could Be a Leading Indicator of Brutal Stock Market Crash
US industrial production has declined in two out of the past four months. | Source: Shutterstock
Kuptsikevich told CCN.com that investors should instead worry about plunging capacity utilization.
According to Federal Reserve data, Year-over-year US industrial production growth now stands at just 0.5%, down from a peak of 5.4% in September 2018. Month-over-month output fell 0.2% – its second drop in the past four months. The manufacturing sector is now in a technical recession.
Why does that matter? When production dips into the red, Wall Street’s major stock indices often follow quickly behind.
“The dynamics of industrial production is often only a few months ahead of the dynamics of the stock market, Kuptsikevich said.
When US industrial production growth slides into decline, the stock market typically follows. | Source: FxPro
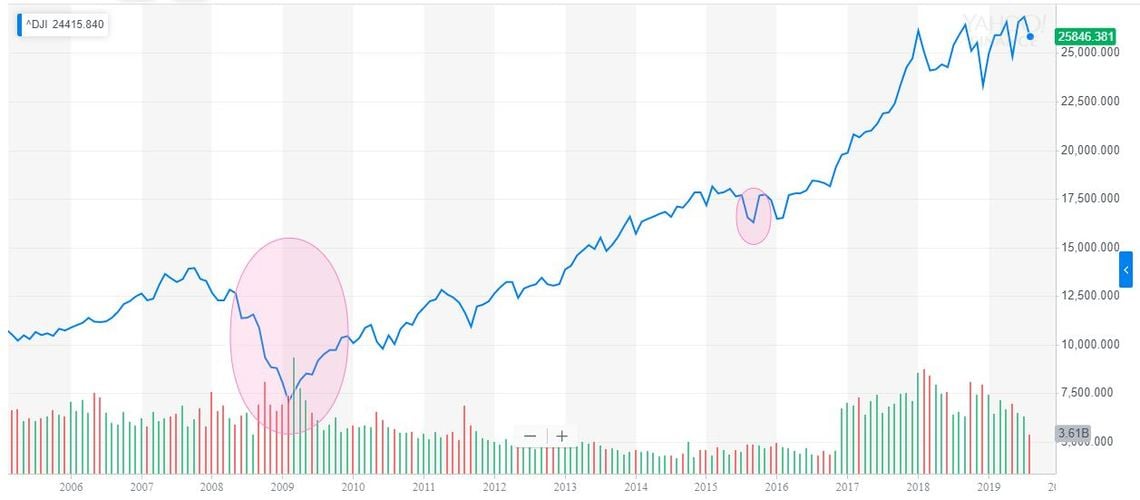
Negative production rates preceded the stock market correction in 2015 – and the 50% Dow Jones Industrial Average crash in 2008.
“In 2008, annual production growth rates went into negative territory in between March and April, and the Dow Jones index began to plummet in May,” Kuptsikevich said. “In 2015, production began to decline in annual terms in March and April. Almost immediately after publication, we saw the Dow Jones plummeting, with a peak in volatility in August of that year.”
Dow Jones corrections often follow negative production rates. | Source: Yahoo Finance
Granted, the Dow had already stagnated before year-over-year industrial production slid into decline. However, Kuptsikevich said that the factory output drops portended the far steeper downturns that followed.
“In both cases, the market’s growth had already slipped, but production data served as an additional reliable sign of the subsequent deterioration of the situation over the next 1-2 months. So now, from current levels, it appears that the markets have yet to set out a specific path for the coming weeks.”
The year-over-year US industrial production is still hovering in positive territory, but perhaps not for long as the trade war continues to weigh on economic forecasts.
Josiah is the former U.S. Editor at CCN.com, where he focused on financial markets. He lives in rural Virginia. Connect with him on LinkedIn or email him directly at josiah.wilmoth(at)www.ccn.com.