Why Bitcoin Keeps Dumping at 10 A.M. When the US Market Opens
Share
Key Takeaways
Bitcoin’s most volatile window is between 9:30 and 10:30 a.m. ET, when U.S. trading, ETF flows, and macro news collide.
Morning Bitcoin dumps are driven by institutional and algorithmic trading, high-frequency strategies and ETF hedging, not retail panic or emotion.
The 10 a.m. pattern highlights Bitcoin’s maturity and deep connection with global finance, reacting to the same forces as traditional markets.
Smart investors treat the 10 a.m. dip as opportunity, planning entries, managing risk, and profiting from frequent post-dump recoveries.
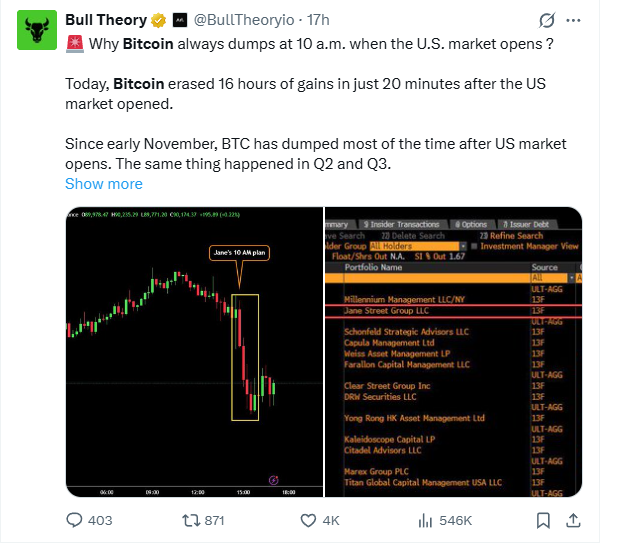
If you’ve been watching Bitcoin lately, you’ve probably noticed a strange pattern: just as the U.S. market opens around 9:30 to 10:00 a.m. Eastern Time, Bitcoin often takes a nosedive. In just minutes, hours of gains can vanish, only for prices to rebound later in the day.
It’s not your imagination. Since early November, Bitcoin has fallen within the first trading hour on more than 60% of U.S. sessions, erasing between 1% and 3% on many mornings. On December 4, for example, BTC dropped 2.1% within 18 minutes after the S&P 500 opened flat.
Why Bitcoin always dumps at 10 a.m. when the U.S. market opens? | Source: @BullTheoryio on X.
On December 15, Bitcoin experienced a sharp and sudden drop of about $3,200, falling from roughly $89,800 to $86,600 in just under an hour. According to Bull Theory, the move triggered over $200 million in long liquidations across major exchanges, all without any apparent negative news or fundamental catalyst.
BREAKING: Bitcoin dumped $3,200 from $89.8k to $86.6k and liquidated $203 million worth of longs.
All this happened in last 60 minutes with no major negative news or FUD.
Another example of 10 am manipulation which happens almost everytime the US market opens.
They pointed out that this kind of abrupt volatility often coincides with the opening of U.S. trading hours, suggesting that algorithmic trading or large institutional orders may be influencing short-term price action. The incident reignited discussion around the lack of clear market structure and regulation in crypto, with many arguing that more transparent oversight could help reduce such unexplained swings.
So what’s really happening? Is it manipulation, a trading algorithm, or just the new rhythm of a global asset tied to Wall Street? Let’s break down the data-backed reasons behind the 10 a.m. dumps, and what they mean for investors.
Bitcoin trades 24/7, but trading activity isn’t evenly spread. Roughly 55% of Bitcoin’s daily volume now occurs during U.S. trading hours, a sharp shift from under 40% just a few years ago.
When the U.S. stock market opens, institutional investors and trading firms flood in with orders. These orders can involve hundreds of millions of dollars in ETFs, futures, and arbitrage trades. That surge in activity often pushes crypto liquidity to its limits, creating the sharp, mechanical-looking sell-offs we see around 10 a.m.
When Bitcoin Dumps Without Negative News — What It Really Means
The latest plunge, a $5,000 Bitcoin drop in under three hours, wiping out roughly $210 billion in total crypto market value and triggering about $700 million in liquidations, looks, at first glance, like pure manipulation. No major headlines, no political shock, no macro panic. Just a straight red candle.
Today's dump makes absolutely no sense.
Bitcoin dumped -$5,000 in 3 hours
$210,000,000,0000 wiped out of crypto market in a single day
But these “news-less” crashes are almost always liquidity-driven chain reactions, not secret conspiracies. Here’s how it usually unfolds:
Leverage builds up: Traders pile into perpetual futures and options with high leverage after a quiet, bullish stretch. Funding rates turn positive, meaning long positions are crowded.
A single large sell order or algorithmic hedge: One big position, ETF redemption, or delta-neutral hedge hits the market. With liquidity thin, that order knocks prices down a few hundred dollars.
Cascading liquidations: As price dips, leveraged longs hit margin limits and get liquidated automatically, forcing exchanges to market-sell their collateral. That snowballs into a multi-billion-dollar flush.
Market-maker withdrawal: Algorithms widen spreads or step back, deepening the gap and accelerating the fall until the system finds real bids.
So while it feels like manipulation, the mechanics could be self-inflicted by leverage and thin liquidity, a common issue in 24/7 crypto trading.
Why Bitcoin Price Drops Even as Institutions Buy Billions
According to Bull Theory, Bitcoin’s recent downturn is not a sign that its fundamentals are breaking down. From a bullish perspective, the decline is being driven by temporary supply pressure, not by a loss of long-term confidence.
Price weakens when sellers become more aggressive than buyers, even if those buyers include large institutions. Right now, the market is dealing with selling that comes from structural sources rather than fear or speculation.
WHY IS BITCOIN STILL DUMPING WHILE INSTITUTIONS ARE MAKING BILLION DOLLAR BUYS?
Bitcoin is not going down because fundamentals are weak.
It is going down because selling pressure is stronger and coming from deeper sources.
One of the main catalysts is renewed stress on Bitcoin mining activity in China. Recent restrictions have coincided with an approximate 8% drop in network hash rate. While China no longer dominates mining as it once did, it still accounts for roughly 14% of global hash power, making any disruption meaningful.
History shows why this matters. During the 2021 cycle, China’s phased mining bans triggered a sharp hash rate collapse when the country controlled more than half the network. Today’s situation is smaller in scale, but even a single-digit decline forces miners and large holders to react quickly.
Forced Selling Explains the Price Action
Bitcoin continuing to trend lower while institutions accumulate only occurs when non-optional selling enters the market. According to bull theory, two groups are contributing most of that supply.
Early Asian holders are one source. Many long-time Bitcoin investors are based in Asia and tend to adjust positions ahead of public developments. If renewed mining or regulatory pressure was anticipated, selling would likely begin weeks in advance. On-chain data supports this, showing increased distribution from long-term holders over the past one to two months.
Miner capitulation is the second source. When mining operations are shut down or disrupted, revenue falls immediately. To survive, miners often liquidate equipment and sell Bitcoin reserves to cover costs. This selling occurs regardless of price levels and adds steady pressure to the market.
Regional Flows Reveal Where the Pressure Is Coming From
While U.S. spot ETFs have seen some outflows, those alone do not fully explain the speed or depth of Bitcoin’s decline. A clearer picture emerges from exchange-level data.
Asian trading venues such as Binance, Bybit, and OKX have shown consistent net spot selling, particularly throughout the fourth quarter. In contrast, Coinbase, which largely reflects U.S.-based flows, continues to register net buying activity.
This divergence suggests that demand remains strong in the U.S., while the majority of selling is concentrated in Asian markets where liquidity is highest.
What does this mean?
From a market standpoint, this is not panic-driven liquidation. It is a transfer of supply from miners and early holders to longer-term buyers. Historically, Bitcoin prices tend to remain under pressure until forced selling is exhausted.
Once that process finishes, the same institutional demand absorbing coins in the background often becomes the foundation for the next upward move.
How US Market Hours Shape Bitcoin’s Behavior
Bitcoin Is Global, But Liquidity Lives in the U.S.
Even though Bitcoin trades worldwide, the biggest pools of liquidity now sit with American and European traders. Exchanges such as Coinbase, Kraken, and CME account for most of the fiat-denominated volume.
That means the U.S. morning session is when the largest players are active. Historically, Bitcoin’s intraday volatility peaks between 9:30 a.m. and 11:00 a.m. ET, matching the equity-market open.
The ETF Effect: Wall Street’s Bitcoin Gateway
Since January, the launch of spot Bitcoin ETFs has drawn billions in institutional inflows. But ETFs only trade during stock-market hours.
For instance, on November 15, heavy ETF redemptions coincided with a 3% intraday dip in BTC within 25 minutes of the opening bell. The timing wasn’t coincidence; it was institutional hedging activity syncing crypto with Wall Street’s clock.
The Role of High-Frequency Trading (HFT)
What Is HFT and Why It Matters in Crypto
High-frequency trading firms, like Jane Street, Jump Trading, and Hudson River, use algorithms that analyze markets and trade thousands of times per second. They profit from tiny inefficiencies between venues and products.
In traditional markets, these firms provide liquidity. In crypto, where order books are thinner, they can move prices instantly when they rebalance or exploit arbitrage.
For months, #BTC has followed the same script: pumps in Asia & Europe, then nukes within ~1 hour of the U.S. cash open The pattern has been eerily consistent since Nov 2025—traders now call it the “10 a.m. slam.”
Algorithms detect spreads between Bitcoin spot, CME futures, and ETF prices.
They sell large blocks to close gaps and rebalance risk.
Automated systems and retail stop-losses cascade, deepening the drop.
Within 10–20 minutes, liquidity stabilizes, and bots buy back cheaper.
That’s why you often see a fast 1–3% dip followed by a slow grind higher, a signature of algorithmic trading, not human panic.
Why 10 A.M. Is a Critical Pivot Point for the Crypto Market
U.S. Economic Data Arrives Like Clockwork
At exactly 10:00 a.m. ET, several major U.S. economic indicators are released, ISM manufacturing data, housing numbers, and consumer confidence among them.
These reports can instantly shift bond yields and the dollar, both of which correlate with Bitcoin’s short-term moves.
For example, on October 3, a stronger-than-expected Institute for Supply Management (ISM) print pushed Treasury yields higher and sent Bitcoin down 2.5% in 30 minutes, even though crypto media was quiet.
Correlation With Stocks Is at Record Highs
Bitcoin’s 30-day rolling correlation with the Nasdaq 100 recently hovered around 0.65, meaning it often moves in the same direction as major tech stocks.
So, when equity traders de-risk at the open, Bitcoin tends to get swept along, magnifying any early-morning weakness in traditional markets.
The Jane Street Theory — How Much Is True?
On X, many traders point to Jane Street, a global trading powerhouse, as the culprit behind the daily dumps. The claim: they short Bitcoin at the open, drive price into liquidity pockets, buy back cheaper, and repeat.
Jane Street is indeed one of the largest market makers for Bitcoin ETFs and holds over $2 billion in crypto-related assets on its books. Its algorithms execute vast quantities of trades each morning.
BTC has been consistently dumping ~2-3% within minutes of the US cash open (10 a.m. ET) almost every trading day since early November. Many traders point to Jane Street’s massive $2.5B+ position in BlackRock’s IBIT as the likely driver: engineered liquidity sweeps to accumulate… pic.twitter.com/HrDFCurvkO
Such traders have been pointing to an interesting pattern in Bitcoin and related ETF trading around the U.S. market open. Recent regulatory filings show major firms significantly increasing exposure to spot Bitcoin ETFs, while at the same time, sharp bursts of selling have repeatedly appeared shortly after 9:30 a.m. ET.
The speculation is that heavy early-session sell pressure can push prices lower, trigger leveraged liquidations, and thin out order books, potentially allowing well-capitalized desks to re-enter at more favorable levels later in the session.
However, there’s no verified proof of coordinated action, and large firms regularly hedge and rebalance positions for many reasons. Still, the timing overlap between institutional ETF accumulation and recurring open-hour volatility has sparked debate about how sophisticated players may influence short-term market dynamics.
What looks like “manipulation” could simply be market-making mechanics: providing liquidity, hedging ETF flows, and arbitraging futures, all standard in modern finance.
There have been persistent whispers in crypto circles about certain institutional trading desks running a very specific/shady playbook…
(Jane Street included.)
ICYMI: Jane Street just ranked as one of the top net buyers of BlackRock's Bitcoin ETF ($IBIT) in Q4 2025.
Jane Street's modus was simple. It aggressively bought large quantity of F&O stocks in cash & futures while also buying Put options. Then, it sold the stocks & sent market crashing & profited from Puts (& vice-versa). SEBI has impounded the illegal gains of ₹4843 Cr & banned it pic.twitter.com/ShqLlbwpSU
According to SEBI’s investigation, Jane Street engaged in a repeated pattern of artificially influencing index levels through coordinated activity in cash, futures, and options markets.
The firm’s modus operandi was straightforward yet impactful: it would aggressively buy large quantities of F&O (futures and options) stocks in both cash and futures segments, while simultaneously purchasing Put options on the same indices. Once these positions were established, Jane Street allegedly sold off the underlying stocks, driving market prices lower and reaping large profits from its Put positions.
The regulator also found mirror-image trades on other occasions, where the firm allegedly bought Call options while shorting the underlying indices, benefitting when markets rebounded. SEBI concluded that these trades were not genuine hedging or arbitrage, but deliberate attempts to distort price discovery in index derivatives such as Bank Nifty and Nifty options.
Following a detailed forensic examination of trade data, including minute-by-minute analysis of Jane Street’s activity around market opens and closes, SEBI determined that the group’s actions compromised market integrity. As a result, the regulator has impounded illegal gains amounting to ₹4,843 crore and imposed a market ban on Jane Street and its related entities.
This marks one of SEBI’s largest enforcement actions against a foreign proprietary trading firm, signaling a tougher stance on algorithmic manipulation and cross-segment price distortion. The case also highlights the growing global scrutiny of high-frequency and quantitative trading practices in emerging markets.
Risks Behind Bitcoin’s Morning Volatility
While Bitcoin’s daily 10 a.m. swings highlight its growing maturity, they also expose traders to unique and often underestimated risks. These sharp, algorithm-driven moves can wipe out leveraged positions or trigger cascading liquidations in minutes.
First, liquidity risk is highest during the first half-hour of U.S. trading. As institutional algorithms flood the market, spreads can widen and slippage increases, especially on exchanges with thinner order books. Retail traders entering during these moments often face unfavorable fills or stop-loss traps.
Second, volatility risk compounds when macroeconomic data and ETF flows hit simultaneously. For example, when U.S. inflation or manufacturing reports surprise the market, Bitcoin can swing 3–5% within an hour. Traders relying on static stop levels or automated bots may be caught off guard.
Third, there’s a correlation risk that many underestimate. Bitcoin now moves closely with tech equities and global risk sentiment. A sudden sell-off in the Nasdaq or a jump in Treasury yields can drag Bitcoin lower even without crypto-specific news.
Finally, behavioral risk remains constant. Emotional trading, panic-selling during morning dumps or over-leveraging on rebounds, often leads to losses. Successful investors understand that these patterns reflect structure, not chaos, and they manage exposure accordingly.
What Crypto Traders and Investors Should Keep in Mind
Expect morning volatility: The hour between 9:30 and 10:30 a.m. ET consistently shows the highest intraday volatility for BTC. If you trade short-term, treat this as your risk window.
Track economic releases: Keep a simple calendar of 10 a.m. data drops. Days with ISM, PMI, or confidence reports often coincide with the sharpest crypto moves.
Avoid emotional trades: Quick dumps often rebound within hours. In backtests from Q2–Q4 2025, nearly 70% of early-session dips recovered by the following morning.
Think bigger picture: For long-term investors, these intraday swings are background noise. Institutional activity and ETF participation are signs of Bitcoin’s mainstream acceptance, not market weakness.
Mornings Belong to the Machines: Why Bitcoin Now Moves to Wall Street’s Rhythm
Bitcoin is no longer a fringe digital asset traded on weekends by hobbyists. It’s a globally watched instrument influenced by institutional money, macro data, and machine trading.
That means the 10 a.m. dump isn’t a mystery, it’s part of Bitcoin’s maturation. As the market evolves, new patterns will form. But for now, mornings belong to the machines.
The next time Bitcoin tumbles at 10 a.m., don’t assume manipulation. The move likely reflects ETF flows, high-frequency hedging, and macro news hitting all at once.
For day traders, it’s a test of discipline. For long-term holders, it’s proof that Bitcoin has entered the big leagues, a market shaped by the same forces that drive global finance.
In the end, Bitcoin’s daily dance with Wall Street may cause headaches, but it also signals progress: the world’s first decentralized asset now moves in step with the center of global capital.
Why does Bitcoin always drop around 10 a.m. Eastern Time?
Most sharp Bitcoin drops happen around 10 a.m. because that’s when U.S. stock markets open and trading volume surges. Institutional players, ETF market makers, and high-frequency algorithms rebalance portfolios, causing short-term sell pressure.
Is someone manipulating Bitcoin every morning?
There’s no verified proof of intentional manipulation by any single firm. The 10 a.m. dips are more likely the result of automated trading, ETF flows, and macroeconomic reactions, not coordinated price control.
Does the 10 a.m. Bitcoin dump affect long-term investors?
Not really. These short-term dips usually recover within hours or days. For long-term holders, they’re just noise caused by market mechanics, not a sign of structural weakness in Bitcoin.
How can traders prepare for Bitcoin’s 10 a.m. volatility?
Traders should watch economic calendars for 10 a.m. data releases, avoid high leverage during the U.S. market open, and consider entering positions after 11 a.m. ET, once volatility cools down.
Disclaimer:
The information provided in this article is for informational purposes only. It is not intended to be, nor should it be construed as, financial advice. We do not make any warranties regarding the completeness, reliability, or accuracy of this information. All investments involve risk, and past performance does not guarantee future results. We recommend consulting a financial advisor before making any investment decisions.
Onkar Singh has three years of experience as a digital finance content creator. Throughout his career, he has collaborated with various DeFi projects and crypto media outlets. In his leisure time, he enjoys fitness activities at the gym and watching movies across different genres. Balancing his professional and personal interests, Onkar continues to contribute to the digital finance landscape while pursuing his hobbies.


 Easy
Easy