Is Bitcoin's September Dip A Myth? A Deep Dive Into Redtember And Greentober
Share
Key Takeaways
Historical analysis shows varied performance for the price of Bitcoin during the months of September and October.
BTC price behavior during these months has seen bearish and bullish trends depending on the year.
September tends to be more bearish, with ten occasions of prices going down and only three occasions of prices going up from 2011 to 2023.
October historically performs better, with eight times up and only five times down, often marking a recovery month after a weak September.
Bitcoin’s price history shows a clear seasonal pattern, especially in the months of September and October. Traders often refer to September as “Redtember” due to its tendency toward corrections and sell-offs, while October is known as “Greentober” for its stronger rebound potential.
Over the past decade, these two months have repeatedly reflected shifts in market sentiment, regulatory developments, and macroeconomic conditions.
With Bitcoin entering the final stretch of 2025, understanding this recurring cycle helps put today’s volatility into perspective and offers clues about what may lie ahead.
Overview of Bitcoin Price Volatility
Bitcoin is known for its volatility, with price fluctuations that can be affected by numerous external factors such as market sentiment, regulatory news, and macroeconomic shifts. September, often coined “Redtember,” has normally been a downward trend, while October, dubbed “Greentober,” tends to see price rebound to the upside.
This article aims to explain this pattern over the past decade and forecast short-term future BTC price movements in the last four months of 2025.
New Trending Crypto Wallet Offers
Sponsored
Disclosure
We sometimes use affiliate links in our content, when clicking on those we might receive a commission at no extra cost to you. By using this website you agree to our terms and conditions and privacy policy.
In 2012, price remained stable, closing at $11.40, signaling calm before November’s post-halving rally.
As for 2016, BTC rose from $603 to $725 as July halving effects took hold.
In 2020, BTC ranged $10,778 to $13,746, marking the start of a bullish cycle fueled by institutional adoption and halving-driven scarcity.
Halving years tend to magnify October’s performance, as the market reacts to Bitcoin’s supply shock.
As a result:
Redtember: Refers to September, historically associated with negative price movements for Bitcoin.
Greentober: Highlights October as a recovery month for Bitcoin, where price trends upwards following the dips in September.
Historical Analysis (Last 13 Years)
Over the last decade, Bitcoin’s performance during September and October has consistently reflected market trends and global sentiment.
In years when the Net Unrealized Profit/Loss (NUPL) was in the “Optimism” or “Belief” range, where Bitcoin currently stands in September 2024, the cryptocurrency has in the past shown that October is generally a resilient month, rebounding above a typically bearish September pattern.
For instance, in 2013, 2017, and 2021, the market was firmly in the “Belief” phase, which signaled strong bullish sentiment. During these years, Bitcoin saw price recoveries in October after slight dips in September. This suggests that when sentiment is optimistic, even brief market corrections do not derail long-term uptrends.
Year
September (Open to Close)
September Direction
October (Open to Close)
October Direction
2011
$8.20 → $5.10
Down
$5.10 → $3.30
Down
2012
$10.20 → $12.50
Up
$12.50 → $11.40
Down
2013
$144.20 → $130.30
Down
$130.30 → $202.00
Up
2014
$502.50 → $389.60
Down
$389.60 → $341.20
Down
2015
$229.30 → $236.00
Up
$236.00 → $326.00
Up
2016
$572.00 → $603.00
Up
$603.00 → $725.00
Up
2017
$4,758.00 → $4,312.00
Down
$4,312.00 → $6,479.00
Up
2018
$7,000.00 → $6,625.00
Down
$6,625.00 → $6,330.00
Down
2019
$9,608.00 → $8,083.00
Down
$8,083.00 → $9,165.00
Up
2020
$11,650.00 → $10,778.00
Down
$10,778.00 → $13,746.00
Up
2021
$47,156.00 → $43,800.00
Down
$43,800.00 → $61,300.00
Up
2022
$20,049.00 → $19,700.00
Down
$19,700.00 → $20,700.00
Up
2023
$27,200.00 → $25,670.00
Down
$25,670.00 → $30,300.00
Up
2024
$59,100.00 → $57,250.00
Down
$57,250.00 → $71,450.00
Up
In October 2017, Bitcoin’s price increased even though global political tensions rose, particularly between the U.S. and North Korea. This period increased threats of nuclear conflict, with North Korea conducting missile tests and the U.S. responding with military posturing.
Throughout these tensions, Bitcoin increased from $4,312 to $6,479. Investors began to view Bitcoin as a “safe-haven” asset, akin to gold, protecting wealth during instability.
With NUPL in the “Belief” phase, Bitcoin’s resistance was reinforced by the narrative that Bitcoin is “digital gold” and a speculative hedge against market volatility. Given historical patterns, this could signal that, while the market remains cautious, a strong October recovery is probable.
Factors Influencing Bitcoin’s September and October Performance:
Macroeconomic Factors
From 2011 to 2023, global macroeconomic events, such as inflation concerns and central bank policies, have always impacted Bitcoin’s price.
In September 2020, driven by concerns about the pandemic and economic shutdowns, Bitcoin rallied from $10,778 in September to $13,746 by October as investors anticipated further monetary stimulus. This pattern of price recovery in October aligns with the typical “Greentober” narrative.
However, during September 2022, fears of inflation and aggressive monetary tightening by the Federal Reserve led to a decline in Bitcoin, with its price dropping from $20,049 at the start of September to $19,700 by month-end. Investors showed a strong risk-off sentiment, shifting funds away from speculative assets like Bitcoin.
Market Sentiment
Sentiment indicators like the NUPL indicator illustrate the market sentiment during these months. Historically, NUPL values in September tend to indicate reduced optimism, corresponding to price drops.
For example, in September 2018, the NUPL was in Capitulation territory, reflecting widespread market pessimism, and Bitcoin’s price fell from $7,000 to $6,625. However, by October 2019, NUPL began to shift toward Optimism as Bitcoin rebounded from $8,083 to $9,165, showing that market sentiment was turning positive.
Technical Analysis
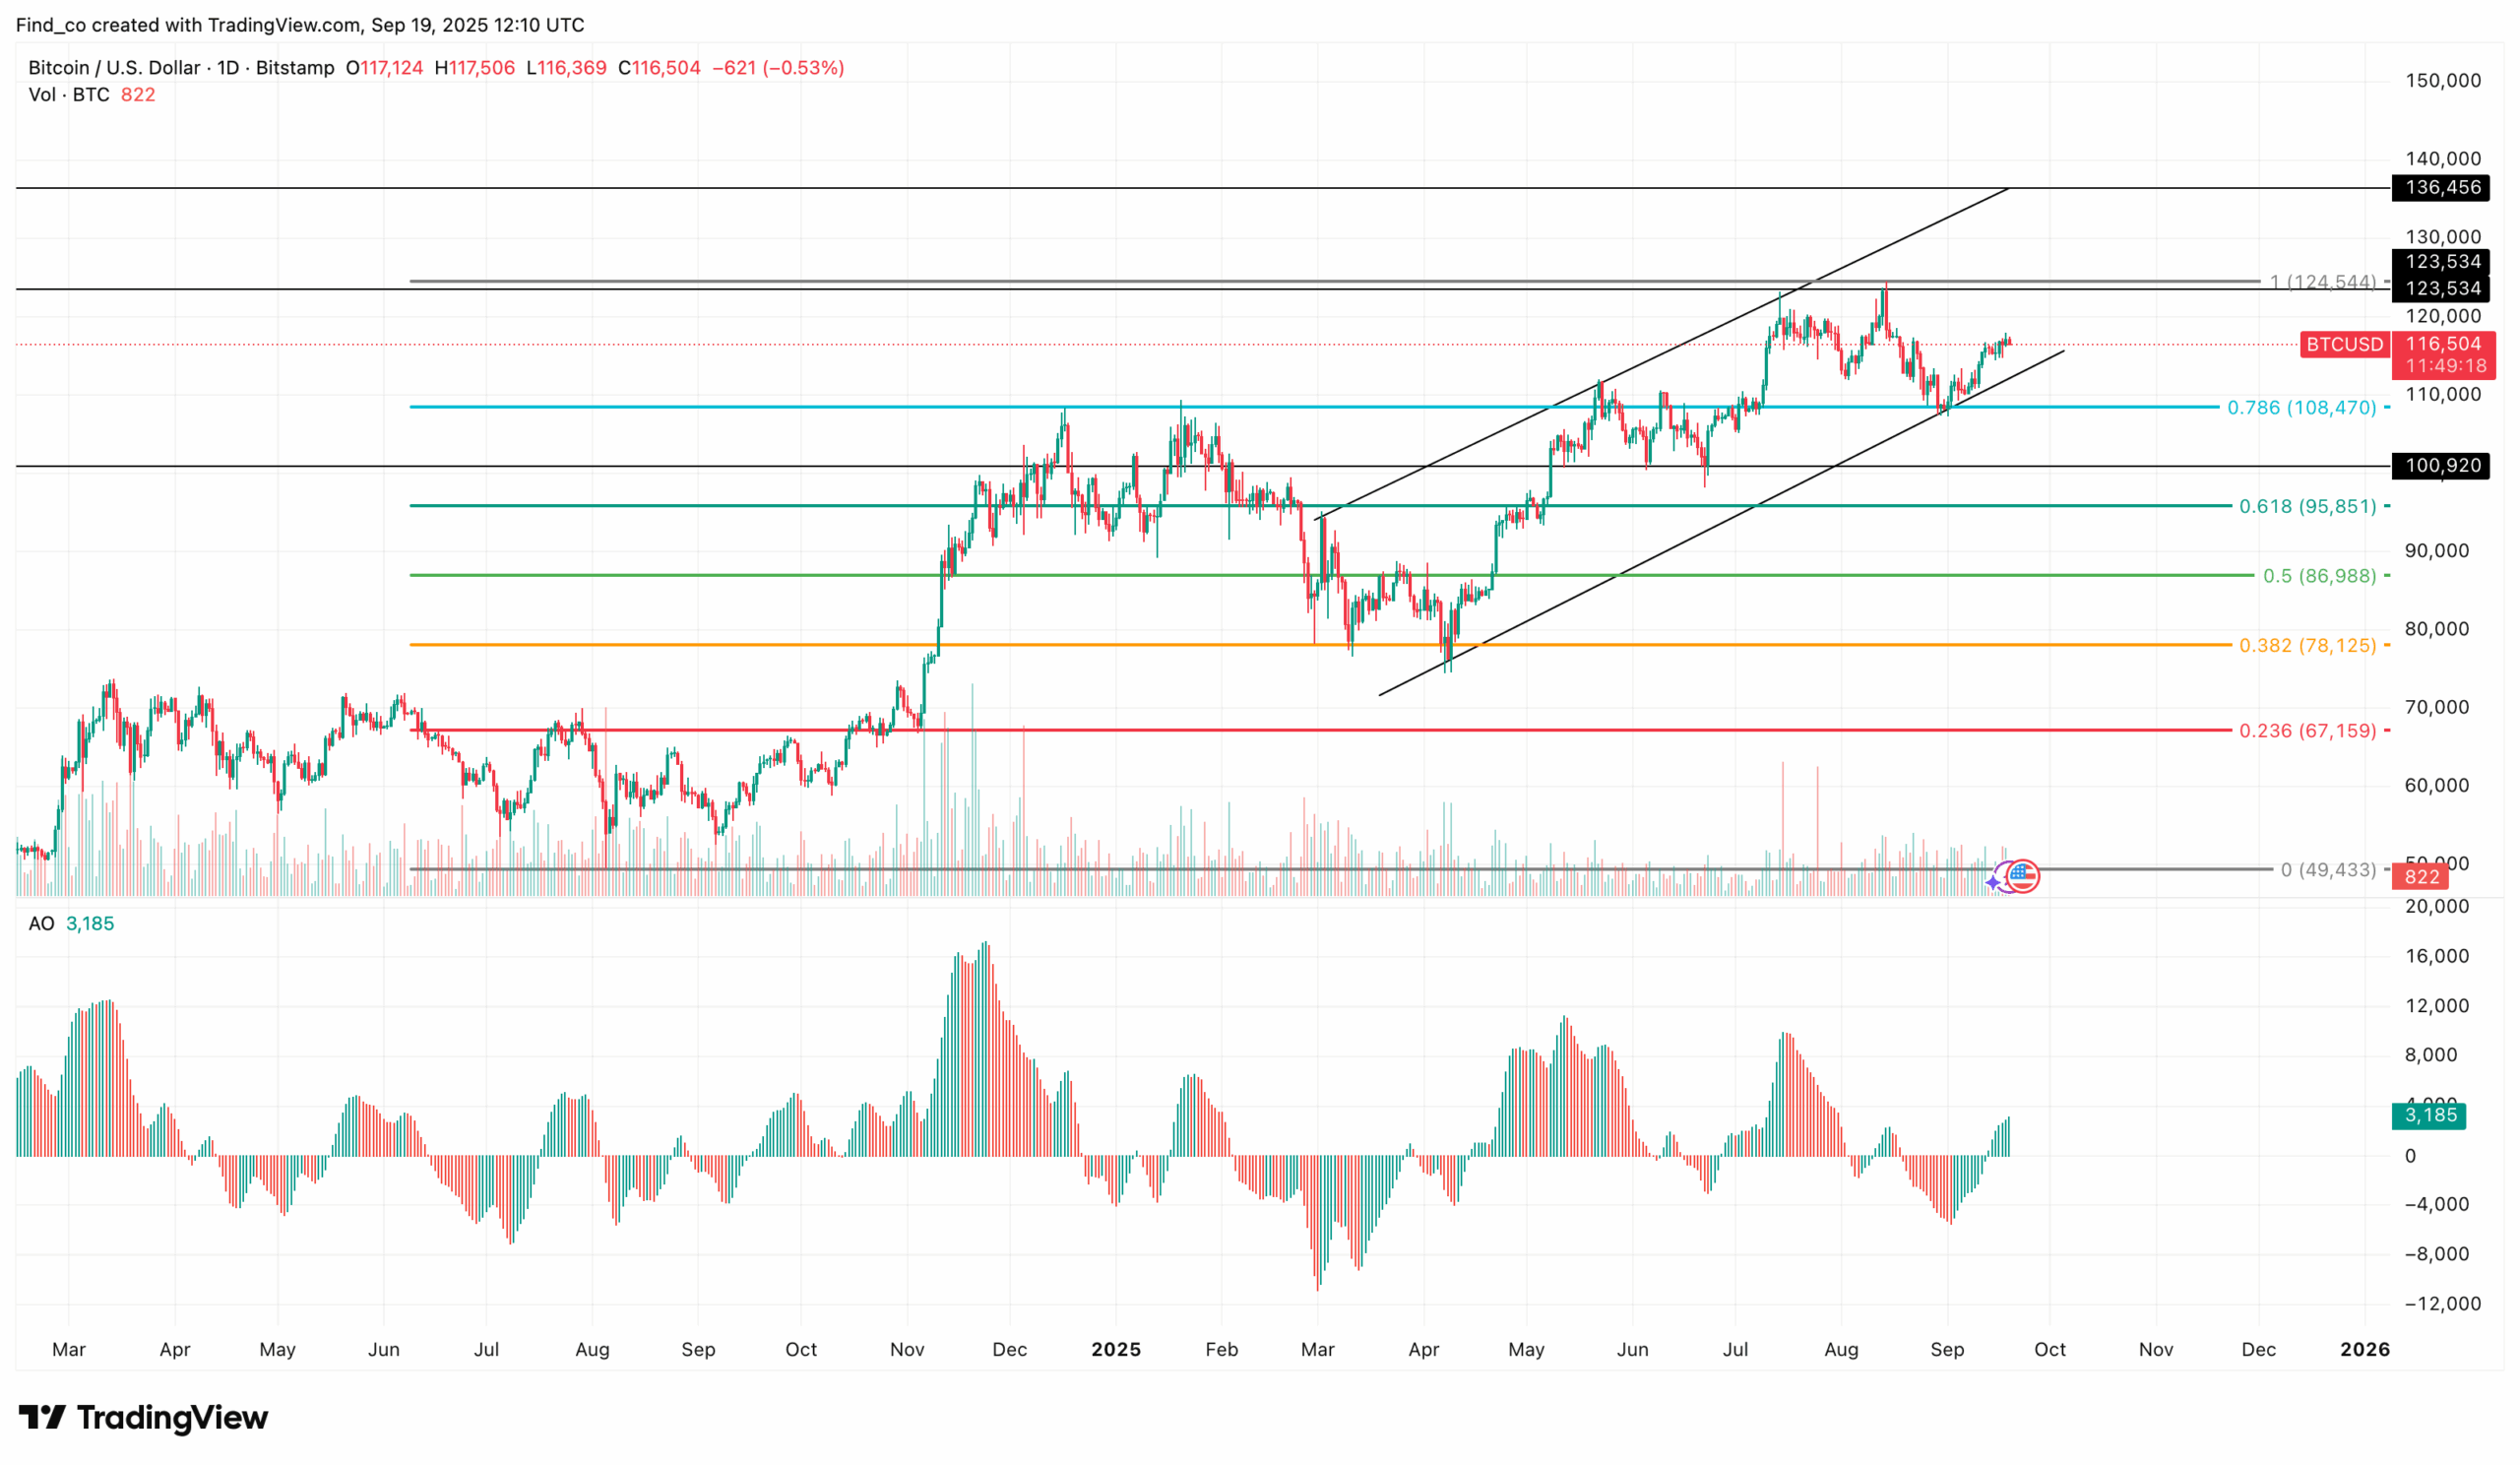
On the daily chart, CCN observed that Bitcoin (BTC) is trading within an ascending channel, a pattern that suggests the coin may have completed its correction and is now resuming its uptrend.
Adding to this, the Awesome Oscillator (AO) has flipped from negative to positive, signaling a clear shift in momentum from bearish to bullish.
Bitcoin vs USD chart. | Credit: Victor Olanrewaju/TradingView
If this trend holds, BTC could soon retest resistance at $123,534, provided buyers continue to defend support around $109,920. In a highly bullish scenario, Bitcoin may even rally toward $136,456 by October or before the end of Q4.
However, risks remain. If capital inflows into BTC decline significantly, the bullish setup may falter. In that case, Bitcoin’s price could retrace toward $95,851, testing lower support levels.
Regulatory Developments
Regulatory issues have often sparked market price fluctuations in September and October. In September 2017, news of China banning initial coin offerings (ICOs) and tightening cryptocurrency regulations triggered a sharp sell-off, causing Bitcoin to drop from $4,758 to $4,312.
By October, the market had recovered as those regulatory fears passed, and traders began anticipating more favorable developments, pushing Bitcoin to $6,479. Similarly, in October 2021, the U.S. Securities and Exchange Commission (SEC) approved the first Bitcoin futures Exchange Traded Fund (ETF), which sparked a massive price increase from $43,800 at the start of October to $61,300 by the end of the month.
Most recent events:
SEC streamlines spot crypto ETF approvals (timeline cut to 75 days), paving way for altcoin ETFs.
U.S. passes GENIUS Act for stricter stablecoin oversight.
SEC and CFTC launch joint crypto oversight initiative.
While “Redtember” has some merit historically, Bitcoin’s performance in September has not always been negative, and market conditions vary yearly. After seven consecutive years of price declines in September, Bitcoin might also turn upward, which would be the fifth time in 15 years the price went up in September.
October is normally a month of recovery, but as with any financial market, past performance does not guarantee future results. With regard to October, Bitcoin has gone up for eight of the last nine years.
Given this pattern, this could be the tenth year, suggesting that for every decade, there’s typically one unfavorable October, indicating a potential price increase for Bitcoin this October.
Are "Redtember" and "Greentober" officially recognized within the cryptocurrency community?
No, these terms are informal but widely used by traders and analysts to describe observed trends in Bitcoin’s price during September and October.
Is there a historical precedent for Bitcoin's price movements during September and October?
Yes, historical data shows a tendency for Bitcoin’s price to dip in September, with a potential recovery in October. However, these patterns are not consistent every year.
How do macroeconomic factors influence Bitcoin's performance during these months?
Global economic conditions, such as inflation rates, interest rate policies, and geopolitical events, can lead to risk-off behavior. In September, these factors negatively impacted Bitcoin, but it could recover once these fears subside in October.
Can technical analysis be used to predict Bitcoin's price movements during Redtember and Greentober?
Yes, technical analysis tools like RSI, moving averages, and volume trends are often used to gauge potential price movements during these months. However, external factors such as news events also play a significant role.
Disclaimer:
The information provided in this article is for informational purposes only. It is not intended to be, nor should it be construed as, financial advice. We do not make any warranties regarding the completeness, reliability, or accuracy of this information. All investments involve risk, and past performance does not guarantee future results. We recommend consulting a financial advisor before making any investment decisions.
Giuseppe Ciccomascolo began his career as an investigative journalist in Italy, where he contributed to both local and national newspapers, focusing on various financial sectors.
Upon relocating to London, he worked as an analyst for Fitch's CapitalStructure and later as a Senior Reporter for Alliance News. In 2017, Giuseppe transitioned to covering cryptocurrency-related news, producing documentaries and articles on Bitcoin and other emerging digital currencies. He also played a pivotal role in establishing the academy for a cryptocurrency exchange website. Crypto remained his primary area of interest throughout his tenure as a writer for ThirdFloor.
Andrew Kamsky is a chart analyst and writer with a background in economics and ACCA certification. He has held roles at a Big Four firm, a fintech bank, and a listed bank specializing in currency hedging. His work explores Bitcoin, macro trends, and market structure. Outside finance, he's passionate about music, travel, and neon design.
Victor Olanrewaju is a crypto analyst and reporter at CCN with deep roots in on-chain research and technical analysis. His crypto journey began in 2017, but it was the 2020 Uniswap airdrop that sparked a full-time pivot into the space.
With a foundation in copywriting, Victor honed his craft creating high-converting content for leading crypto brokers — most notably an XRP price prediction that ranked #1 on Google during the 2021 bull run.
He later joined AMBCrypto in 2022, where he combined storytelling with technical and on-chain analysis to cover key market narratives.
In 2024, he expanded his expertise at BeInCrypto, collaborating with analysts and using tools like Glassnode, Santiment, and IntoTheBlock to break down Bitcoin and altcoin trends.
At CCN, Victor covers the top cryptocurrencies, memecoins, macro shifts, blending real-time insights with deep-dive metrics.
He holds a Bachelor’s degree in Physics from the University of Ibadan, equipping him to simplify complex data for a wide audience. Follow his work or connect on LinkedIn or X.


 Easy
Easy