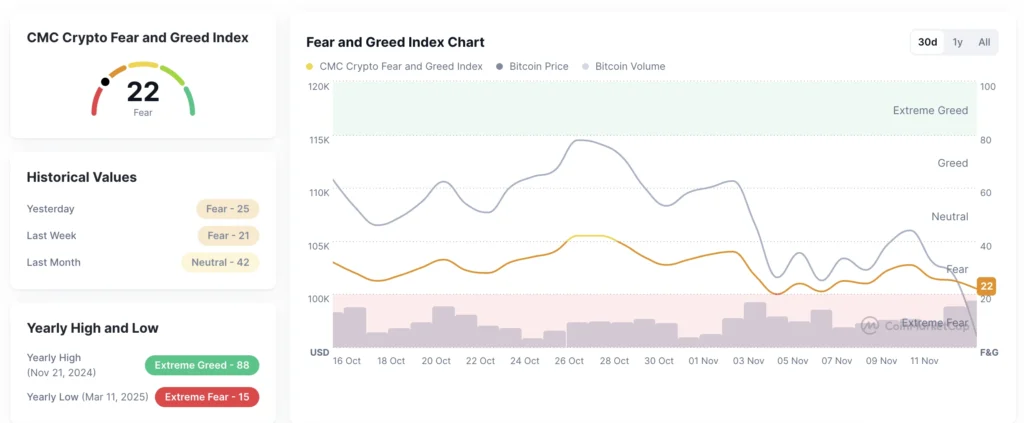
Traders pay close attention to short-term signals because each move around $98,000 feels heavier than usual.
Fear appears quickly in the data when the market senses pressure building.
FOMO fades quickly during sharp drops as late buyers rush to exit and add more pressure to the move.
The drop below $98,000 reminds the market how quickly confidence can fade, but not all views are negative as some traders see the move as a healthy correction rather than the start of a deeper decline.
On November 14, 2025, the market experienced a sharp turn as Bitcoin slipped below the critical $98,000 level, triggering one of the strongest fear signals of the quarter.
The move raised a clear question for traders about whether growing fear is now driving the market’s volatility.
The reaction to this sudden change came fast and showed how sensitive the market felt. Traders exited high-risk positions, and major exchanges recorded a jump in liquidations as confidence weakened.
The pace of the shift revealed how quickly fear replaced optimism during the drop.
Bitcoin data | Source: CoinMarketCap
The Extreme Fear Index picked up the shift in real time and showed how quickly confidence faded once the price broke below $98,000.
The sharp move sparked a new debate about Bitcoin’s next direction, both in the long and short term, as investors watched to see whether fear or value buying would shape the coming sessions.
Bitcoin and panic | Source: X @nilesh_rohilla
This article explains what triggered the shift, how the Extreme Fear Index reacted, and what this signal may tell the market about Bitcoin’s next move.
The Extreme Fear Index is a concept that helps understand behaviour during sharp market drops and helps traders understand how sentiment shifts under pressure.
It is based on the Fear and Greed Index using the following values:
0: Extreme fear
1 to 24: Extreme fear
25 to 44: Fear
45 to 55: Neutral sentiment
56 to 75: Greed
76 to 100: Extreme greed
The index helps traders understand how emotions drive short-term behavior and how quickly the market shifts from confidence to caution.
Therefore, the index reacts fast when uncertainty grows and shows how stress spreads across different parts of the market.
As Bitcoin slipped under $98,000, it confirmed a fast change in mood and moved closer to the extreme fear zone.
This shift set the stage for a closer examination of how sentiment shifted rapidly. It also reshaped trader behavior across several areas and added new pressure to market stability.
This change also influenced how fear replaced excitement during the drop, which shaped the next stage of the correction.
How FOMO Turns Into Panic Selling During the Bitcoin Price Crash
A sharp shift in mood can have swift consequences in the world of finance and especially in the world of crypto.
It pushes traders away from the optimism that built during the earlier rally. Bitcoin’s move below $98,000 brings a different tone across exchanges and adds pressure to every short-term swing as fear replaces confidence.
These are some of the main outcomes:
FOMO reversal: the fear of missing out (FOMO), often prompts traders to make late entries during strong rallies. Traders who chased the final stages of the rise exited positions once the drop intensified.
Chain reaction: Early sell orders triggered more selling as momentum signals weakened.
Liquidation pressure: High-risk positions faced rapid losses as platforms recorded a rise in forced exits.
Emotional trading: Market chatter pointed to anxiety-driven decisions during the sharp move down.
The intense rush to exit positions shapes the next stage of the correction and guides how traders prepare for short-term moves. It also shifts attention toward what the fear signal may mean for the sessions ahead.
The market did not shift solely on the Bitcoin chart. A mix of wider economic signals, institutional behavior, and global risk appetite shaped the mood long before the price slipped. These external pressures worked together to weaken confidence across multiple areas simultaneously.
Sticky inflation and fading rate-cut hopes: Inflated price data kept policymakers cautious, making rate cuts less likely, which drained liquidity and lowered demand for high-volatility assets, such as Bitcoin.
Institutional buying slowdown: Spot Bitcoin Exchange Trading Funds (ETFs) recorded major outflows, more than $1.2 billion over recent sessions, while corporate treasuries held back. That removed a key layer of market support.
Global risk-off mood among high-risk assets: Tech stocks in major U.S. indexes dropped as investors retreated from risk. Bitcoin, which often tracks those moves, came under pressure as the broader market mood turned cautious.
These pressures built up and shaped the mood that followed, creating the backdrop for Bitcoin’s move.
What the Current Market Signal Suggests for Bitcoin’s Next Move
Market psychology also plays a significant role during sharp price swings, and the current setup illustrates how emotions influence trading decisions more quickly than data.
Fear grows rapidly when a key level is broken, and traders often shift from strategy to instinct as they try to avoid losses.
Short-term pressure increases when crowds move in the same direction, and each drop reinforces the belief that more volatility may follow.
This creates a cycle where emotions drive the market more than fundamentals, making every price move feel heavier and every reaction stronger.
So what happens next? The market enters a tense phase where every move around the $98,000 zone carries extra weight.
Traders watch short-term signals closely because sentiment stays fragile and momentum shifts from one session to the next.
Key support test: Traders monitor whether Bitcoin can hold above the next support zone after the sharp drop.
Buyer hesitation: Value buyers reduce activity while waiting for clearer signals of recovery.
Path forward: The market awaits either a stronger floor to form or increased pressure from fear-driven trading.
The market tracks the next support zone closely as traders adjust to a tense setup. Bitcoin jumps between sharp moves, and each shift sparks fast reactions across major exchanges.
Additionally, value buyers, who look for discounted entry points during market weakness, wait for clearer signs of strength.
Therefore, short-term traders react to sudden swings in momentum and adjust positions fast.
The market tracks the next sessions, meaning the upcoming trading periods across major exchanges where price action can shift fast.
These sessions show whether Bitcoin forms a stable base or faces another wave of fear-driven pressure. Only time will tell which direction takes hold.
How does the Extreme Fear Index affect short-term Bitcoin trading strategies?
The Extreme Fear Index affects short-term Bitcoin trading strategies because a high fear reading prompts traders to prioritize risk control over aggressive entries.
What role do liquidity pools play when Bitcoin moves into a fear zone?
Liquidity pools play a crucial role when Bitcoin enters a fear zone, as thin liquidity amplifies the impact of large orders and intensifies price swings.
How do ETF outflows influence Bitcoin sentiment during volatile periods?
ETF outflows influence Bitcoin sentiment during volatile periods because steady withdrawals signal a decline in institutional confidence in the asset.
Why do correlations with tech stocks matter during Bitcoin corrections?
Correlations with tech stocks matter during Bitcoin corrections because overlapping investor groups react to risk in a similar way across both markets.
Disclaimer:
The information provided in this article is for informational purposes only. It is not intended to be, nor should it be construed as, financial advice. We do not make any warranties regarding the completeness, reliability, or accuracy of this information. All investments involve risk, and past performance does not guarantee future results. We recommend consulting a financial advisor before making any investment decisions.
Dr. Lorena Nessi is an award-winning journalist and media technology expert with 15 years of experience in digital culture and communication. Based in Oxfordshire, UK, she combines academic insight with hands-on media practice.
She holds a PhD in Communication, Sociology, and Digital Cultures, and an MA in Globalization, Identity, and Technology.
Lorena has taught at Fairleigh Dickinson University, Nottingham Trent University, and the University of Oxford. She is a former producer for the BBC in London, with additional experience creating television content in Mexico and Japan.
Her research focuses on digital cultures, social media, technology, capitalism, and the societal impact of blockchain innovation.
She has written extensively on digital media and emerging technologies, with her work featured in both academic and media platforms. Her Web3 expertise explores how blockchain technologies shape culture, economics, and decentralized systems.
Outside of work, Lorena enjoys reading science fiction, playing strategic board games, traveling, and chasing adventures that get her heart racing. A perfect day ends with a relaxing spa and a good family meal.


 Easy
Easy