The Bitcoin seller exhaustion indicator highlights when major downward price trends may be nearing an end.
It’s measured using a combination of factors like trading volume, the Relative Strength Index, and specific candlestick patterns.
When the indicator shows exhaustion, it suggests that selling pressure is decreasing, paving the way for potential bullish sentiment.
For accurate predictions, it’s crucial to combine this indicator with other market insights and stay updated with global news.
As traders and investors it is important to understand how on-chain analysis works. One may follow indicators that may offer clues and insights into market behavior before taking trading decisions.
Among the various indicators used to study market sentiment, the Bitcoin seller exhaustion indicator is one that should be considered. Seller exhaustion, points to a situation where sellers have largely sold their holdings, leading to a scarcity of sellers in the market. This often indicates that the downward price trend might be nearing its end.
What Is The Bitcoin Seller Exhaustion Indicator?
The concept of “seller exhaustion” is a familiar one in trading and technical analysis. The idea refers to a point where a predominant downward trend (often driven by sellers) is about to reach its end due to the majority of sellers having already exited their positions.
How Is The Bitcoin Seller Exhaustion Measured?
When sellers exit the market it can be difficult to measure. By analyzing a combination of declining selling pressure via volume analysis, momentum indicators suggesting oversold conditions such as the Relative Strength Index, and discrepancies between price movement and momentum in the form of bullish divergences, and visual price patterns indicative of potential reversals using candlestick patterns.
It is possible to use these signals to measure the likelihood that sellers have mostly exited the market and a reversal towards an uptrend potentially becomes more likely.
How The Bitcoin Seller Exhaustion Indicator Is Calculated
The Bitcoin seller exhaustion indicator is calculated as follows:
Volume analysis
One of the most straightforward indications of exhaustion is a decline in trading volume. If the price of Bitcoin continues to drop but on decreasing volume, it can suggest that the selling pressure is weakening.
Relative strength index (RSI)
An RSI value below 30 is typically considered oversold, suggesting that the asset (in this case, Bitcoin) might be undervalued and due for a price correction or reversal.
RSI Overbought And Oversold Territory | Source: Investors Underground
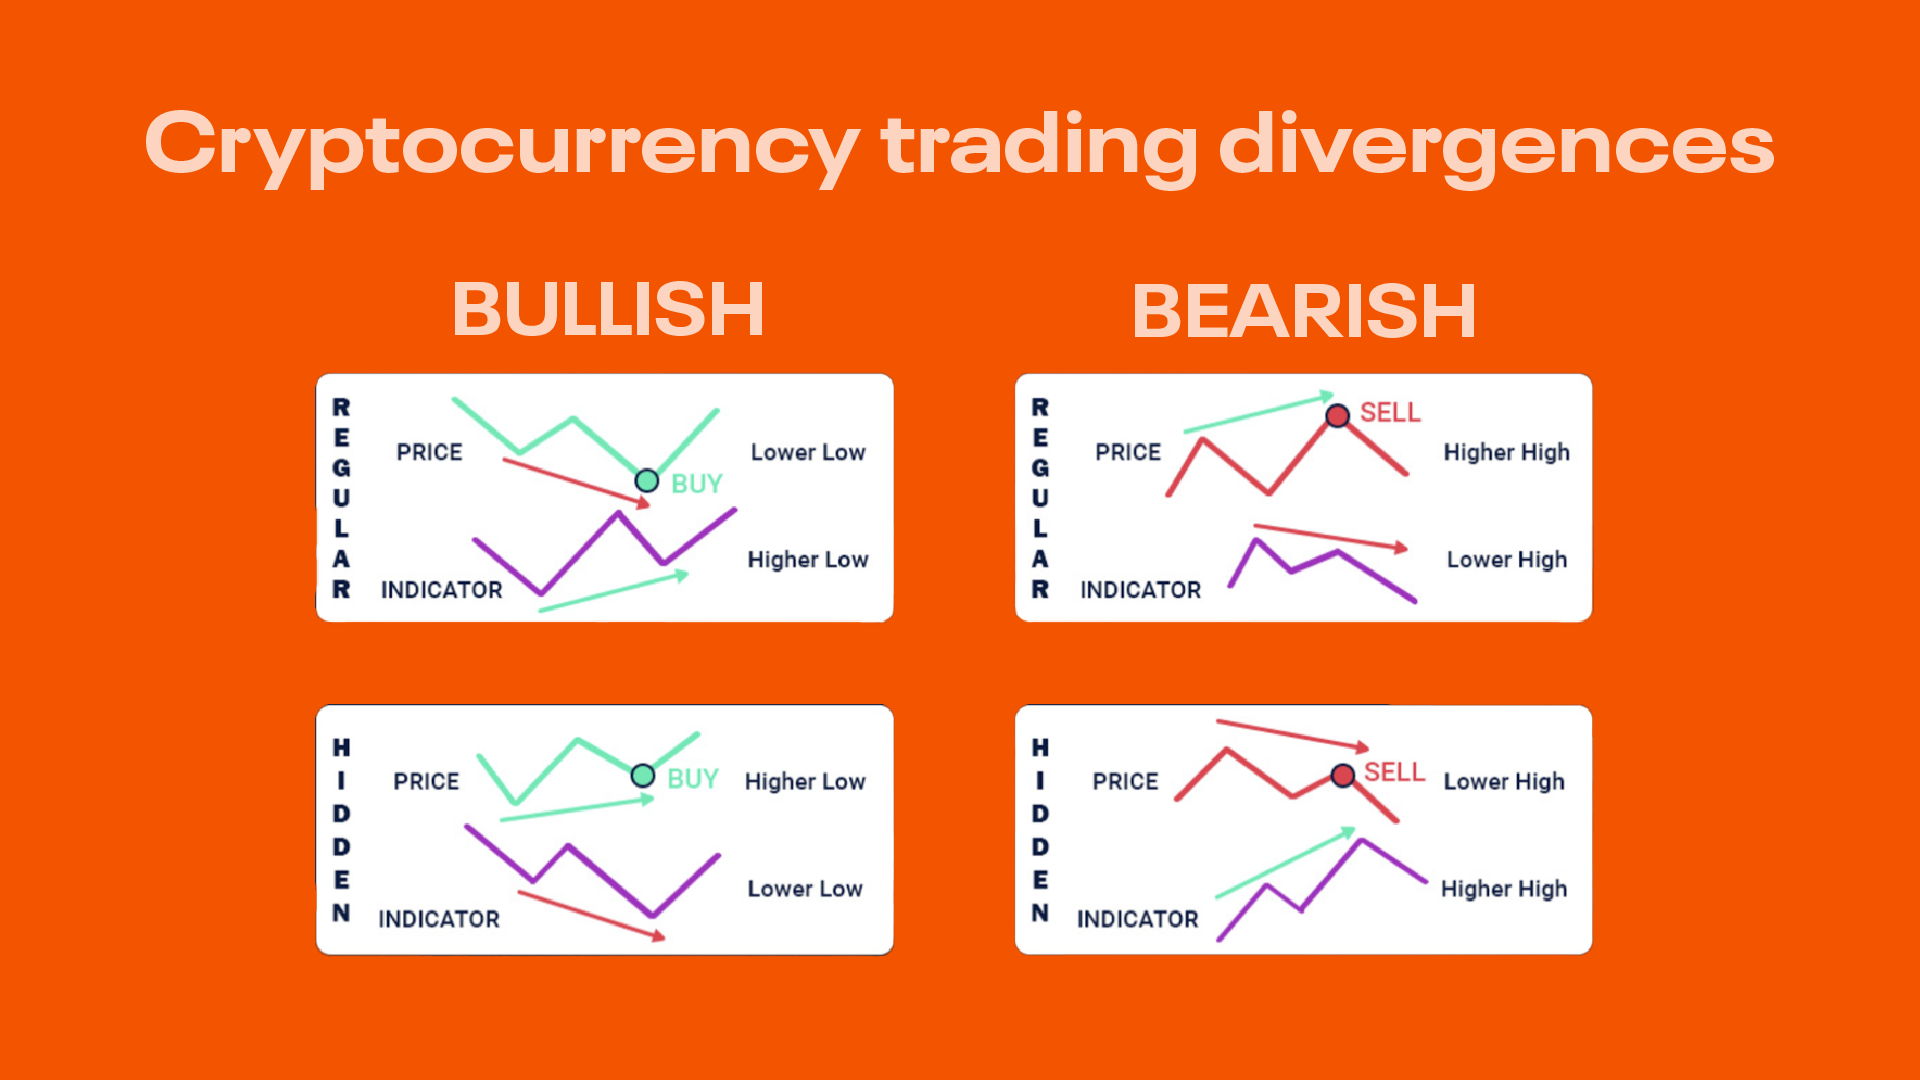
Bullish divergence
This is a potent signal of seller exhaustion. Bullish divergence occurs when the price of Bitcoin creates a new low, but momentum indicators like the RSI do not follow suit, suggesting a weakening momentum to the downside.
Trading Divergences | Bullish And Bearish
Candlestick patterns
Certain candlestick patterns can indicate seller exhaustion and potential price reversals. These include:
Bullish hammer: A candle with a small body and a long lower wick, suggesting that sellers drove the price down, but buyers were able to push it back up significantly by the close.
Bullish Hammer Candlestick
Bullish Engulfing: A two-candle pattern where a small bearish (red) candle is followed by a larger bullish (green) candle that “engulfs” the previous one, indicating strong buying interest.
Bullish Engulfing Patterns
Where Can I Assess Bitcoin Seller Exhaustion Indicator?
Glassnode offers a comprehensive and detailed charting platform. Whether you’re searching for insights on seller exhaustion or any other nuanced metric, Glassnode provides a user-friendly interface and rich data sets to aid your analysis.
By visiting their platform, you can effortlessly access these charts and stay updated on Bitcoin’s ever-evolving landscape.
How Does The Bitcoin Seller Exhaustion Indicator Work?
Whenever Bitcoin’s seller exhaustion touches the shaded area at 0.01, marked as a green shaded circle below, signifies that sellers in the market are running out of steam. Such signals often precede a notable appreciation in Bitcoin’s price. Currently, based on this trusted exhaustion metric, Bitcoin seems poised for an upside breakout.
Bitcoin Seller Exhaustion Indicator
Following such instances, Bitcoin has shown this strong inclination towards price appreciation because of the behavior attributed to various factors:
Reduced selling pressure: With a majority of sellers potentially out of the market, the selling pressure significantly reduces. This inherently creates an environment for price growth.
Shift in markets: Recognizing this exhaustion, many traders and investors might interpret it as a buying opportunity, further driving demand and price up.
External factors: Beyond the technical aspects, news, global events, and macroeconomic factors often play a supportive role, pushing the narrative of a bullish Bitcoin.
Benefits of Using the Bitcoin Seller Exhaustion Indicator
Furthermore, the broader market sentiment, fueled by positive news around cryptocurrency adoption and favorable regulatory stances in several countries, aligns with this technical outlook. As history has often shown, when fundamentals and technicals converge in their narrative, the market move can be significant.
While the seller exhaustion isn’t entirely new, its application in the crypto industry provides unique insights, especially for an asset as volatile as Bitcoin. Some notable benefits of this indicator include:
Insights Into Potential Market Turnaround Points
Anticipate reversals: Recognizing seller exhaustion can act as a precursor to market reversals. When sellers run out of momentum, it often leads to a shift from a bearish to a bullish trend, or at the very least, a consolidation phase.
Reduced risk: Understanding potential turnaround points can help traders mitigate risks. By identifying zones where the selling pressure might be tapering off, traders can make informed decisions about entry and exit points.
Predicting Possible Price Rallies
Bullish momentum: Historically, after periods of pronounced seller exhaustion, assets, like Bitcoin, have witnessed bullish runs. Recognizing these early signs can position traders to capitalize on potential rallies.
Strategic positioning: For long-term investors, these signals can serve as optimal points for increasing their Bitcoin holdings, anticipating a future appreciation.
Enhancing Trading Strategies By Understanding When Sellers Are Likely Exhausted:
Refined decision making: Adding the seller exhaustion metric to one’s trading toolkit allows for a more holistic view of the market. It complements other indicators, ensuring decisions aren’t based on singular metrics.
Increased profit potential: Recognizing the waning momentum of sellers provides an edge. Traders can potentially maximize profits by buying before the larger market catches onto the shift in momentum.
Portfolio protection: Conversely, if one is already invested and notices signs of seller exhaustion, it might be a cue to hold onto their assets expecting a potential uptrend, rather than selling prematurely.
Considerations When Using the Bitcoin Seller Exhaustion Indicator
When using tools like the Bitcoin seller exhaustion indicator or any other technical analysis tool, there are certain mistakes that traders commonly fall prey to. Let’s explore some of these common errors and how best to avoid them:
Relying Solely on the Indicator Without Considering Other Market Variables
Holistic Approach: No single indicator can provide a complete picture of the market. It’s essential to use a combination of indicators to get a comprehensive view.
External Factors: Always be aware of global news, regulatory changes, macroeconomic factors, and other external events that can significantly influence asset prices.
Misinterpreting The Seller Exhaustion Indicator Signal Time Periods
Noise vs. Signal: Markets are inherently volatile, and short-term price fluctuations are common. Differentiating between ‘noise’ (short-term, inconsequential movements) and ‘signal’ (meaningful, trend-indicative movements) is crucial.
Timeframe Consideration: Ensure that the timeframe you’re analyzing aligns with your trading goals. A daily chart might show a different picture than a weekly or monthly chart. Being swayed by short-term fluctuations when you’re a long-term investor can lead to misguided decisions.
Conclusion
A well-armed arsenal of analytical tools becomes not just beneficial but essential for investors and traders. Amongst the myriad of indicators, the Bitcoin seller exhaustion indicator distinguishes itself, illuminating moments when the market might be on the brink of a shift. Its true value, however, lies in its conjunction with other market measurements, providing a navigational compass in the stormy seas of Bitcoin’s volatility. For those looking to enrich their analytical on-chain analysis, Glassnode emerges as a tool for traders to use to navigate the ever-shifting crypto market.
“In the midst of chaos, there is also opportunity.” – Sun Tzu
FAQs
What is the Bitcoin Seller Exhaustion Indicator?
It is a chart that identifies when a predominant downward Bitcoin price trend might end, indicating when most sellers have likely exited their positions.
How is the Bitcoin Seller Exhaustion Measured?
By analyzing declining selling pressure, using volume analysis, the Relative Strength Index (RSI), bullish divergences, and specific candlestick patterns signaling potential reversals.
How Does The Bitcoin Seller Exhaustion Indicator Work?
When the indicator reaches certain levels, it suggests sellers are tapering off, often preceding a Bitcoin price increase due to reduced selling pressure and changing market sentiment.
What Should Be Considered When Using the Indicator?
It’s important not to solely rely on this indicator. Consider combining with other market indicators, stay aware of global news, and differentiate between short-term fluctuations and long-term trends.
Andrew Kamsky is a chart analyst and writer with a background in economics and ACCA certification. He has held roles at a Big Four firm, a fintech bank, and a listed bank specializing in currency hedging. His work explores Bitcoin, macro trends, and market structure. Outside finance, he's passionate about music, travel, and neon design.


 Easy
Easy