Dow Skids as Stock Pumpers Fail to Duct-Tape Over 3M’s Earnings Mayhem

| Source: Andrew Burton / Getty Images / AFP
By CCN.com: The Dow lagged the broader U.S. stock market on Thursday after industrial conglomerate 3M Co (MMM) reported disappointing quarterly financial results, underscoring a dismal outlook facing the global economy.
Dow Lags Its Stock Market Peers
After falling 187 points, the Dow Jones Industrial Average would pare losses to settle down 134.97 points, or 0.5%, at 26,462.08. The blue-chip index opened sharply lower, reflecting a volatile pre-market for Dow futures.

The broad S&P 500 Index of large-cap stocks reversed gains to settle at 2,926.17, where it was down less than 0.1%. Five of 11 primary sectors reported declines, with industrials shouldering the heaviest losses.
Upbeat quarterly results from technology companies like Facebook Inc. (FB) and Microsoft Corp (MSFT) propelled the Nasdaq Composite Index higher. The technology bellwether climbed 0.2% to 8,118.68 after previously hitting an intraday high.
3M Co’s Brutal Quarter Pounds DJIA

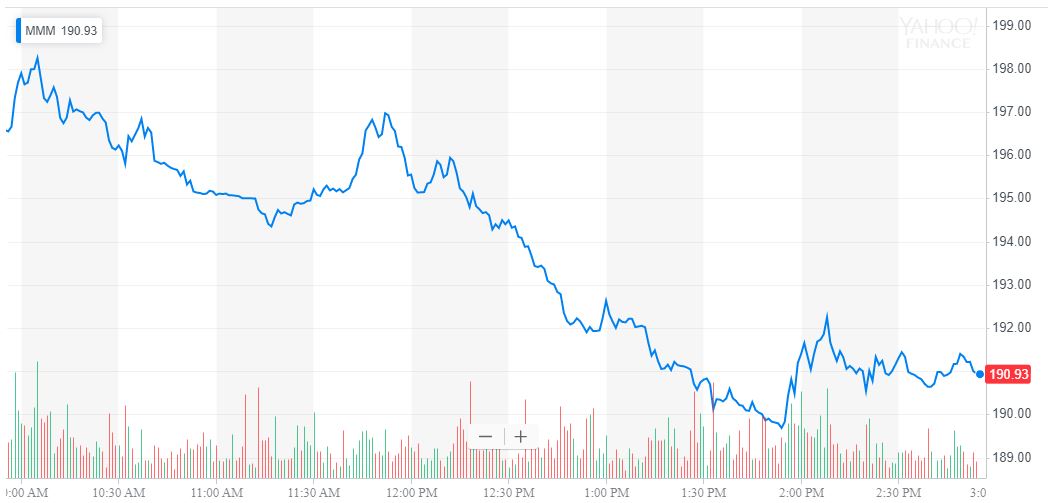
Shares of Dow blue-chip 3M Co plunged more than 13% on Thursday after the industrial giant reported dismal quarterly results, prompting it to slash yearly guidance and lay off 2,000 workers worldwide.
The Minnesota-based company reported per-share earnings of $2.23 for the first quarter on revenue of $7.863 billion. Analysts in a Refinitiv survey forecast an EPS of $2.49 on $8.025 billion in sales. Slower sales in the Asia-Pacific region and a litigation-related pretax charge of $548 million were the main factors behind the slowdown.

As a result of the weak start to 2019, 3M said it expects adjusted full-year earnings to be between $9.25 and $9.75 per share, down sharply from a prior range of $10.45 to $10.90 per share.
Elsewhere on the earnings front, Facebook Inc. (FB) reported much better than expected profits and revenues in the first quarter thanks to the success of its Stories feature. Meanwhile, Microsoft Corp (MSFT) crossed the $1 trillion value mark after posting market-beating financial results.
Read the Hacked.com exclusive: Facebook’s Massive Turnaround: Is Now the Time to Buy FB Stock?
Click here for a real-time Dow Jones Industrial Average price chart.