Zcash short-term momentum fades as sellers regain control.
A break below $420 could push ZEC’s price toward $350.
The altcoin needs to reclaim $450 to keep $500 breakout possible.
Zcash (ZEC) is approaching a critical juncture as price action hovers just below the $500 psychological level.
Following a recent bounce, the momentum around the coin has begun to cool.
This has left the market divided between expectations of continuation and the risk of a deeper correction.
With volatility compressing and indicators sending mixed signals, ZEC’s current structure reflects a fragile balance between accumulation and distribution.
While higher-timeframe patterns hint at potential continuation, short-term momentum suggests caution, positioning the $500 region as both an opportunity for bulls and a risk zone if support fails.
So what comes next for Zcash’s price?
Zcash Short-Term Indicators Signal Exhaustion
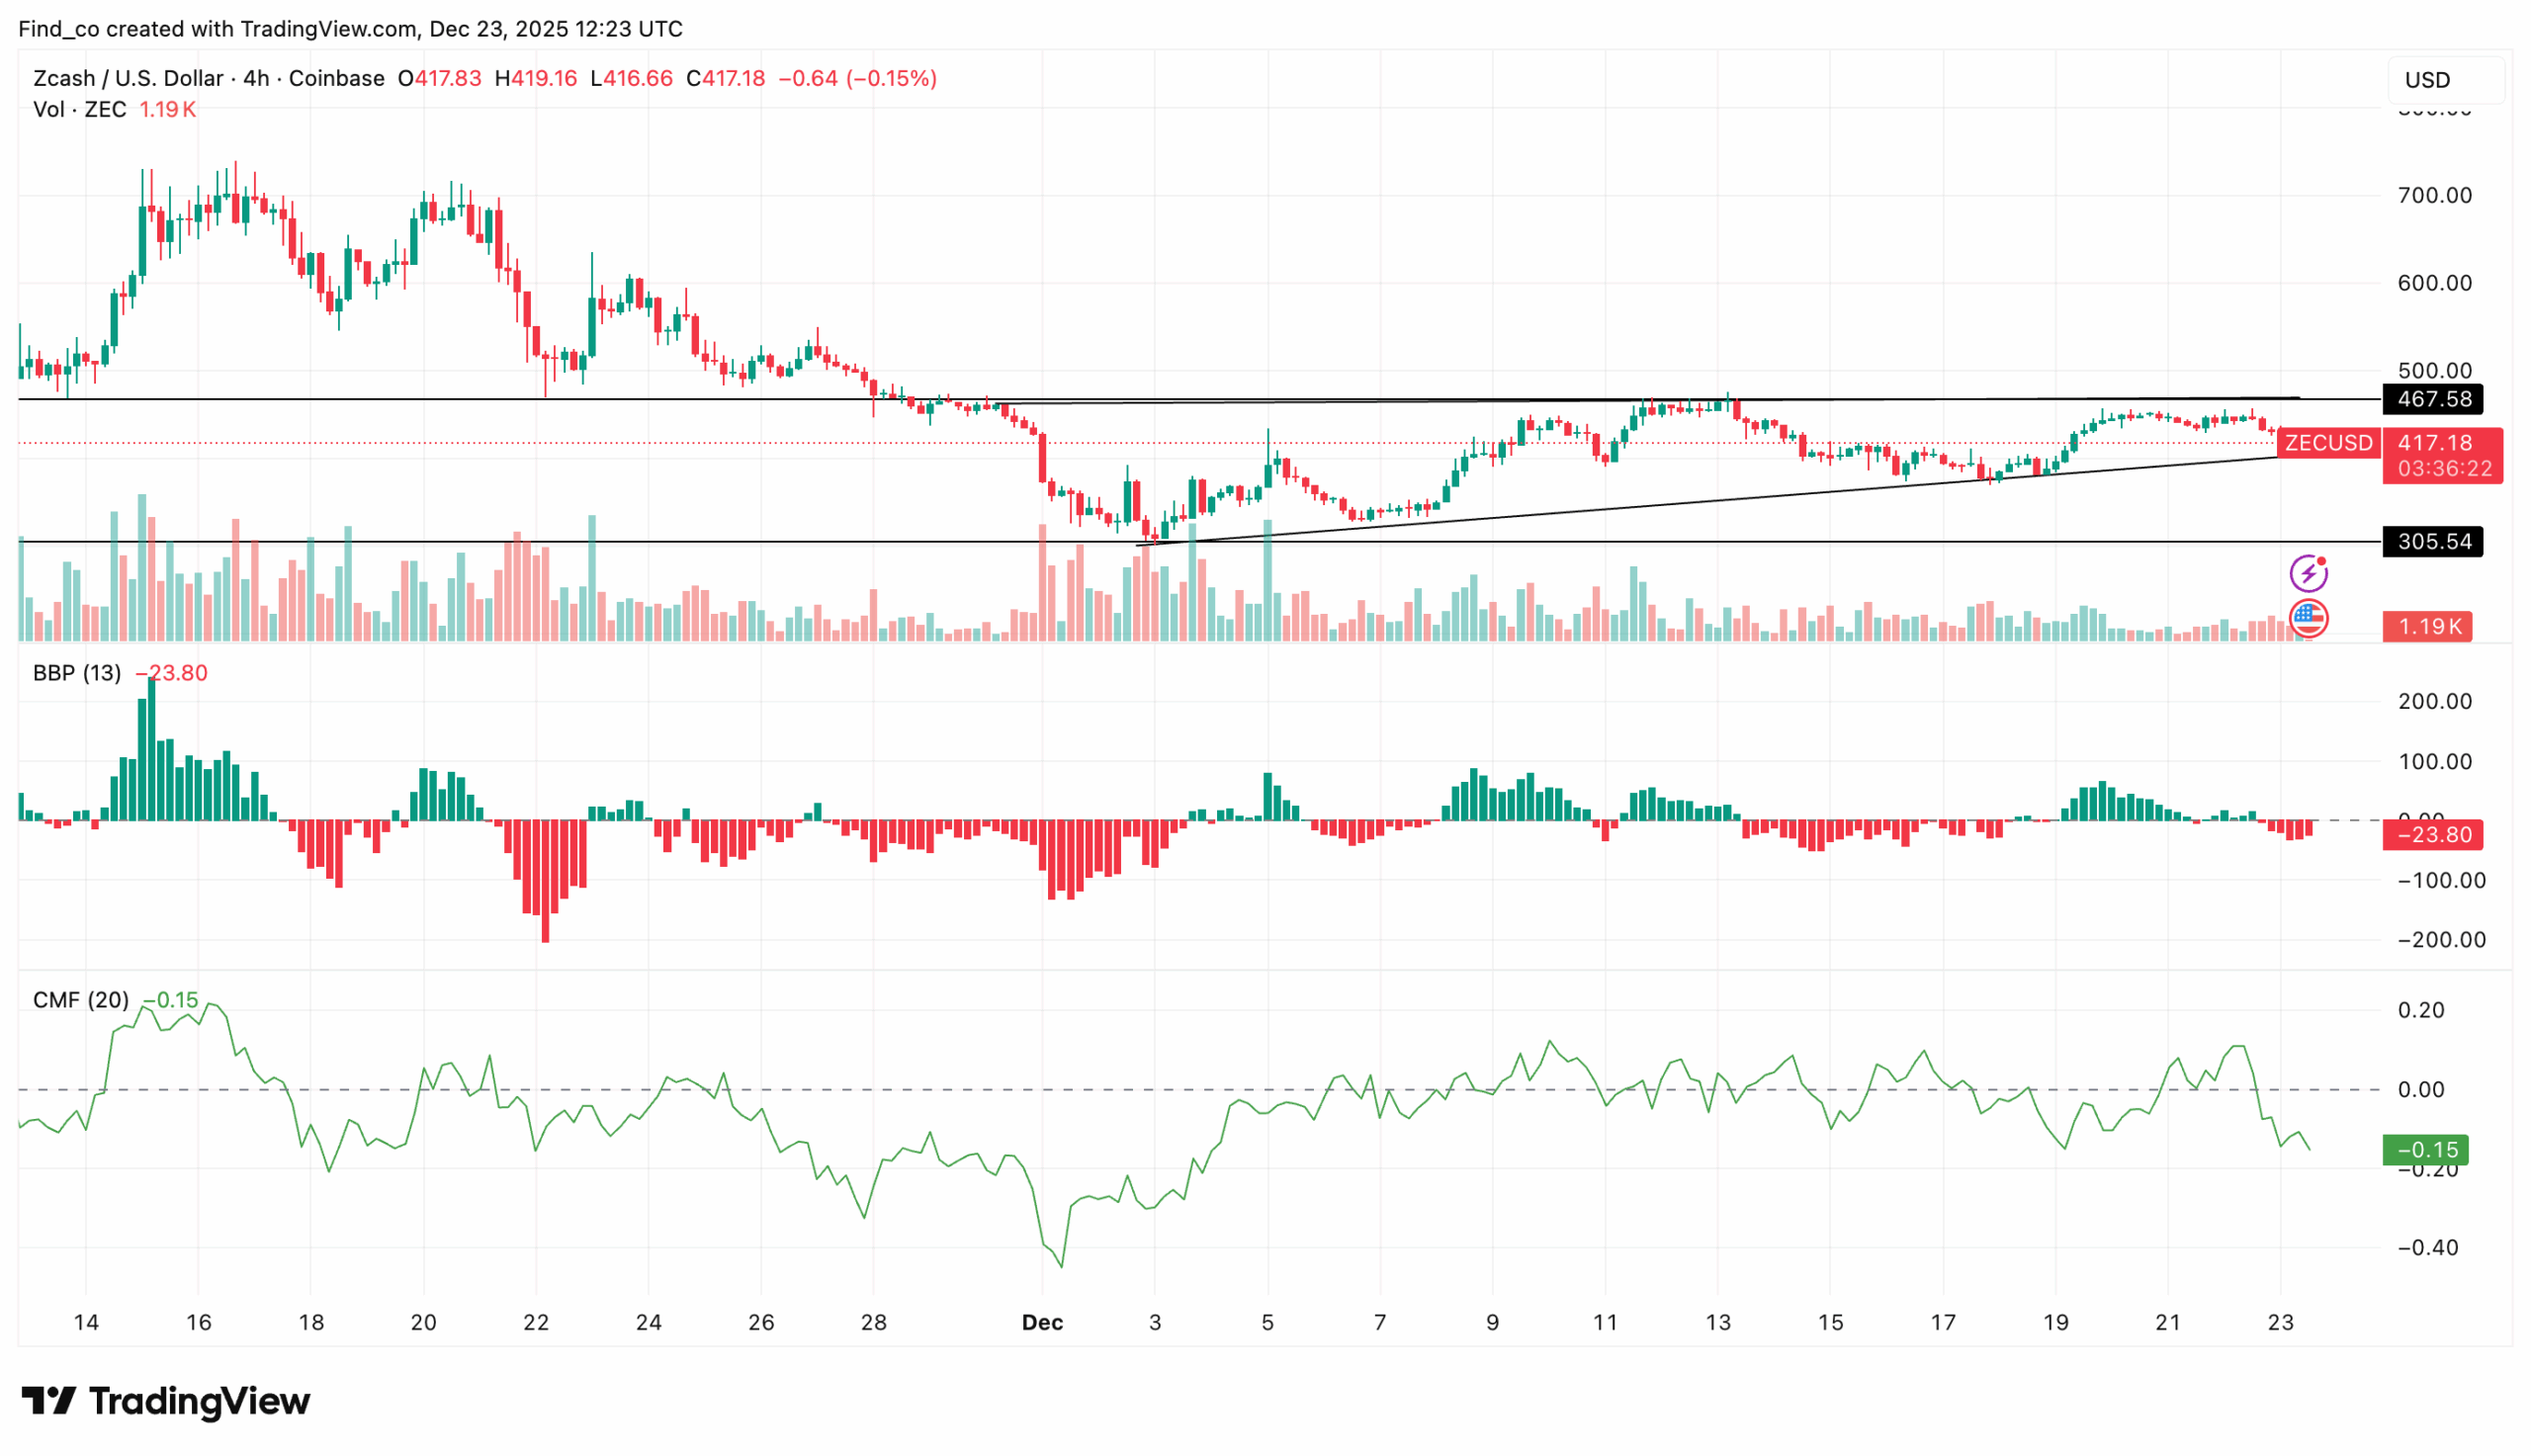
On the 4-hour chart, signs of fatigue are becoming more pronounced. The Bull Bear Power (BBP) indicator remains firmly below the zero line, printing expanding red histogram bars around –32.77.
This reflects persistent seller dominance and suggests that bulls have yet to regain control despite recent attempts at stabilization.
Get These Top Crypto Casino Offers Now!
Sponsored
Disclosure
We sometimes use affiliate links in our content, when clicking on those we might receive a commission at no extra cost to you. By using this website you agree to our terms and conditions and privacy policy.
The Chaikin Money Flow (CMF) reinforces this cautionary outlook. Currently at –0.15, the CMF remains in negative territory, indicating that capital outflows continue to outweigh inflows.
This suggests that recent upside attempts lack strong volume backing and are more vulnerable to distribution than follow-through buying.
From a structural perspective, immediate support sits in the $420 to $400 zone.
Such a move would confirm that the current consolidation is resolving lower rather than forming a base for continuation.
On-Chain Data Confirms Outflows
Beyond price action, on-chain data aligns with the bearish short-term narrative.
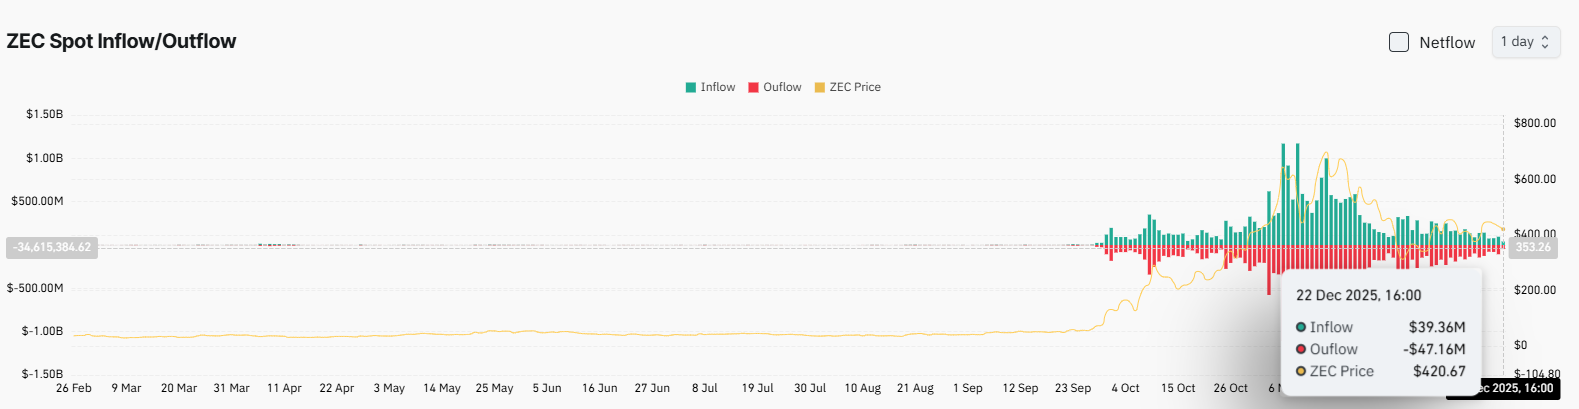
At press time, ZEC has recorded more than $47.16 million in spot outflows, according to Coinglass, signaling that capital is actively exiting the market.
Sustained outflows of this magnitude often reflect risk reduction rather than accumulation, increasing the likelihood of further consolidation or downside unless sentiment shifts materially.
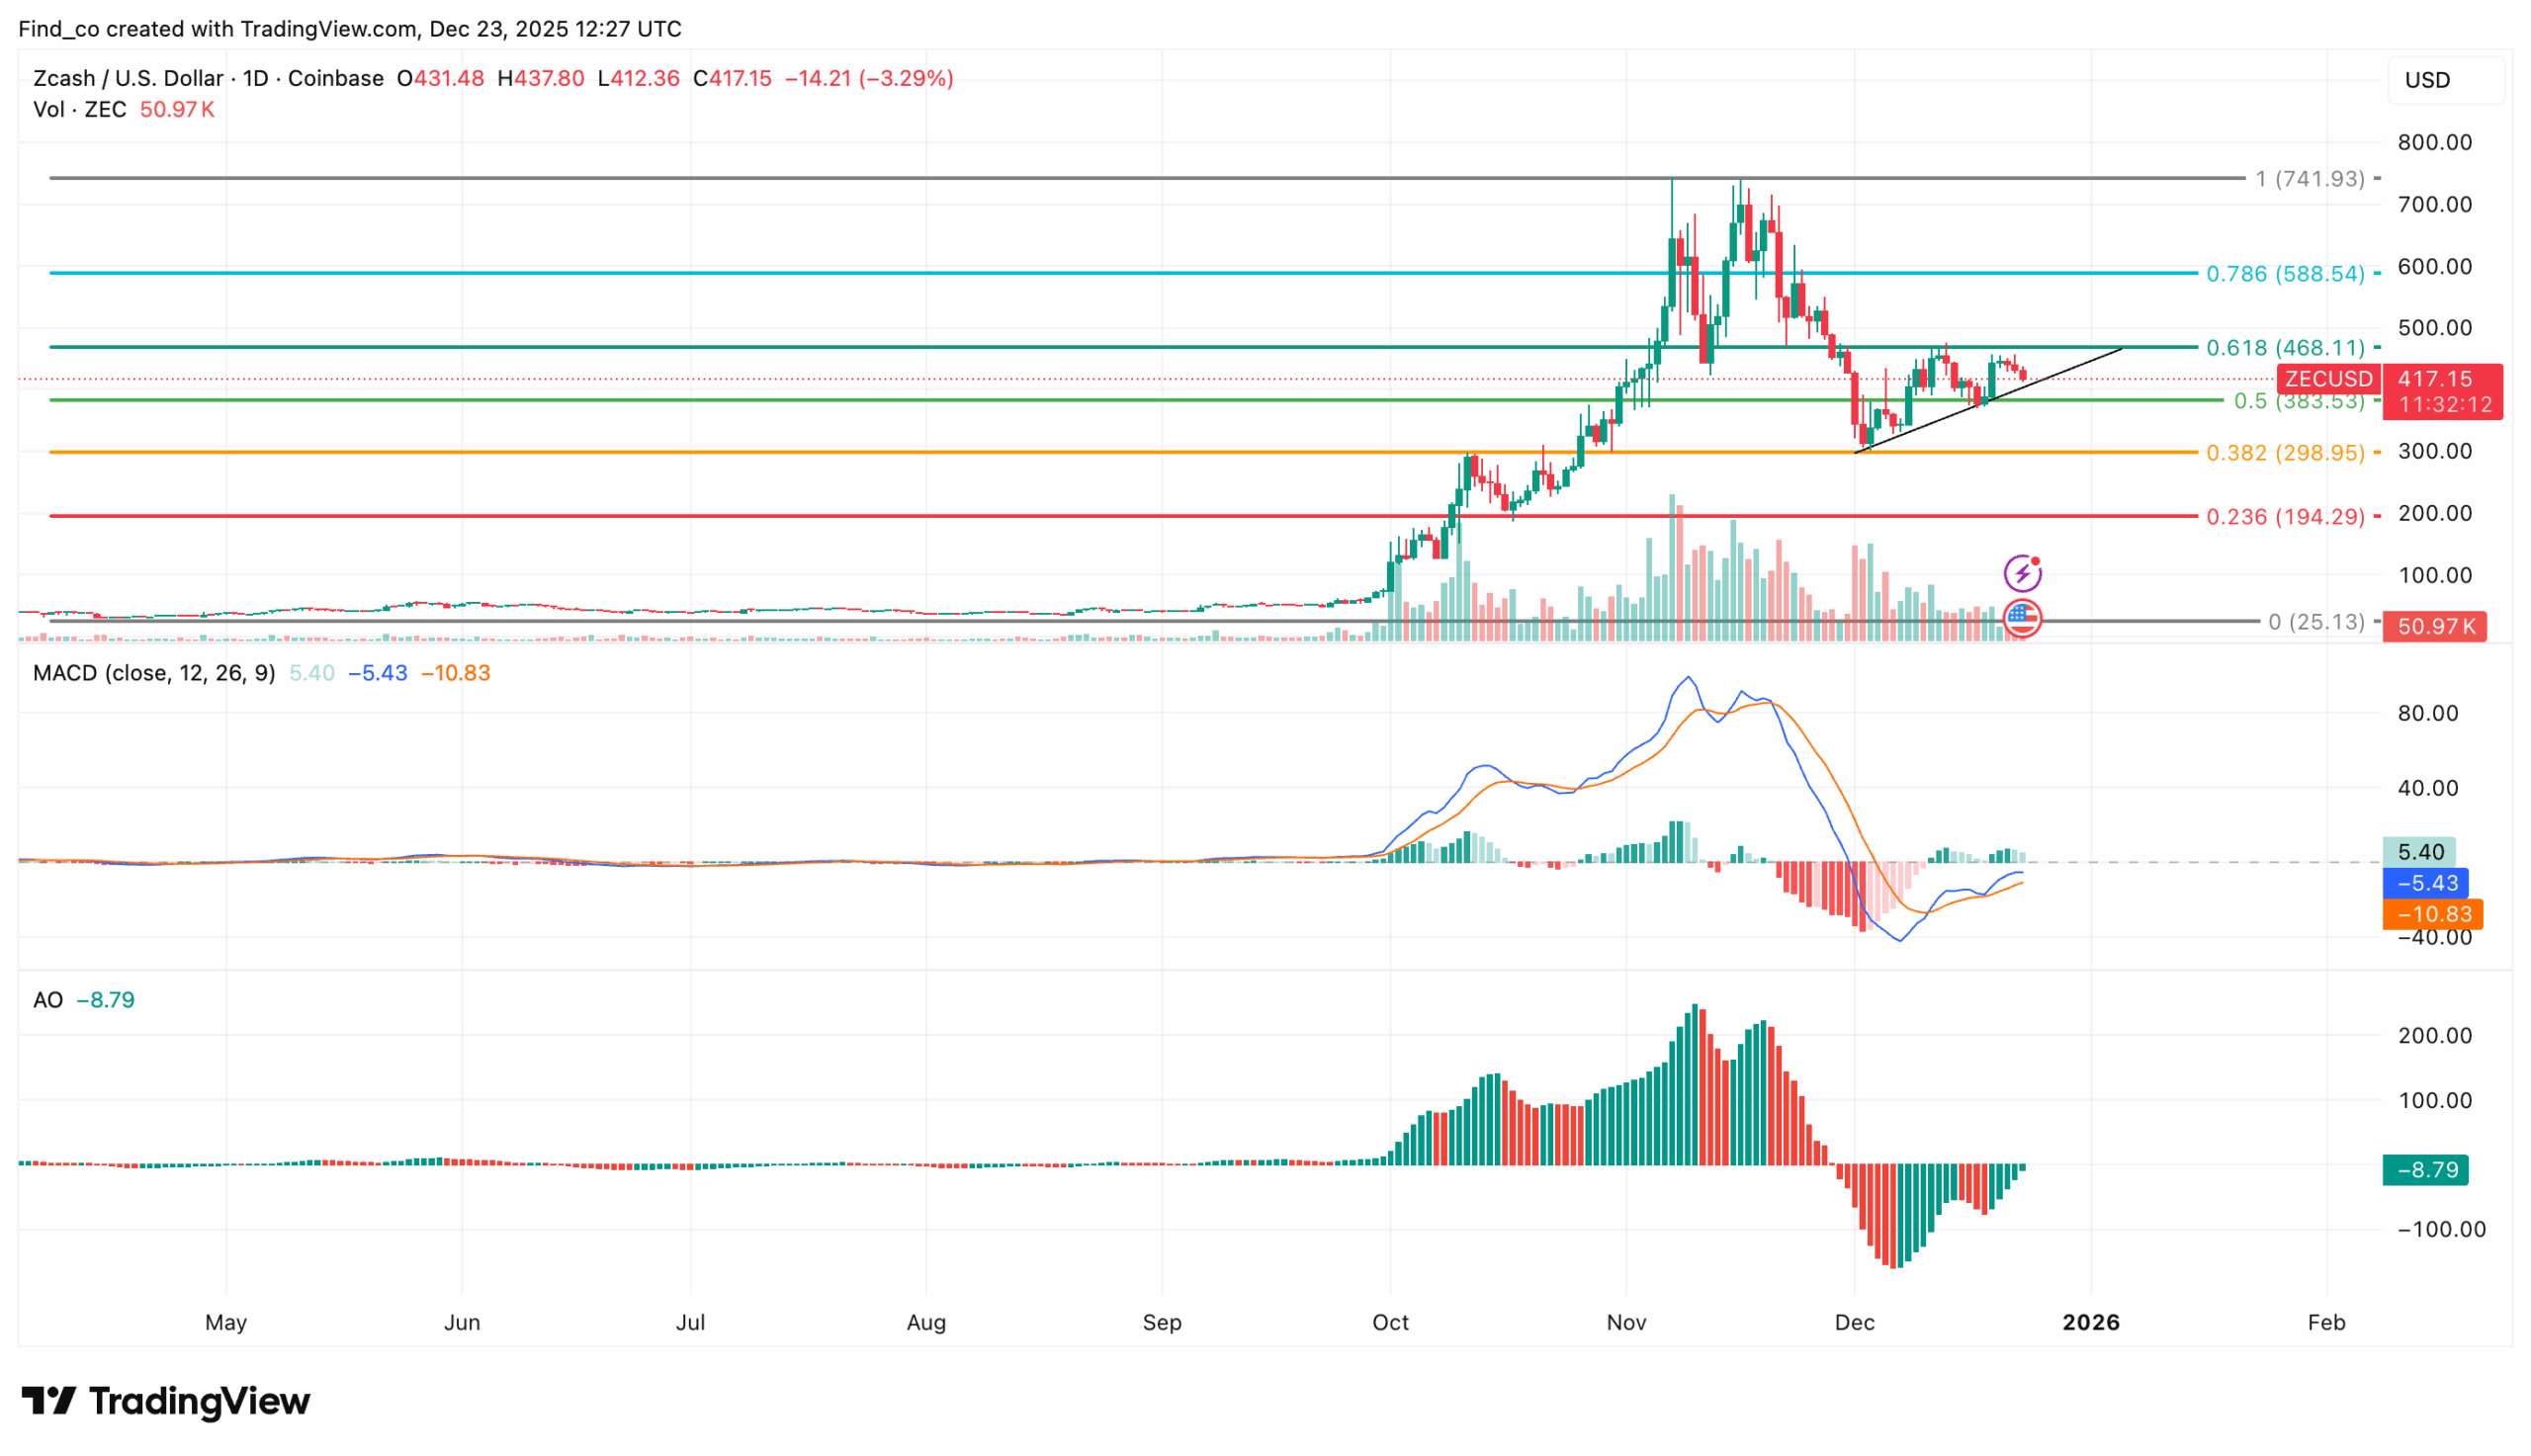
Despite short-term weakness, the daily chart presents a more balanced picture. Zcash’s price appears to be forming an ascending triangle.
Momentum indicators provide tentative support.
The MACD remains in positive territory, with the 12-day EMA positioned above the 26-day EMA, although fading green histogram bars suggest that momentum is still fragile.
The Awesome Oscillator (AO) also prints consecutive green bars while remaining below zero, hinting at a gradual momentum shift rather than a decisive reversal.
At the time of writing, ZEC trades around $417.25, positioned between the 0.5 and 0.618 Fibonacci retracement levels.
Conversely, a breakdown below $383.53 would weaken the structure and increase the probability of further downside.
Analyst Outlook: Breakdown First, Breakout Later?
Market observers remain cautious. Crypto analyst Ardi suggested that ZEC may need to retrace further before any sustainable breakout occurs.
According to Ardi, the loss of support near $430 places ZEC on its final local support for the current breakout attempt.
“ZEC lost another local support level at $430 and is currently sitting on the last zone of support for this local breakout attempt. If the trendline support breaks, I’d expect a move back down to the critical support range, where the Double Top formation would likely complete.
Additionally, he noted that this does not mean ZEC’s price won’t recover.
In that scenario, I’d still look for plays to short the retest of support. If price recovers to around $450, it would preserve the ascending triangle pattern and greatly increase the odds of a breakout,” He pointed out.
Disclaimer:
The information provided in this article is for informational purposes only. It is not intended to be, nor should it be construed as, financial advice. We do not make any warranties regarding the completeness, reliability, or accuracy of this information. All investments involve risk, and past performance does not guarantee future results. We recommend consulting a financial advisor before making any investment decisions.
Victor Olanrewaju is a crypto analyst and reporter at CCN with deep roots in on-chain research and technical analysis. His crypto journey began in 2017, but it was the 2020 Uniswap airdrop that sparked a full-time pivot into the space.
With a foundation in copywriting, Victor honed his craft creating high-converting content for leading crypto brokers — most notably an XRP price prediction that ranked #1 on Google during the 2021 bull run.
He later joined AMBCrypto in 2022, where he combined storytelling with technical and on-chain analysis to cover key market narratives.
In 2024, he expanded his expertise at BeInCrypto, collaborating with analysts and using tools like Glassnode, Santiment, and IntoTheBlock to break down Bitcoin and altcoin trends.
At CCN, Victor covers the top cryptocurrencies, memecoins, macro shifts, blending real-time insights with deep-dive metrics.
He holds a Bachelor’s degree in Physics from the University of Ibadan, equipping him to simplify complex data for a wide audience. Follow his work or connect on LinkedIn or X.