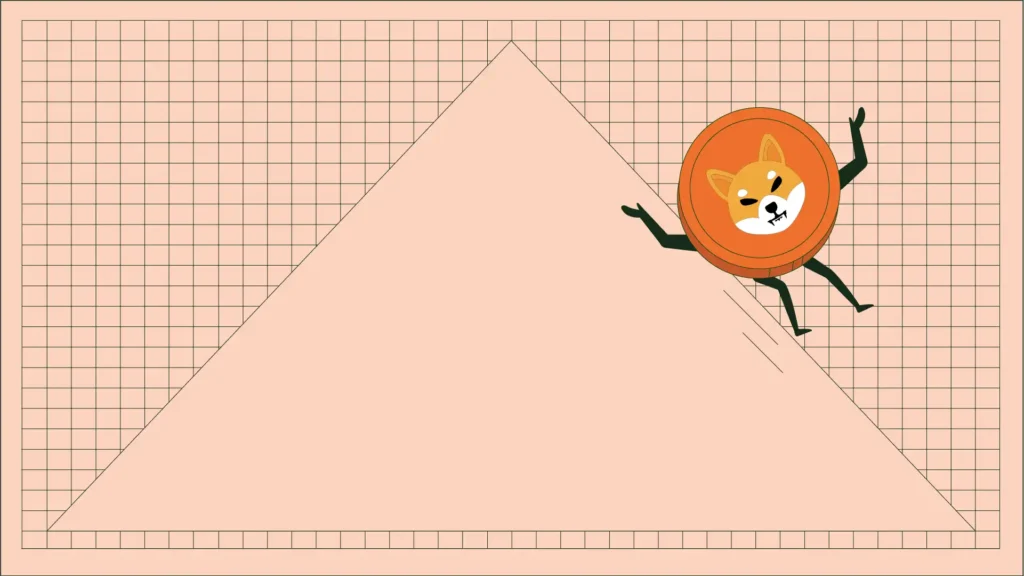
Shiba Inu (SHIB) is showing growing signs of structural weakness as its prolonged downtrend deepens.
While parts of the memecoin market have seen brief relief rallies, the SHIB crypto has largely failed to participate.
Instead, capital continues to rotate out of the token. At press time, SHIB trades at around $0.0000078, down roughly 66% year-to-date.
The extended drawdown reflects fading speculative interest and rising selling pressure, placing SHIB among the weaker performers in the memecoin segment as bearish momentum remains dominant.
So what’s next for the cryptocurrency?
Shiba Inu Fails to Halt Selling Pressure
On the 4-hour chart, Bull Bear Power (BBP) confirms a bearish structure. The indicator remains below the zero line, printing consecutive red histogram bars, evidence that sellers continue to dictate momentum.
The absence of any meaningful bullish crossover suggests that downside pressure has yet to ease significantly.
The Money Flow Index (MFI) reinforces this view. Currently at 33.76, the indicator remains well below the neutral 50 level, signaling weak capital inflows and ongoing distribution.
While the MFI has rebounded modestly from deeper oversold readings, it has yet to reclaim bullish territory, indicating limited buyer conviction.
From a structural standpoint, SHIB’s price continues to trade below its former support near $0.0000075 — a level that has now flipped into resistance.
Repeated rejections in this zone highlight persistent overhead supply and suggest that upside attempts remain corrective rather than trend-changing.
If selling pressure persists, the SHIB crypto risks sliding toward the $0.0000066 to $0.0000070 support range.
A break below this area would expose the token to further downside and extend the broader bearish structure.
SHIB Price Analysis: No Clear Recovery
On the daily timeframe, SHIB continues to trade within a descending channel, characterized by lower highs and lower lows—a classic signal of a sustained downtrend.
Furthermore, short-term rebounds have consistently stalled near the upper boundary of the channel, reinforcing bearish control.
Adding to the pressure, the 20-day Exponential Moving Average (EMA) remains positioned above price, acting as dynamic resistance.
Each attempt to reclaim this level has been met with renewed selling, keeping SHIB capped and limiting upside follow-through.
Momentum indicators align with this assessment. The Awesome Oscillator (AO) remains firmly in negative territory, printing repeated red histogram bars.
This configuration signals that bearish momentum remains intact, with little evidence that buyers are gaining traction.
Disclaimer:
The information provided in this article is for informational purposes only. It is not intended to be, nor should it be construed as, financial advice. We do not make any warranties regarding the completeness, reliability, or accuracy of this information. All investments involve risk, and past performance does not guarantee future results. We recommend consulting a financial advisor before making any investment decisions.
Victor Olanrewaju is a crypto analyst and reporter at CCN with deep roots in on-chain research and technical analysis. His crypto journey began in 2017, but it was the 2020 Uniswap airdrop that sparked a full-time pivot into the space.
With a foundation in copywriting, Victor honed his craft creating high-converting content for leading crypto brokers — most notably an XRP price prediction that ranked #1 on Google during the 2021 bull run.
He later joined AMBCrypto in 2022, where he combined storytelling with technical and on-chain analysis to cover key market narratives.
In 2024, he expanded his expertise at BeInCrypto, collaborating with analysts and using tools like Glassnode, Santiment, and IntoTheBlock to break down Bitcoin and altcoin trends.
At CCN, Victor covers the top cryptocurrencies, memecoins, macro shifts, blending real-time insights with deep-dive metrics.
He holds a Bachelor’s degree in Physics from the University of Ibadan, equipping him to simplify complex data for a wide audience. Follow his work or connect on LinkedIn or X.