Will ZEC Break Down Below Support? | Credit: Hameem Sarwar
Share
Key Takeaways
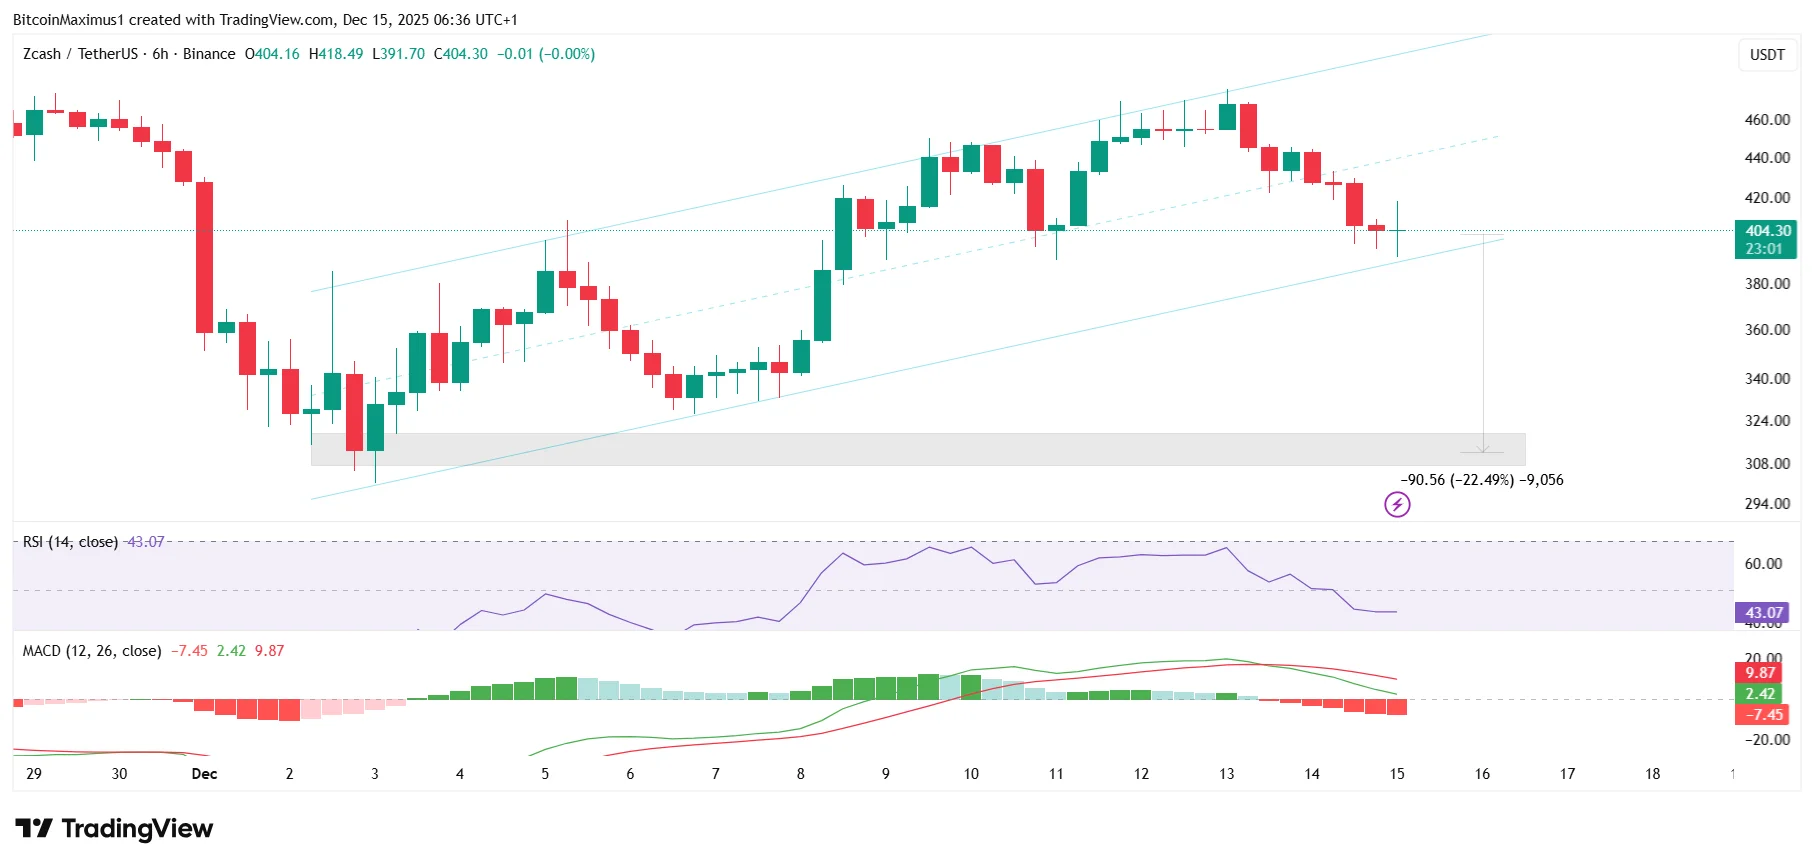
Zcash (ZEC) has nearly broken down from a short-term ascending parallel channel.
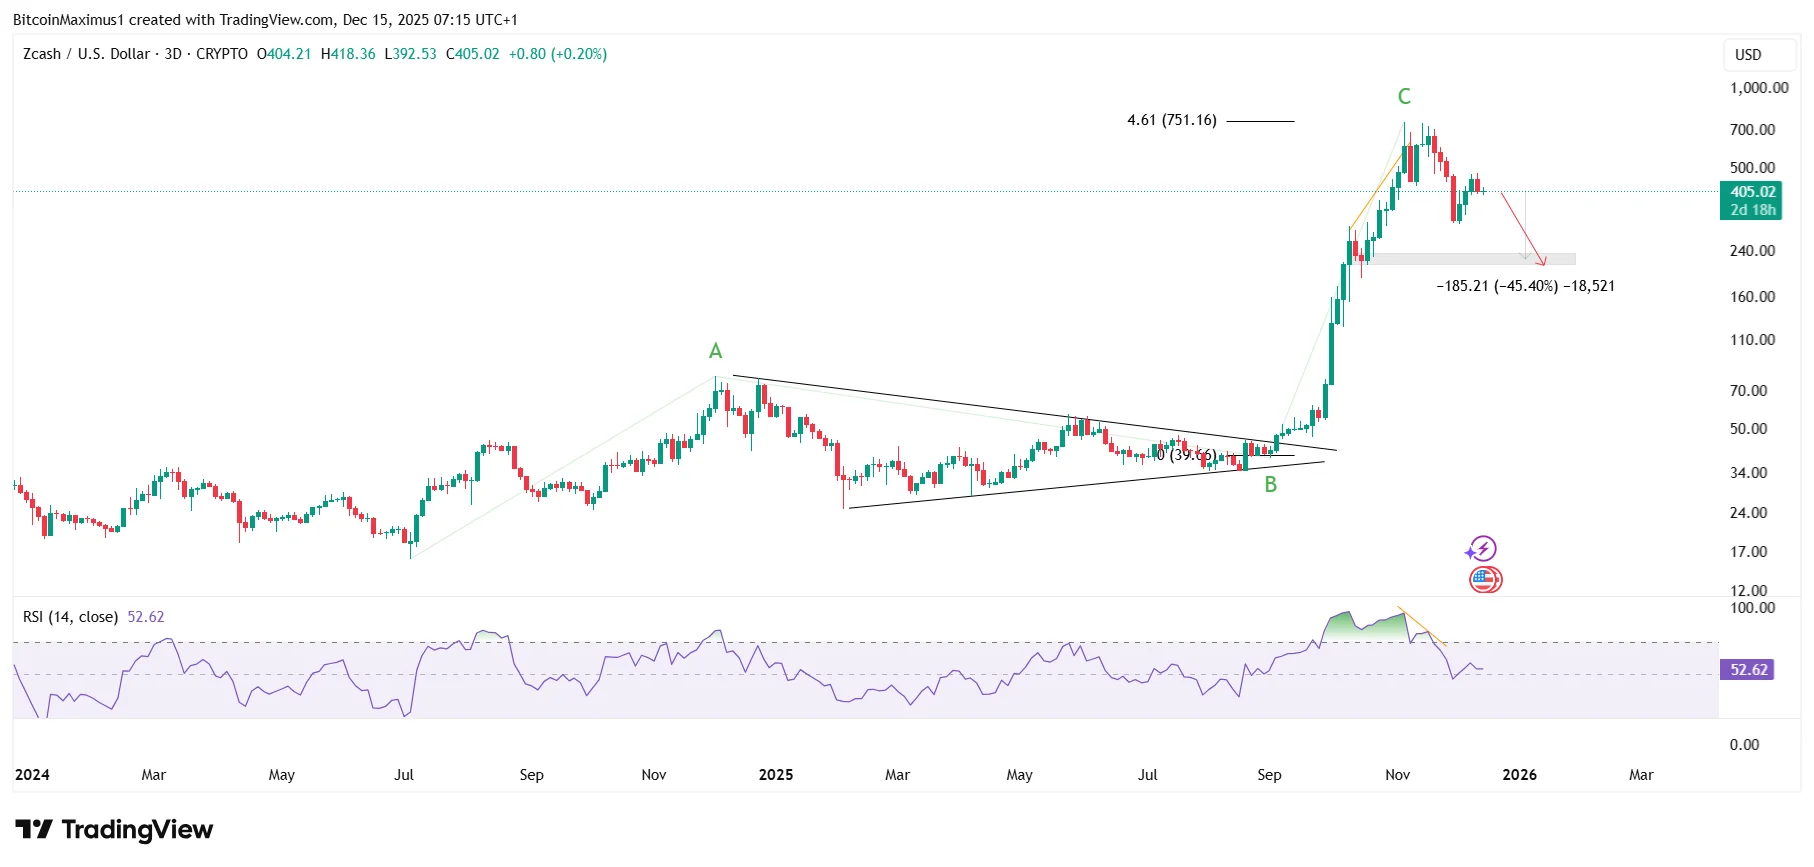
The ZEC price previously broke down from a long-term parallel channel.
Will history repeat, and if so, how much lower will the Zcash price plummet?
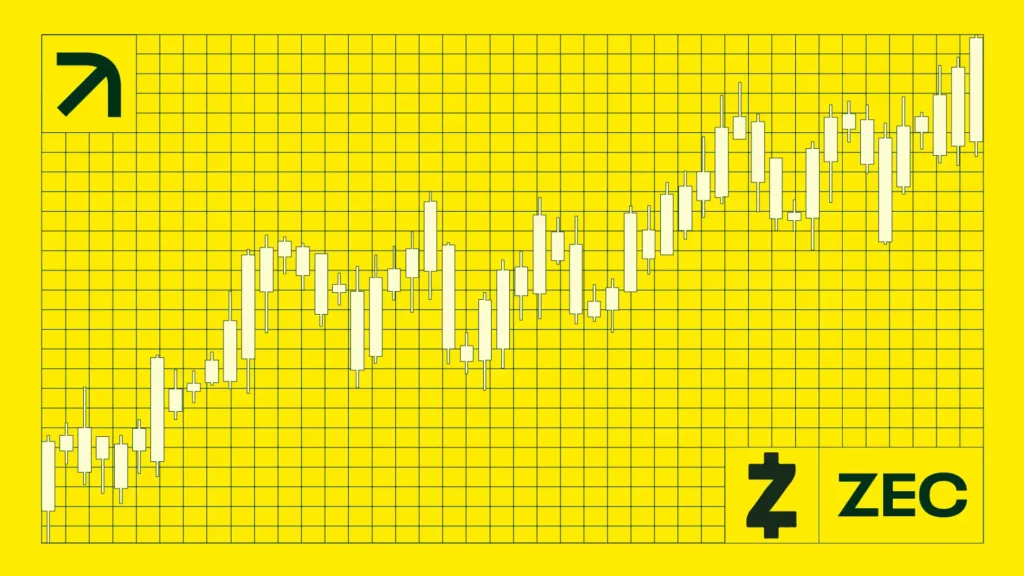
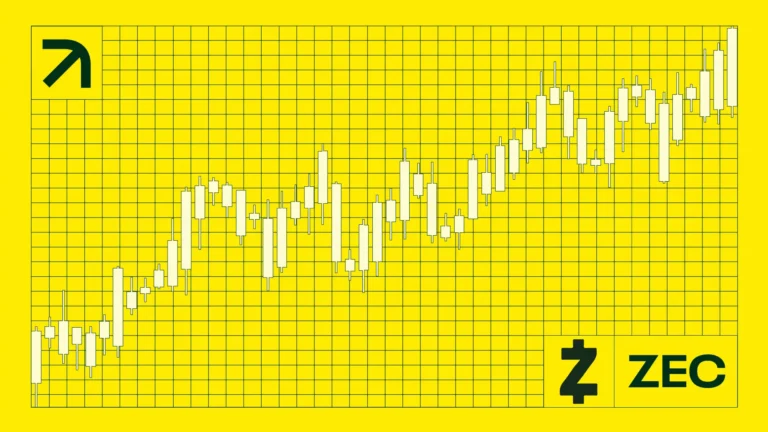
After a massive rally earlier this quarter, ZEC is once again trading at the edge of a breakdown, forming the same bearish structure that preceded its last major crash.
With momentum rolling over and support under pressure, traders are now asking whether another sharp leg lower is about to begin.
Zcash Creates Bearish Pattern
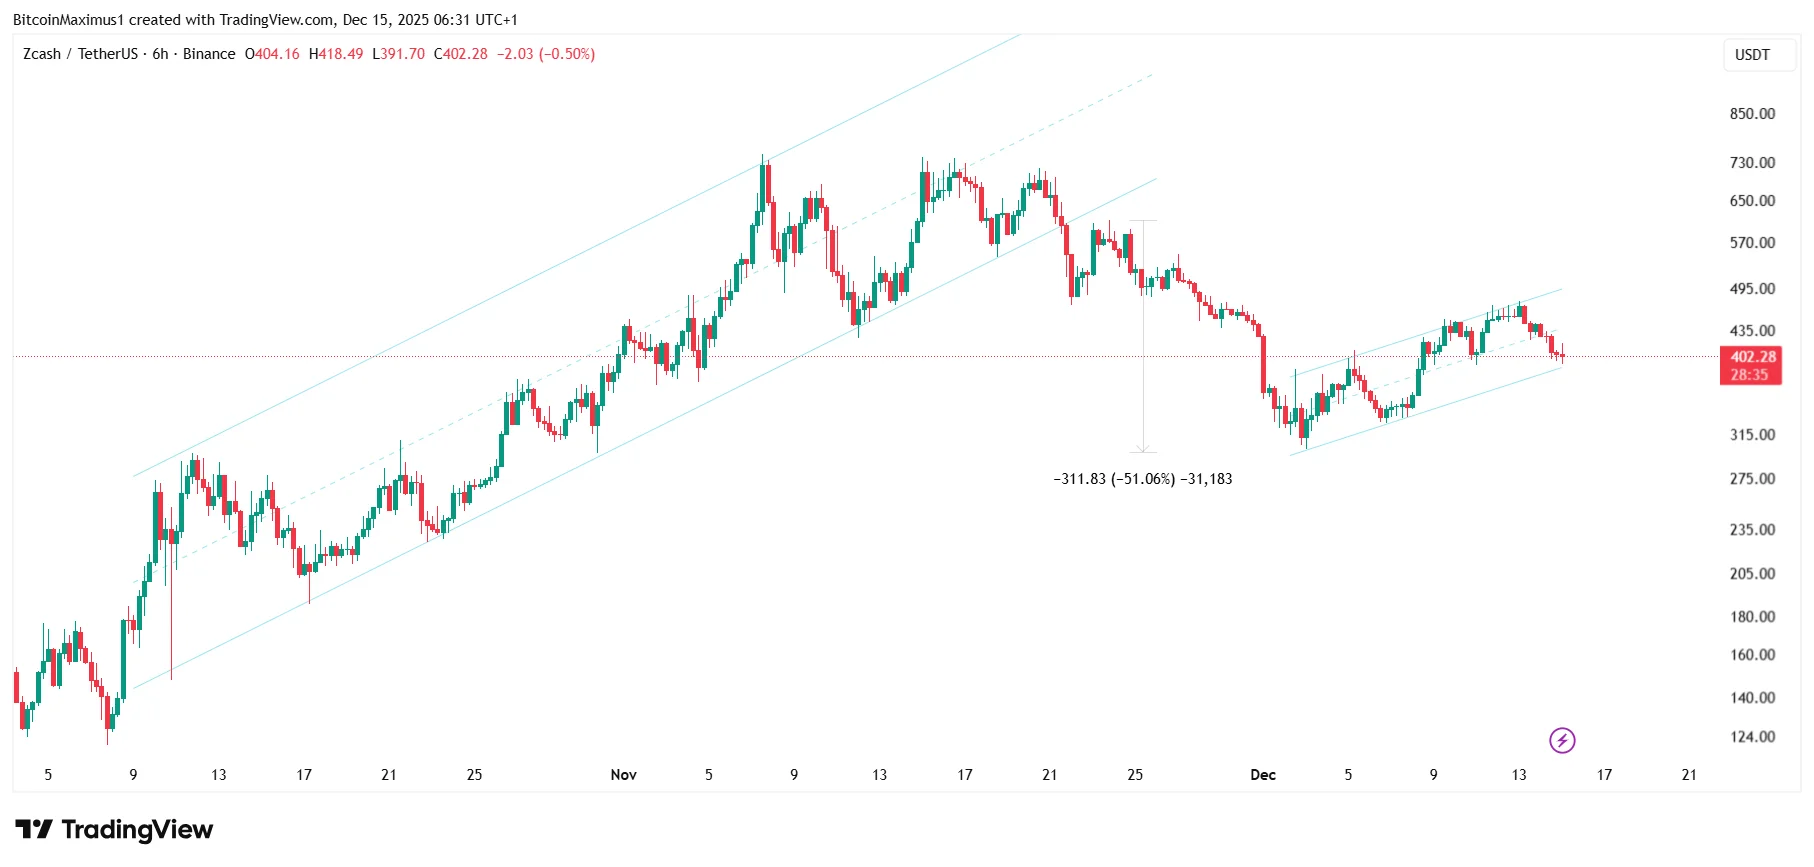
The Zcash price increased inside an ascending parallel channel since the beginning of October.
Zcash confirmed this by creating lower highs throughout November and then blasting 50% below the channel’s support trend line (red icon).
Get These Top Crypto Casino Offers Now!
Sponsored
Disclosure
We sometimes use affiliate links in our content, when clicking on those we might receive a commission at no extra cost to you. By using this website you agree to our terms and conditions and privacy policy.
Disclaimer:
The information provided in this article is for informational purposes only. It is not intended to be, nor should it be construed as, financial advice. We do not make any warranties regarding the completeness, reliability, or accuracy of this information. All investments involve risk, and past performance does not guarantee future results. We recommend consulting a financial advisor before making any investment decisions.
Valdrin Tahiri is a cryptocurrency analyst and reporter at CCN, specializing in technical analysis with a focus on Elliott Wave theory, on-chain metrics, and fundamental research. He brings over seven years of experience in the crypto space as both a trader and writer.
He discovered cryptocurrencies in 2017 while earning his MSc in Financial Markets at the Barcelona School of Economics, which sparked a deep interest in blockchain and market dynamics. Since then, he’s contributed to top crypto outlets like BeInCrypto and CoinGape.
Valdrin also served as Community Manager of BeInCrypto’s Telegram group for three years, helping grow it into one of the largest crypto communities worldwide. His expertise in market structure and price patterns allows him to break down complex trends into clear, actionable insights.
He’s published thousands of articles covering altcoins, Bitcoin cycles, and macro trends.