Zcash (ZEC) is forming a bullish engulfing weekly candlestick pattern.
ZEC might have completed a long-term A-B-C corrective structure.
Has Zcash completed its bullish trend, and if so, how much will it fall?
Zcash was one of the strongest performers earlier in the cycle, but the charts now suggest its run may be coming to an end.
After a sharp 60% drop and a weak recovery, multiple indicators are signaling that ZEC may have already topped, and a much deeper decline could be next.
So why is Zcash going down, and how far could the subsequent breakdown take it?
ZEC Price Analysis
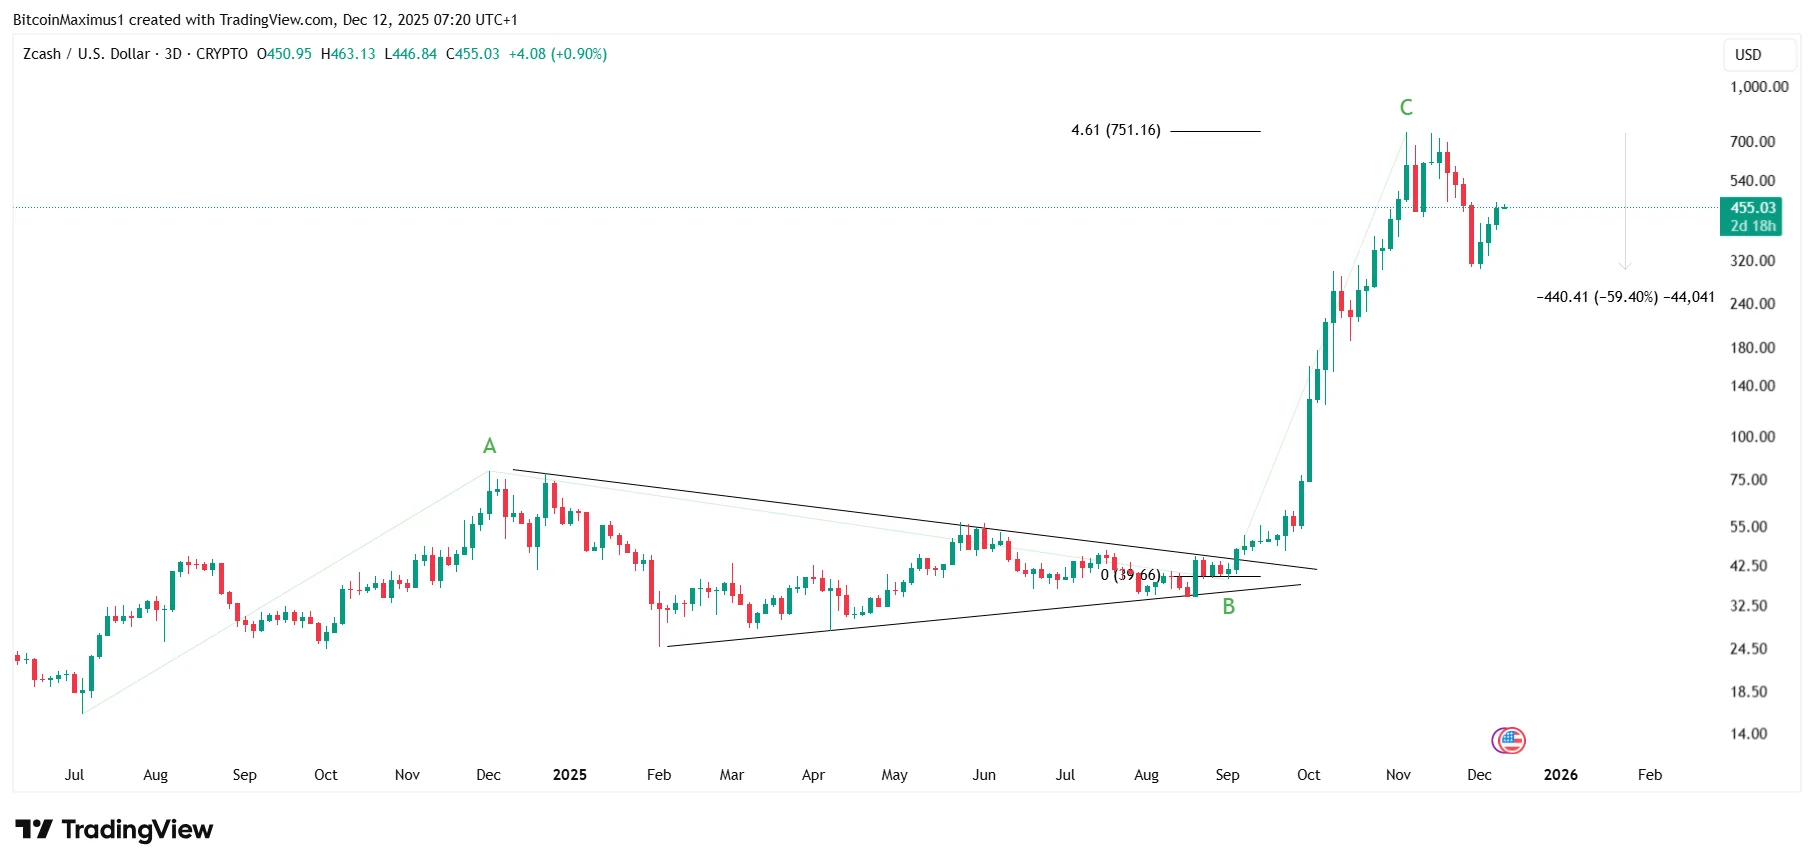
The long-term wave count shows that ZEC has completed an A-B-C corrective structure.
Wave C extended significantly, hitting 4.61 times the length of wave A.
This is often the maximum extension for wave C, and that is what happened with Zcash.
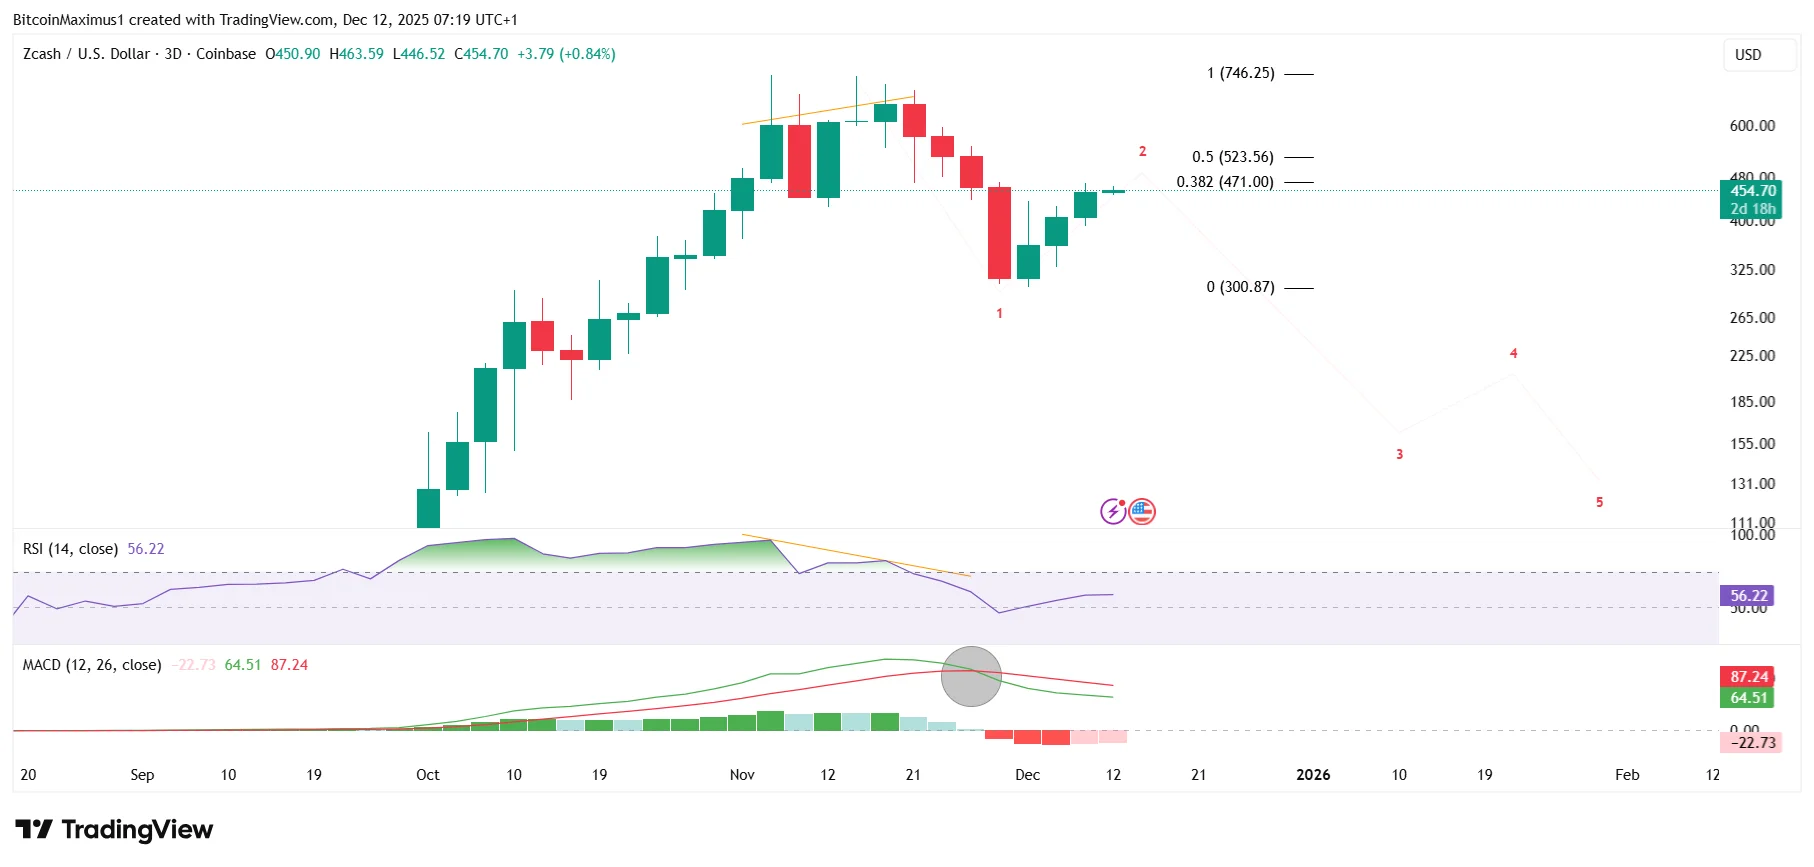
Once it falls below its midline, the likelihood of a breakdown increases.
Therefore, the most likely Zcash price prediction is bearish, suggesting a breakdown and drop below $300 is expected.
A Bigger Breakdown May Be Next
Zcash’s entire technical analysis suggests that a market top has already been established.
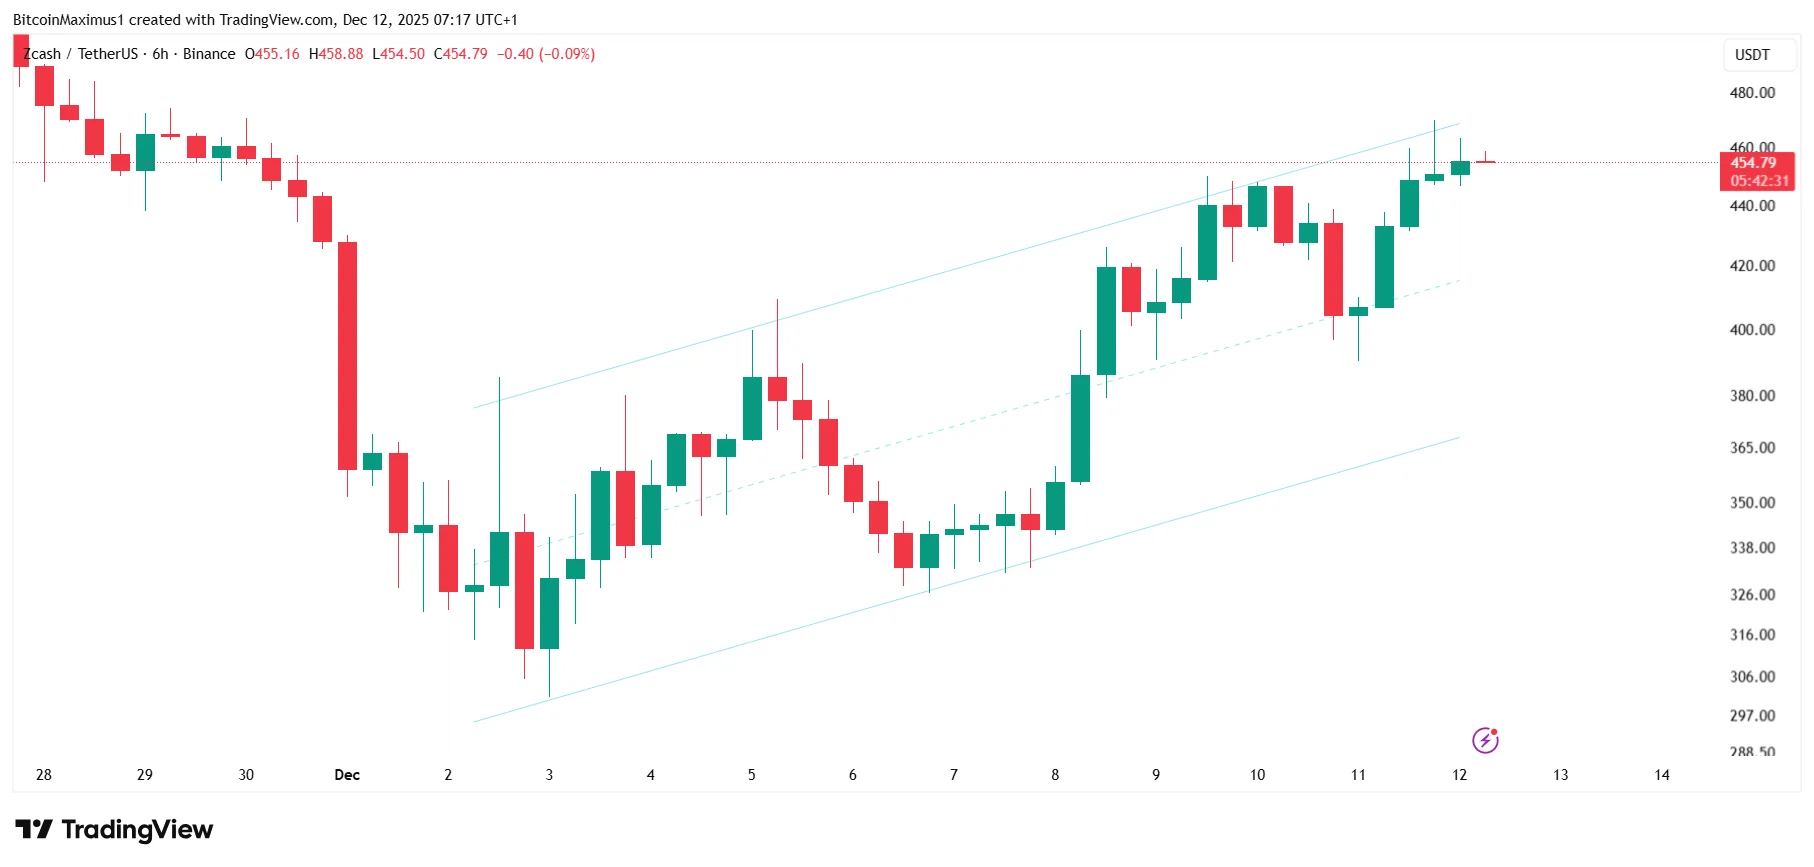
From a completed A-B-C cycle to bearish divergences and a corrective channel, all signals align with a larger downtrend ahead.
Unless ZEC can reclaim major resistance and invalidate the bearish wave count, the path forward appears to be lower prices, potentially below $300, as the next stage of the decline unfolds.
Disclaimer:
The information provided in this article is for informational purposes only. It is not intended to be, nor should it be construed as, financial advice. We do not make any warranties regarding the completeness, reliability, or accuracy of this information. All investments involve risk, and past performance does not guarantee future results. We recommend consulting a financial advisor before making any investment decisions.
Valdrin Tahiri is a cryptocurrency analyst and reporter at CCN, specializing in technical analysis with a focus on Elliott Wave theory, on-chain metrics, and fundamental research. He brings over seven years of experience in the crypto space as both a trader and writer.
He discovered cryptocurrencies in 2017 while earning his MSc in Financial Markets at the Barcelona School of Economics, which sparked a deep interest in blockchain and market dynamics. Since then, he’s contributed to top crypto outlets like BeInCrypto and CoinGape.
Valdrin also served as Community Manager of BeInCrypto’s Telegram group for three years, helping grow it into one of the largest crypto communities worldwide. His expertise in market structure and price patterns allows him to break down complex trends into clear, actionable insights.
He’s published thousands of articles covering altcoins, Bitcoin cycles, and macro trends.