Solana slips back under pressure after repeated rejections | Credit: Hameem Sarwar
Share
Key Takeaways
Solana remains below resistance with fading buying momentum.
Technical indicators favor continued downside consolidation.
Will SOL price stay under $120 through the holidays?
Solana (SOL) is heading into the holiday period under sustained technical pressure. As of this writing, the price action has failed to reassert itself against key resistance zones.
After multiple rejections in the mid-$120s, Solana’s price has slipped back into a vulnerable range where sellers remain in control.
With broader market participation thinning toward year-end and indicators flashing caution, the setup increasingly favors consolidation to the downside.
In fact, this could keep SOL below $120 through Christmas. Here’s how the technical picture is shaping up.
Solana Buying Pressure Continues to Erode
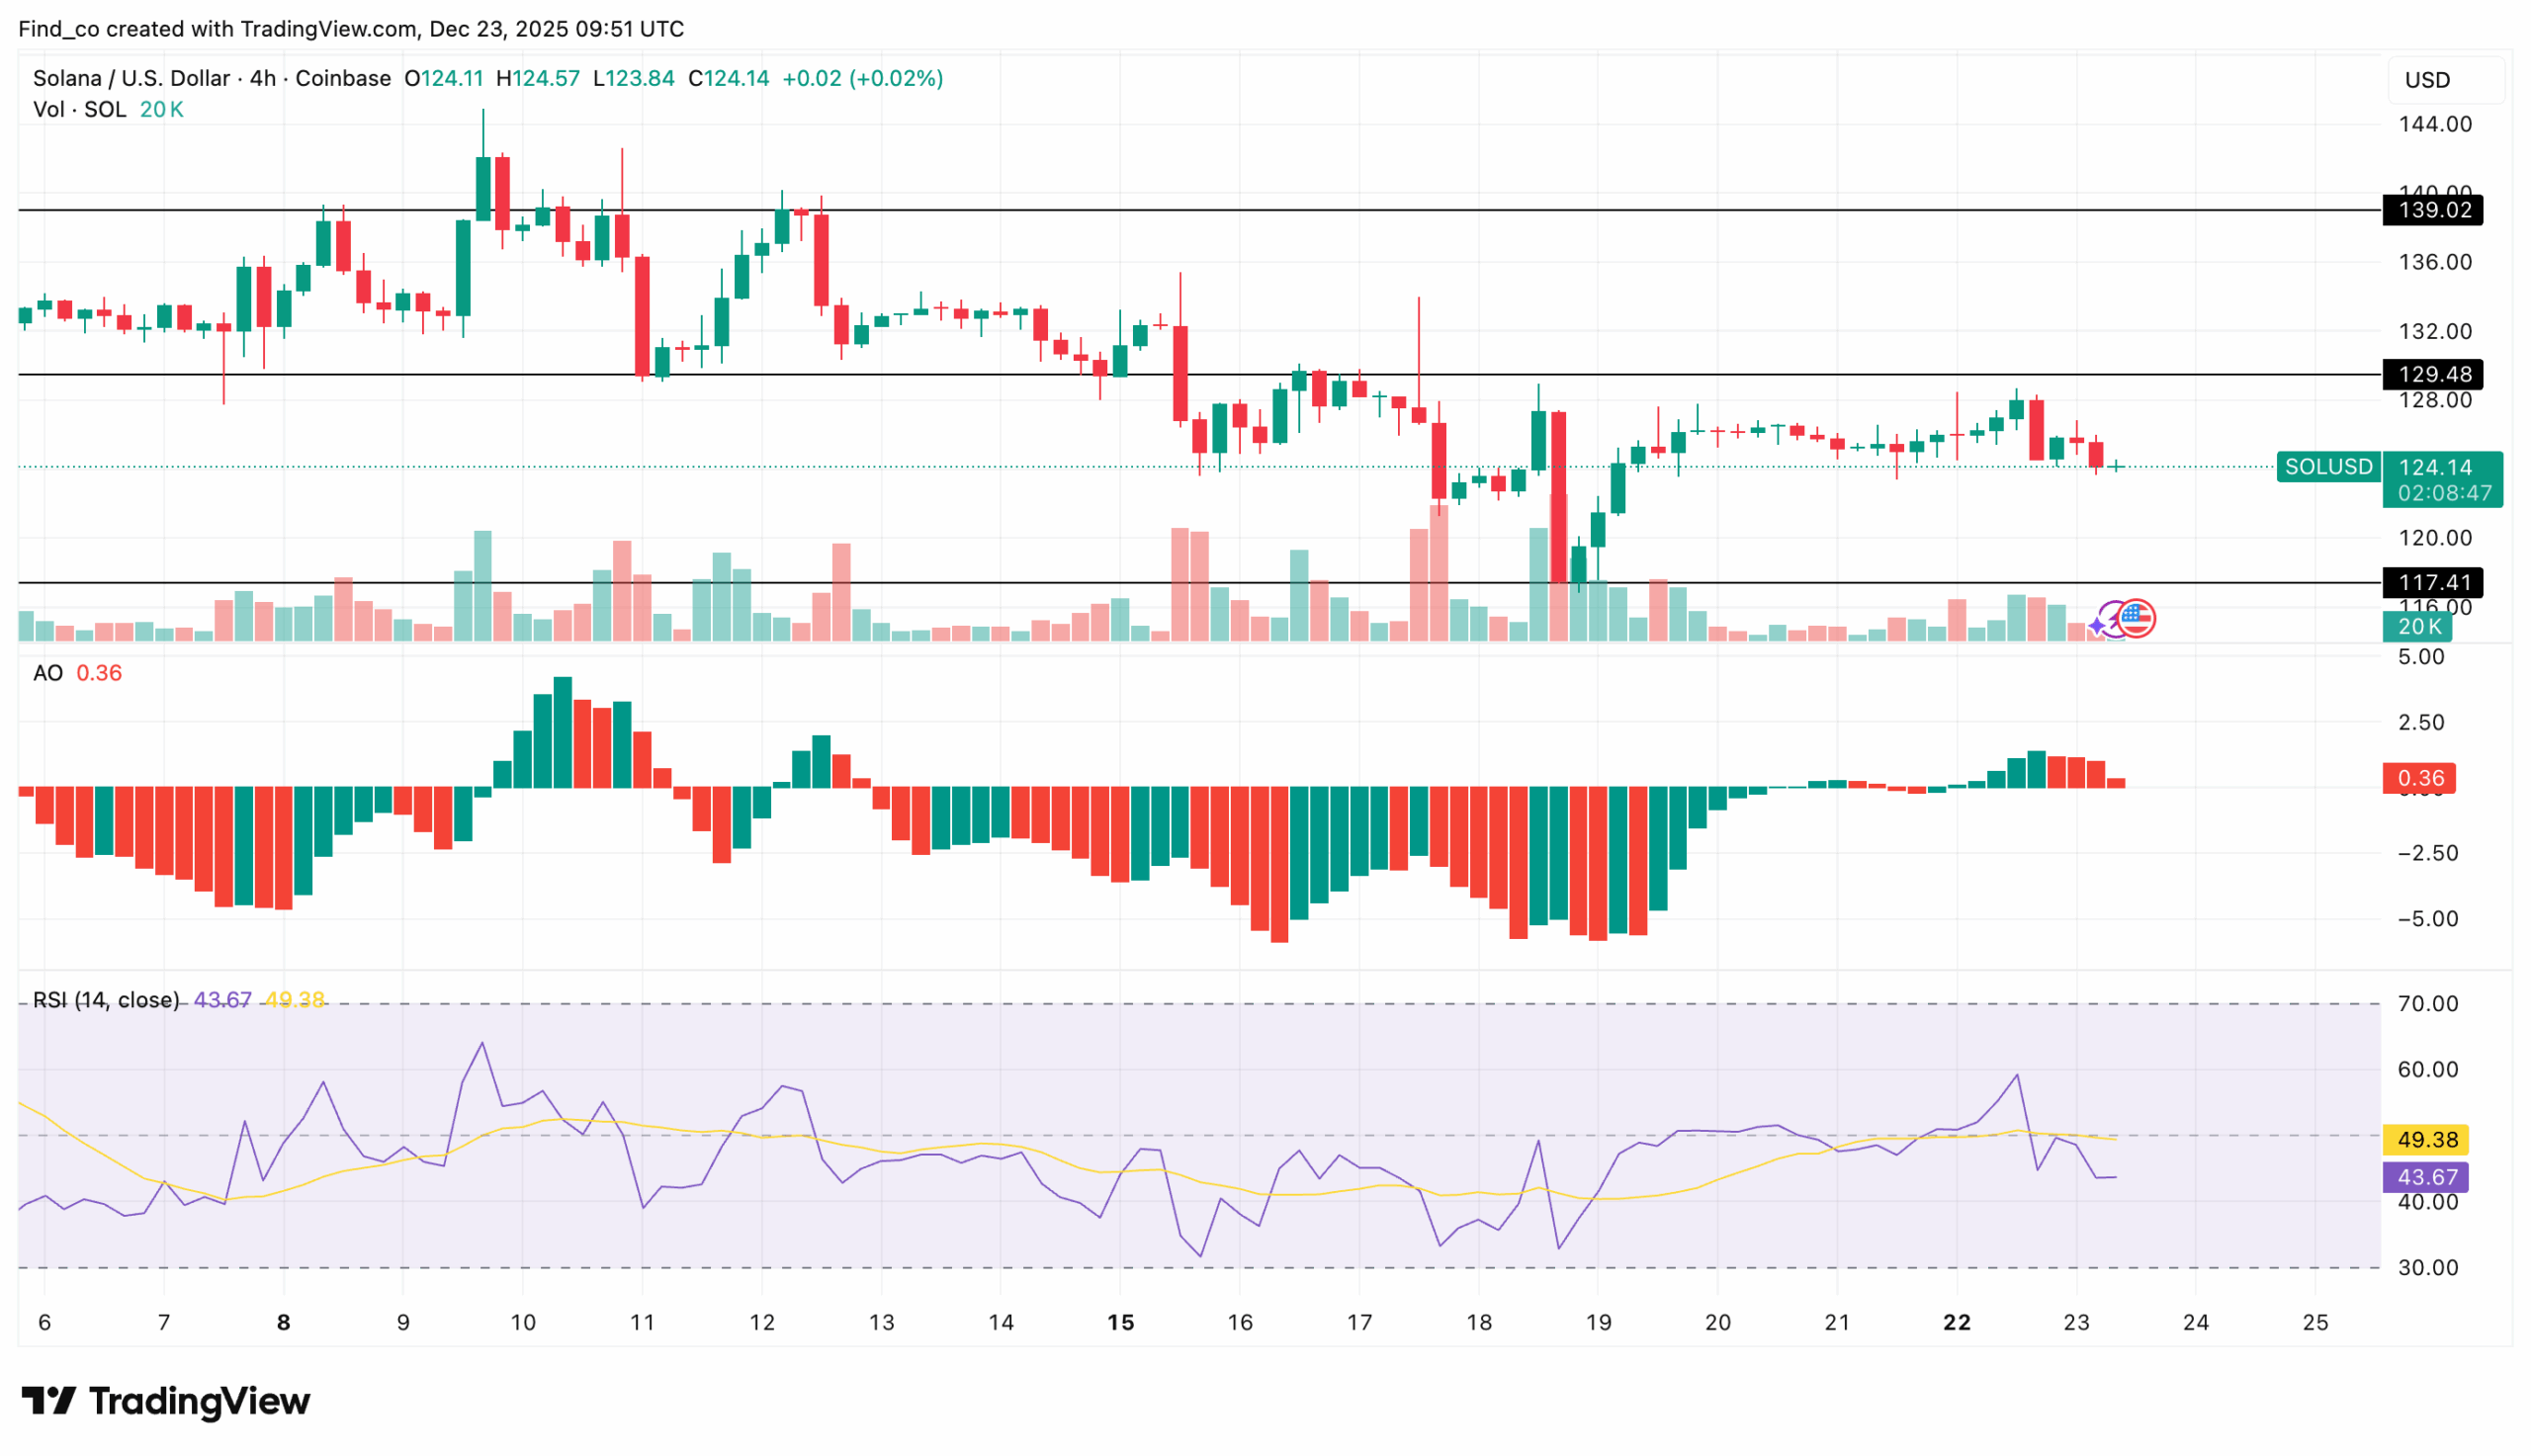
On the 4-hour chart, the Awesome Oscillator (AO) reflects a loss of upside momentum.
The indicator remains compressed near the zero line, printing shallow histogram bars that point to fading bullish strength.
The failure to expand meaningfully into positive territory suggests that the recent Solana price rebound lacks follow-through. This increases the risk that price action remains corrective rather than trend-changing.
Furthermore, the Relative Strength Index (RSI) reinforces this view.
Sitting around 43.89, RSI remains below the neutral 50 level, indicating that bearish pressure continues to outweigh buying interest.
Repeated failures to reclaim bullish territory indicate weak demand, as buyers struggle to regain short-term control.
As long as the price remains capped beneath this zone, upside attempts are likely to stall, keeping Solana’s price pinned below $120 into the holiday period.
The pattern of lower highs and lower lows remains intact, limiting the scope for sustained upside without a clear momentum shift.
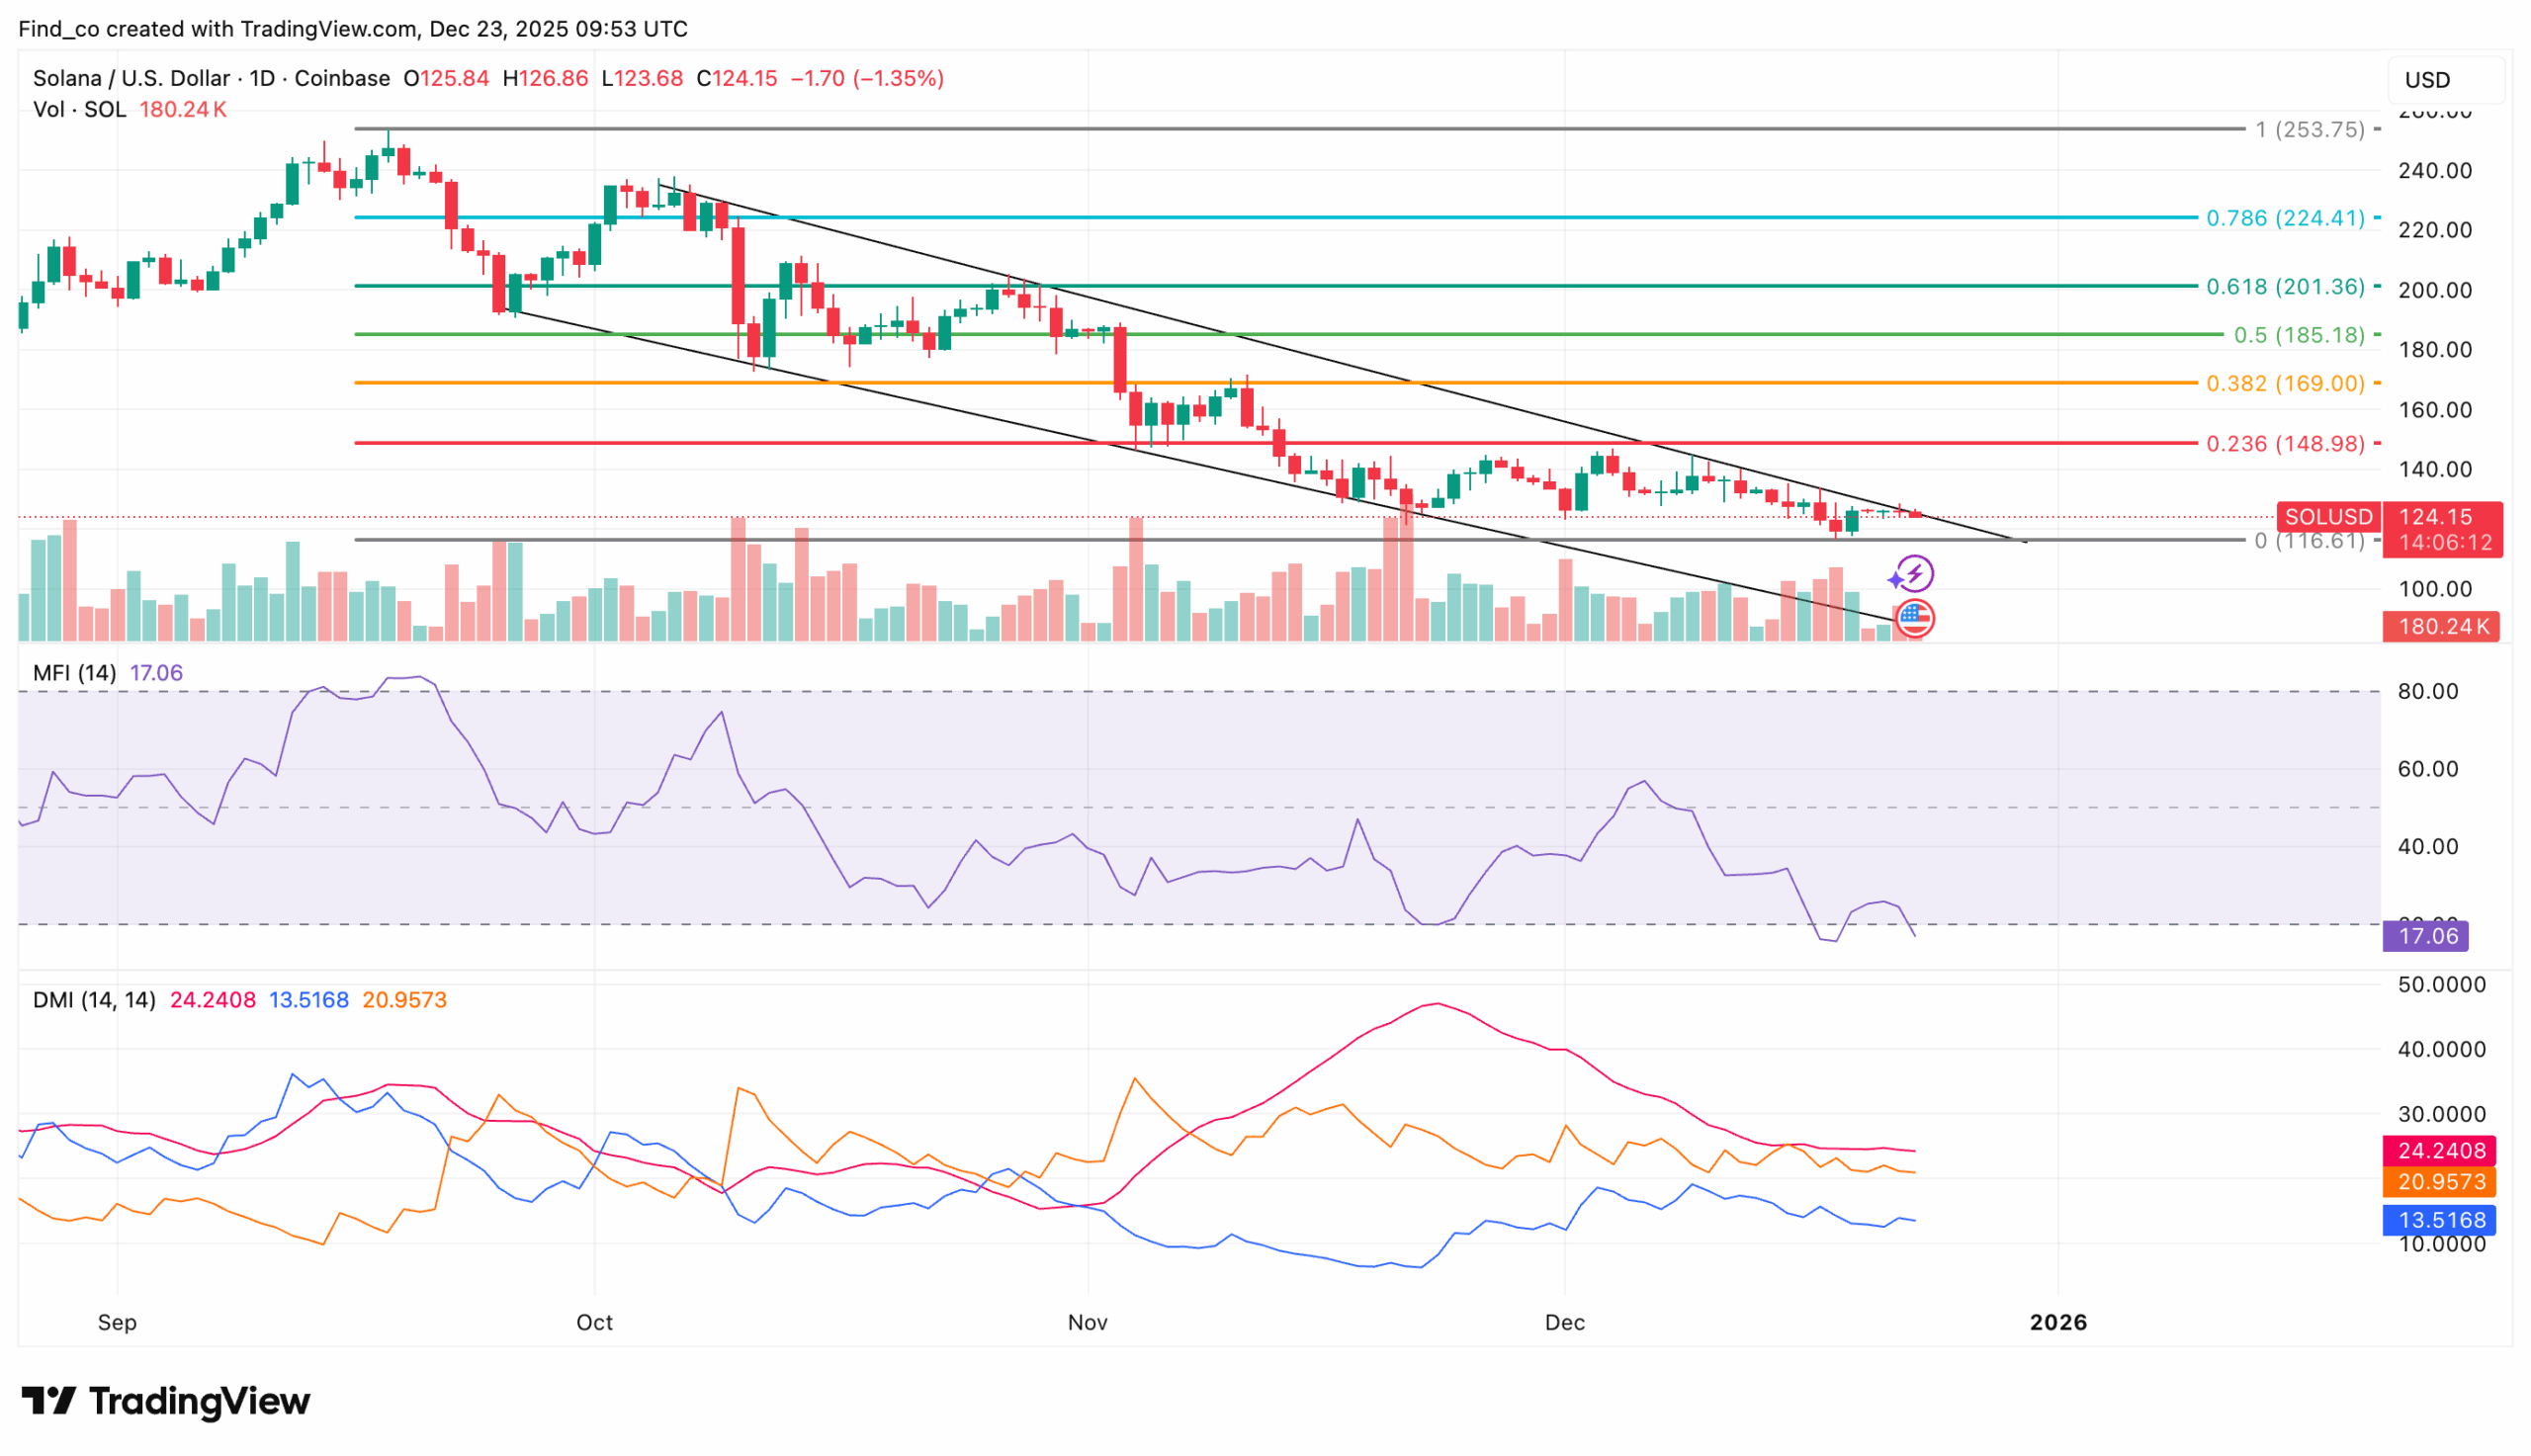
Furthermore, the Money Flow Index (MFI) has dropped to 17.06, indicating persistent selling pressure as the indicator continues to drift deeper into oversold territory.
The Directional Movement Index (DMI) adds further confirmation. The negative -DMI at 24.24 remains well above the positive +DMI at 13.52, indicating that sellers continue to dominate directional momentum.
Meanwhile, the Average Directional Index (ADX) at 24.24 suggests the downtrend remains well-established rather than weakening.
Fibonacci retracement levels provide additional clarity.
At the time of writing, SOL trades around $124.11 and appears to be drifting toward the Fibonacci level, near $116.50.
On the upside, reclaiming the 0.236 Fibonacci level around $149.22, supported by strong momentum and volume, would be required to signal a meaningful trend shift rather than another corrective bounce.
Analyst Expectations Remain Cautious
Market participants remain divided, although near-term optimism appears to be limited.
Crypto analyst Bitbull noted on X that while SOL’s price may see a brief dip below support, he views deeper pullbacks as accumulation zones:
“SOL is looking good here. I wouldn’t rule out one deviation below the support zone, but it’s due for a rally now. Any sweep of $90–$100 will be for buying. IMO, SOL will pump towards $160 to $180 in Q1 2026 before any correction.” The analyst explained.
Others are more cautious. Analyst Stefan B warned that failure to stabilize could lead to further downside:
“SOL doesn’t look great. It either consolidates here to get on the right side of the trendline, or we face rejection and move lower. My main POI for buying is $78.14 per SOL.” He noted.
Disclaimer:
The information provided in this article is for informational purposes only. It is not intended to be, nor should it be construed as, financial advice. We do not make any warranties regarding the completeness, reliability, or accuracy of this information. All investments involve risk, and past performance does not guarantee future results. We recommend consulting a financial advisor before making any investment decisions.
Victor Olanrewaju is a crypto analyst and reporter at CCN with deep roots in on-chain research and technical analysis. His crypto journey began in 2017, but it was the 2020 Uniswap airdrop that sparked a full-time pivot into the space.
With a foundation in copywriting, Victor honed his craft creating high-converting content for leading crypto brokers — most notably an XRP price prediction that ranked #1 on Google during the 2021 bull run.
He later joined AMBCrypto in 2022, where he combined storytelling with technical and on-chain analysis to cover key market narratives.
In 2024, he expanded his expertise at BeInCrypto, collaborating with analysts and using tools like Glassnode, Santiment, and IntoTheBlock to break down Bitcoin and altcoin trends.
At CCN, Victor covers the top cryptocurrencies, memecoins, macro shifts, blending real-time insights with deep-dive metrics.
He holds a Bachelor’s degree in Physics from the University of Ibadan, equipping him to simplify complex data for a wide audience. Follow his work or connect on LinkedIn or X.