Home / Analysis / Crypto / Technical Analysis / XRP Rejection Near $1.50 Puts Bears Back in Control, but This Pullback Could Be the Setup Bulls Have Been Waiting For
XRP is trapped between bullish and bearish pressure | Credit: Hameem Sarwar
Share
Key Takeaways
XRP’s price is stabilizing near key support at $1.40, suggesting seller exhaustion.
A confirmed move above $1.45 could drive gains toward $1.70 and signal a trend shift.
Failure to hold support could lead to a pullback, but XRP’s price has formed a double bottom.
XRP has been here before, stalling near $1.50, giving ground to the bears, and forcing bulls into an uncomfortable wait.
Each time, the question is the same. Is this the rejection that finally breaks the structure, or just another reset before the next attempt?
Well, based on the recent XRP price action, it seems that the recent pullback will not drag the altcoin below $1.
Instead, XRP could be on the brink of a blistering breakout. Here is why.
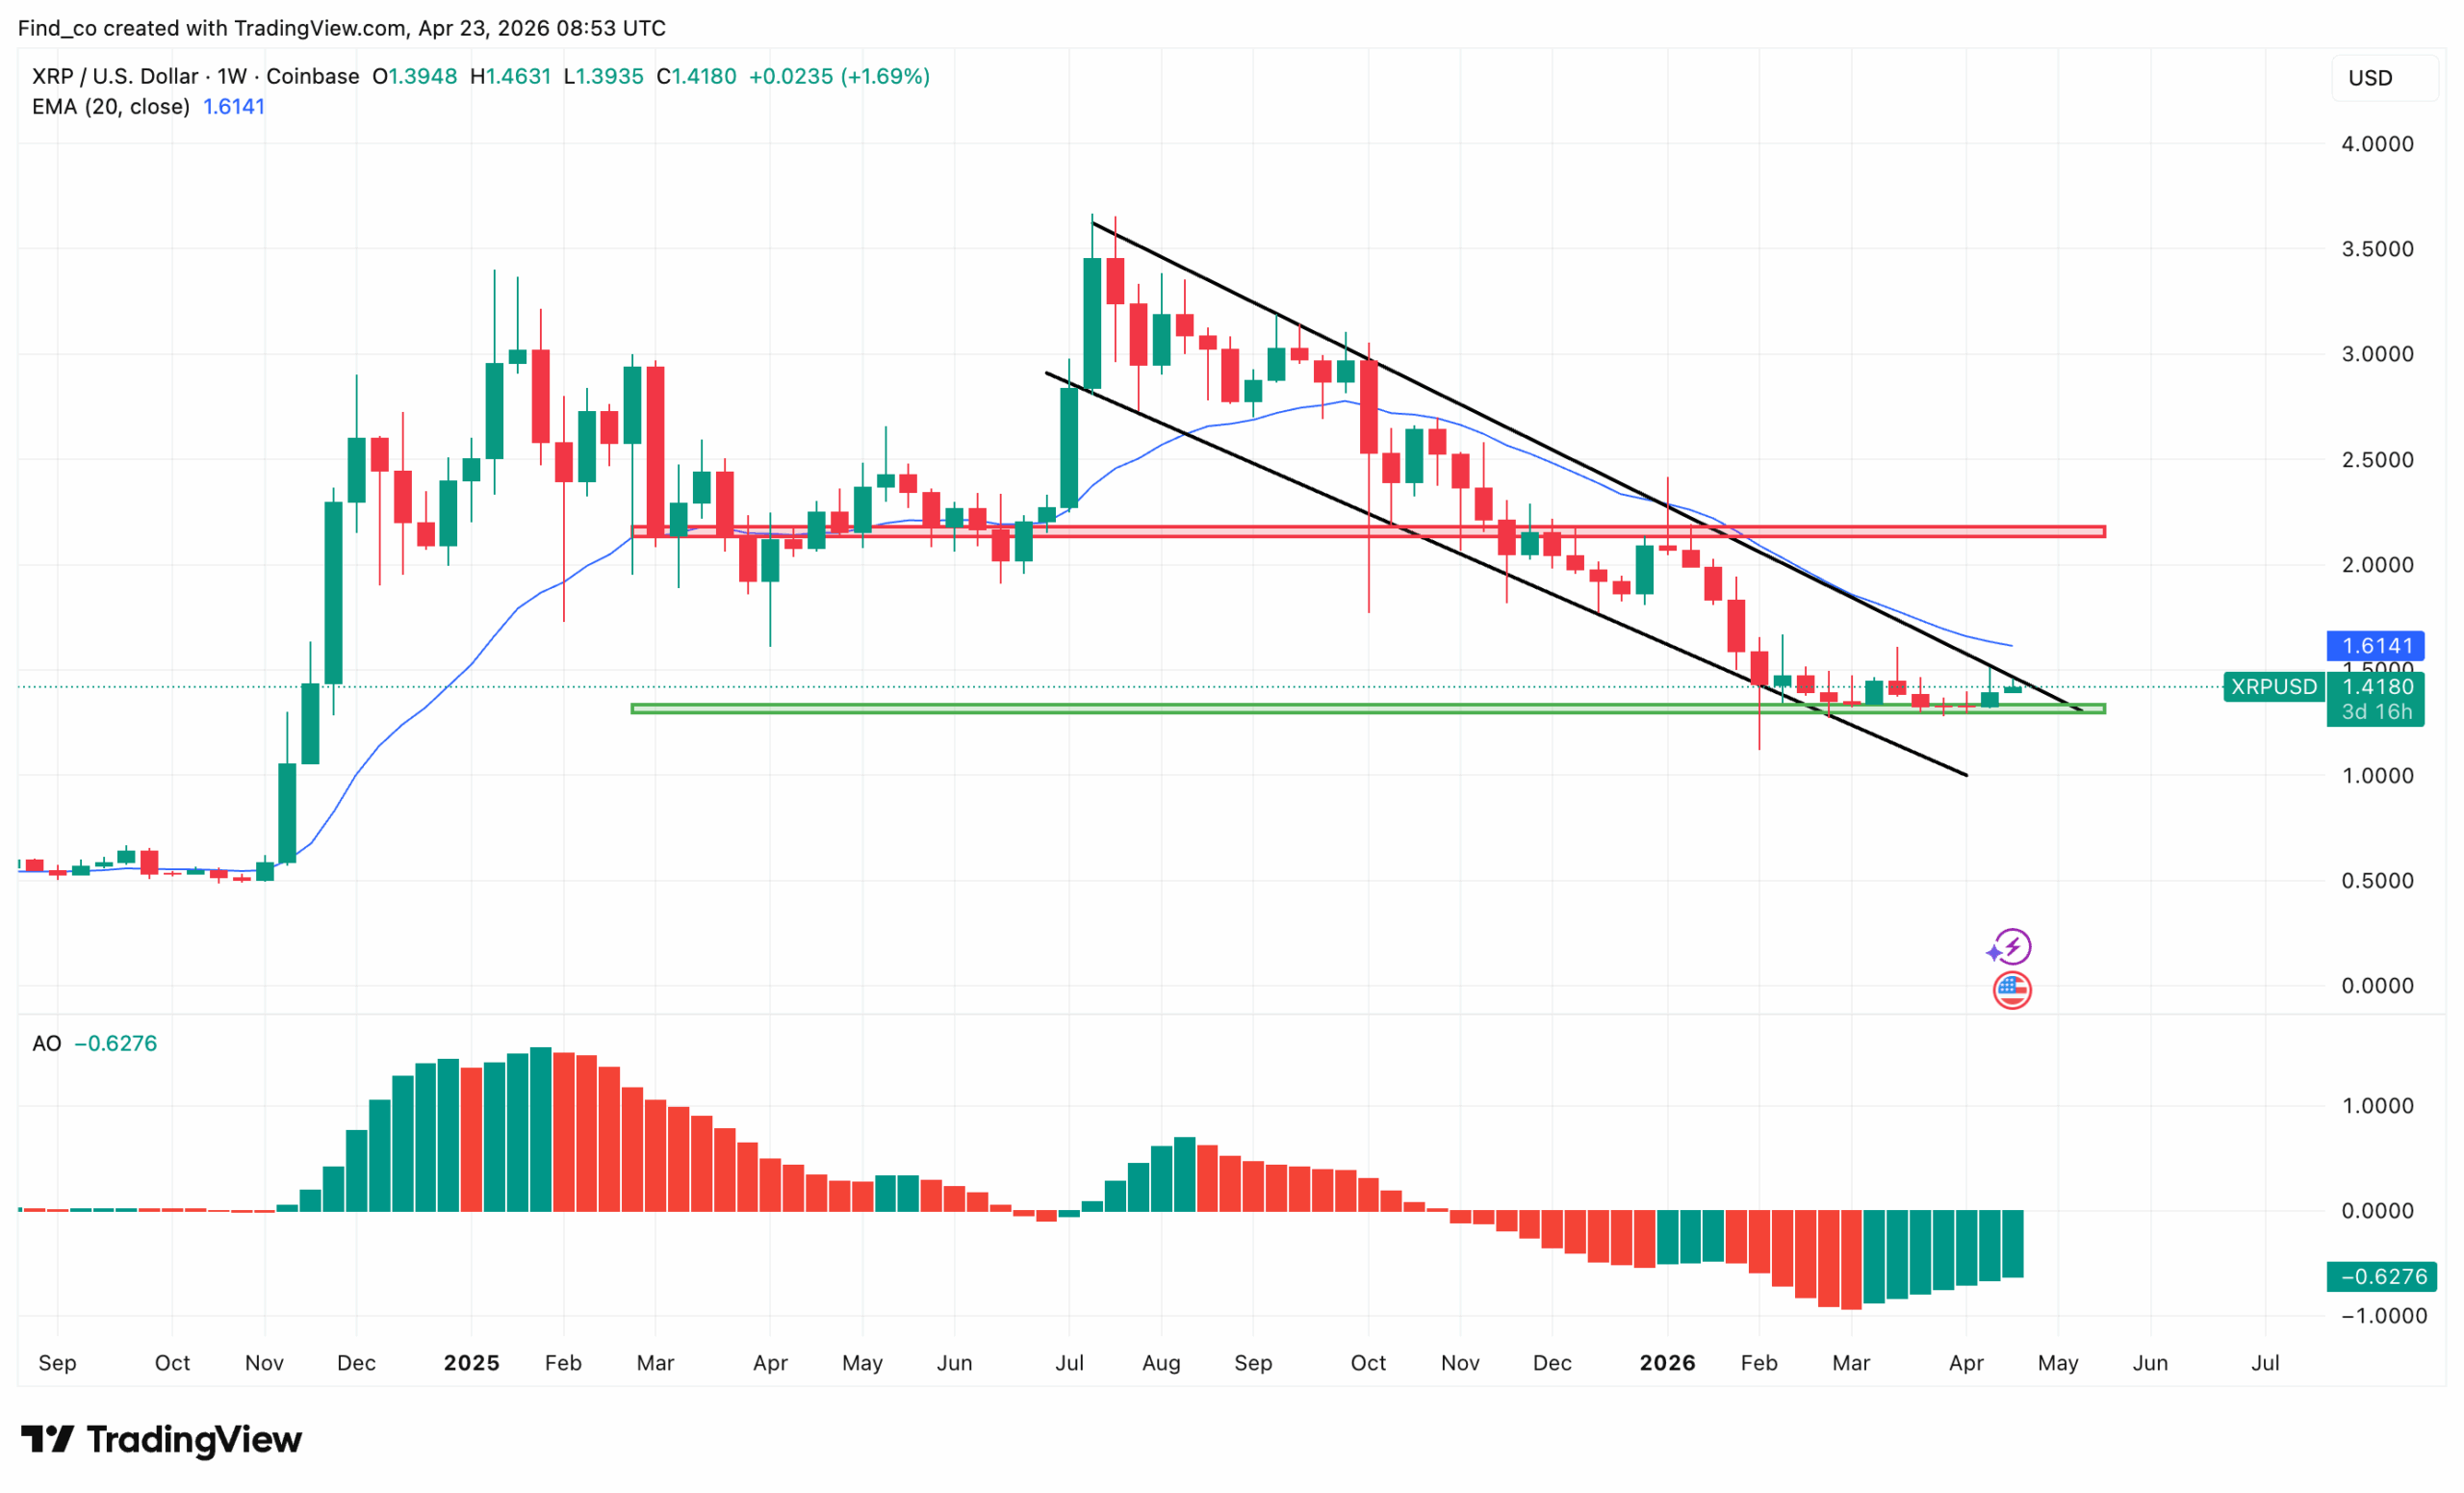
XRP Flirts With Upper Trendline
On the weekly chart, XRP is still in a macro downtrend channel. However, it is now sitting at a key inflection point.
As shown below, the price has compressed into the lower support zone around $1.40. But it is also testing the upper level of the descending channel.
The fact that price is holding here and starting to grind upward suggests seller exhaustion, especially as the Awesome Oscillator (AO) histogram is turning less negative.
However, the structure is still entirely bullish. XRP’s price is still below the EMA ($1.61).
It is also well below the major horizontal resistance around $2.00, which had previously served as support-turned-resistance.
If this support holds and XRP breaks out of the channeland reclaims $1.60, it could open a move toward $2.00, and, above that, a broader trend shift could target $2.50.
But there is still the risk of dropping below $1.30. If that happens, the breakdown will likely continue in the $1 direction.
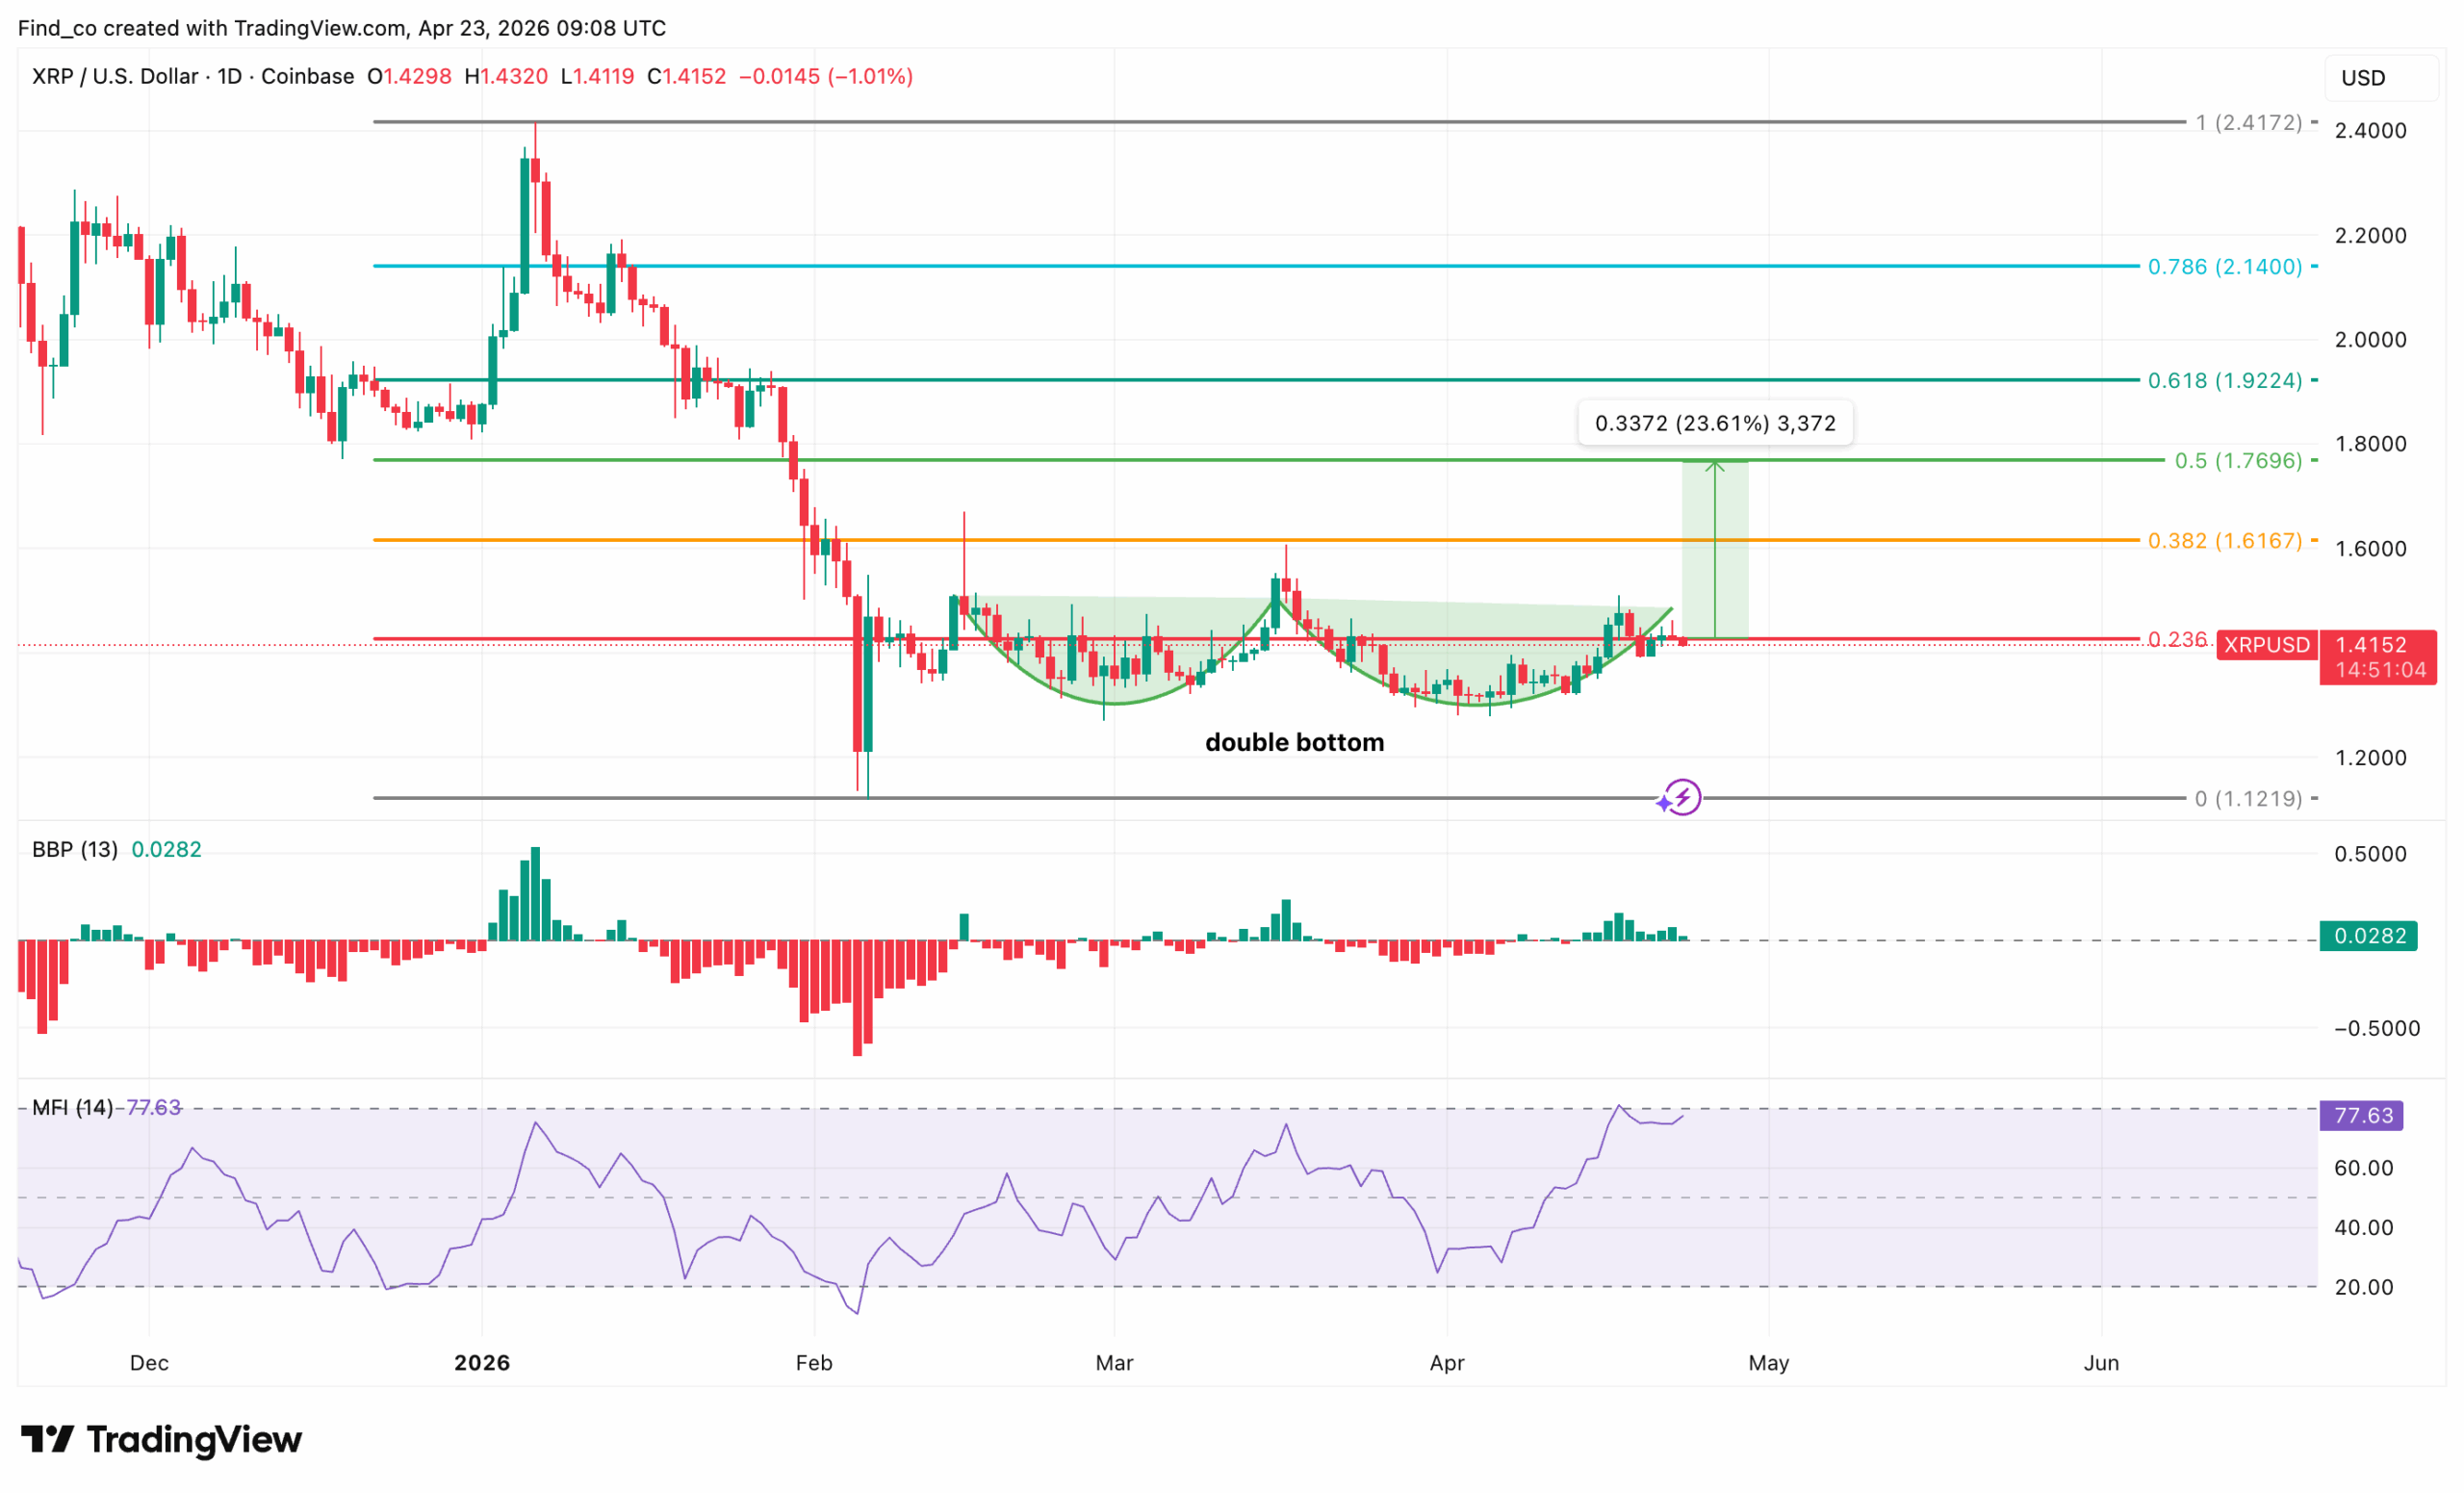
XRP Double-Bottom Predicts Higher Price
Meanwhile, there is a much clearer potential reversal structure on the daily chart than on the weekly timeframe.
As shown below, the chart shows a double bottom around $1.20 and $1.25, followed by a push into the neckline resistance near $1.45 (0.236 Fib).
At the time of writing, XRP’s price is currently consolidating right at that breakout level, which is key.
Momentum supports the move. For instance, the Bull Bear Power (BBP) is turning positive, and the Money Flow Index (MFI) is elevated, indicating buying pressure.
But, at the same time, it is also approaching overbought territory.
If XRP’s price confirms a breakout above $1.45, the measured move from the double bottom projects toward $1.70–$1.80 (0.5 Fib), with intermediate resistance at $1.62 (0.382 Fib).
Notably, that seems to be the logical upside-down path.
However, if it fails to hold above $1.40 and rejects, this becomes a failed breakout, and the price likely rotates back toward $1.30 $1.20, retesting the support.
Disclaimer:
The information provided in this article is for informational purposes only. It is not intended to be, nor should it be construed as, financial advice. We do not make any warranties regarding the completeness, reliability, or accuracy of this information. All investments involve risk, and past performance does not guarantee future results. We recommend consulting a financial advisor before making any investment decisions.
Victor Olanrewaju is a crypto analyst and reporter at CCN with deep roots in on-chain research and technical analysis. His crypto journey began in 2017, but it was the 2020 Uniswap airdrop that sparked a full-time pivot into the space.
With a foundation in copywriting, Victor honed his craft creating high-converting content for leading crypto brokers — most notably an XRP price prediction that ranked #1 on Google during the 2021 bull run.
He later joined AMBCrypto in 2022, where he combined storytelling with technical and on-chain analysis to cover key market narratives.
In 2024, he expanded his expertise at BeInCrypto, collaborating with analysts and using tools like Glassnode, Santiment, and IntoTheBlock to break down Bitcoin and altcoin trends.
At CCN, Victor covers the top cryptocurrencies, memecoins, macro shifts, blending real-time insights with deep-dive metrics.
He holds a Bachelor’s degree in Physics from the University of Ibadan, equipping him to simplify complex data for a wide audience. Follow his work or connect on LinkedIn or X.