Solana's price looks ready to rise to $100 again | Credit: Hameem Sarwar
Share
Key Takeaways
Solana’s price is building bullish momentum with higher lows and strengthening indicators.
A breakout could push SOL toward $100, while continued ETF inflows support further upside.
If momentum weakens or demand stalls, the price may consolidate or retrace toward lower support.
Solana’s (SOL) price has not crossed $100 on the other side in nearly three months.
Every time SOL approached it, sellers showed up. But this time, things could change as buyers have defended key support, momentum has accelerated, and resistance has started to weaken.
Therefore, what looked like another test could turn out to be the breakout that traders have been waiting for.
Solana Builds Bullish Structure
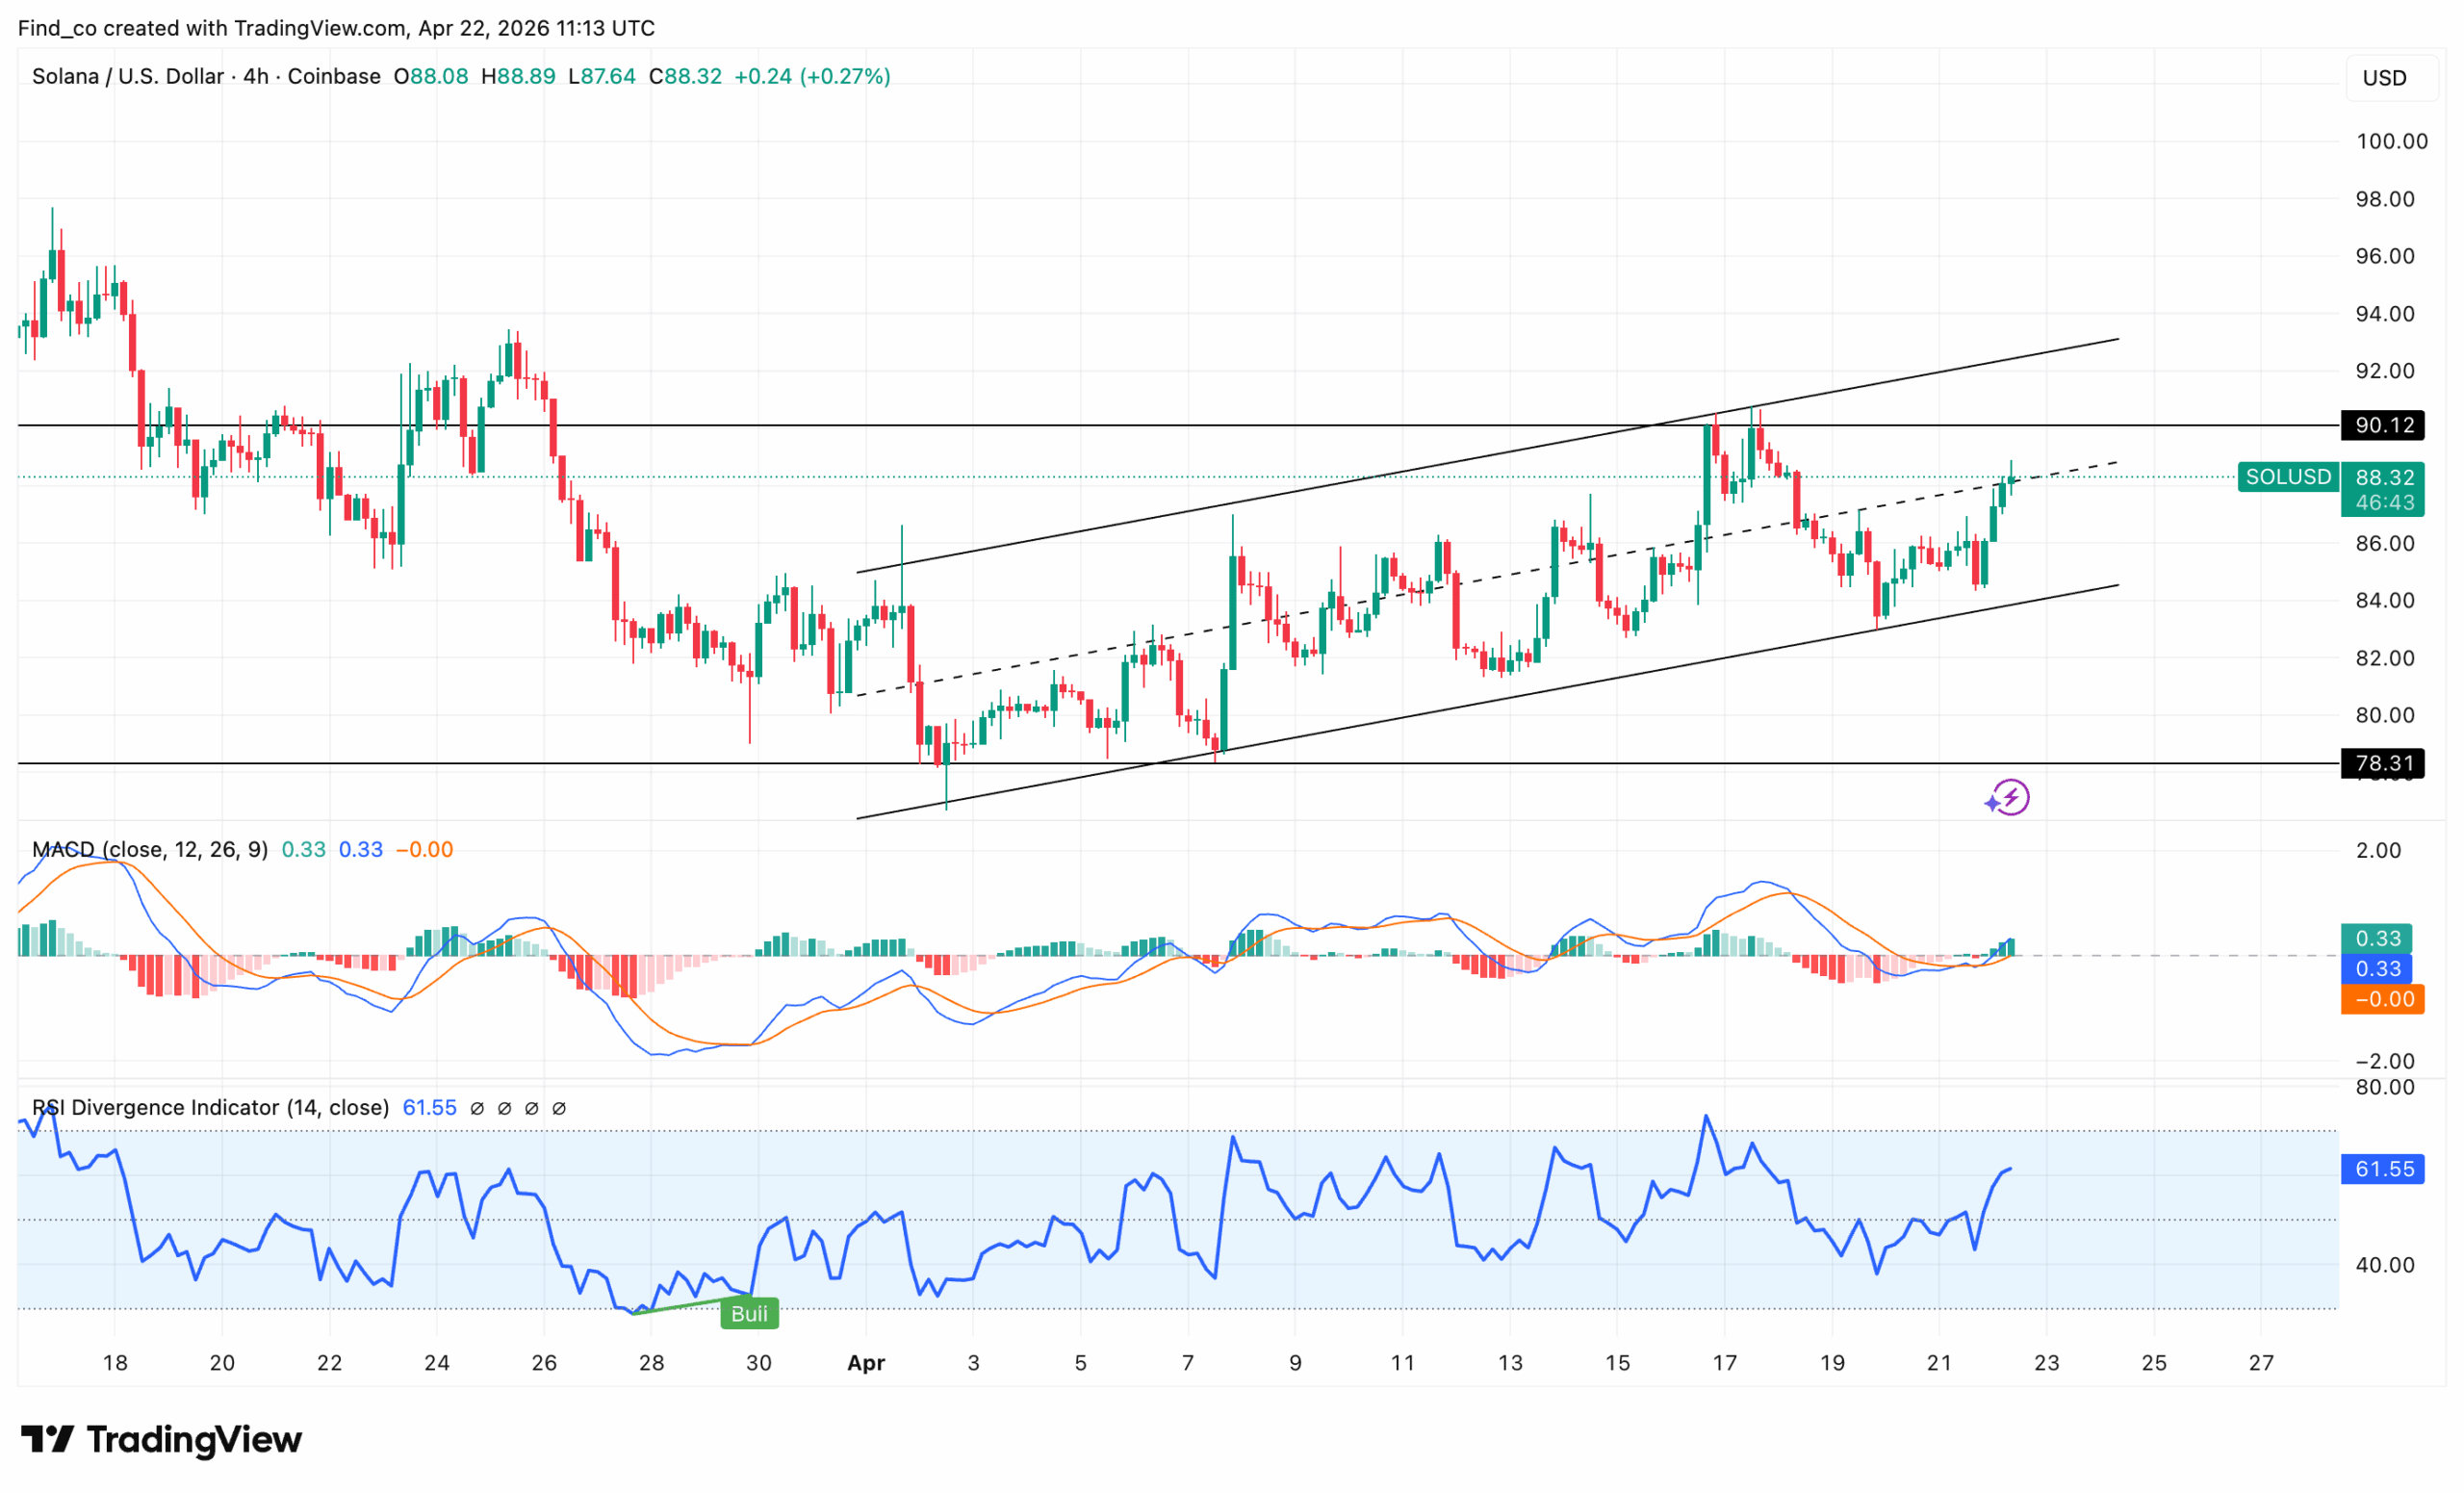
On the 4-hour chart, SOL is attempting to extend its recovery after defending support near $76 and printing a sequence of higher lows. That structure suggests bullish pressure is building.
SOL’s price is currently approaching a long-standing resistance zone around $93, a level that has capped upside several times.
For now, bulls appear in control. Buyers have absorbed pullbacks, while recent candles show renewed strength near $88. As a result, the move looks like accumulation beneath resistance rather than exhaustion.
Momentum indicators are leaning constructively on the 4-hour chart. The Moving Average Convergence Divergence (MACD) has crossed upward with expanding positive histogram bars, often an early sign of trend continuation.
Meanwhile, the Relative Strength Index (RSI) has pushed above 60, reflecting strengthening demand without entering overbought territory.
That combination matters. Rising RSI alongside a bullish MACD crossover often supports sustained upside rather than a short-lived bounce.
If Solana’s price breaks and closes above $93, the next upside target could emerge near $100, implying roughly 13% upside from current levels.
Institutional Interest Rises
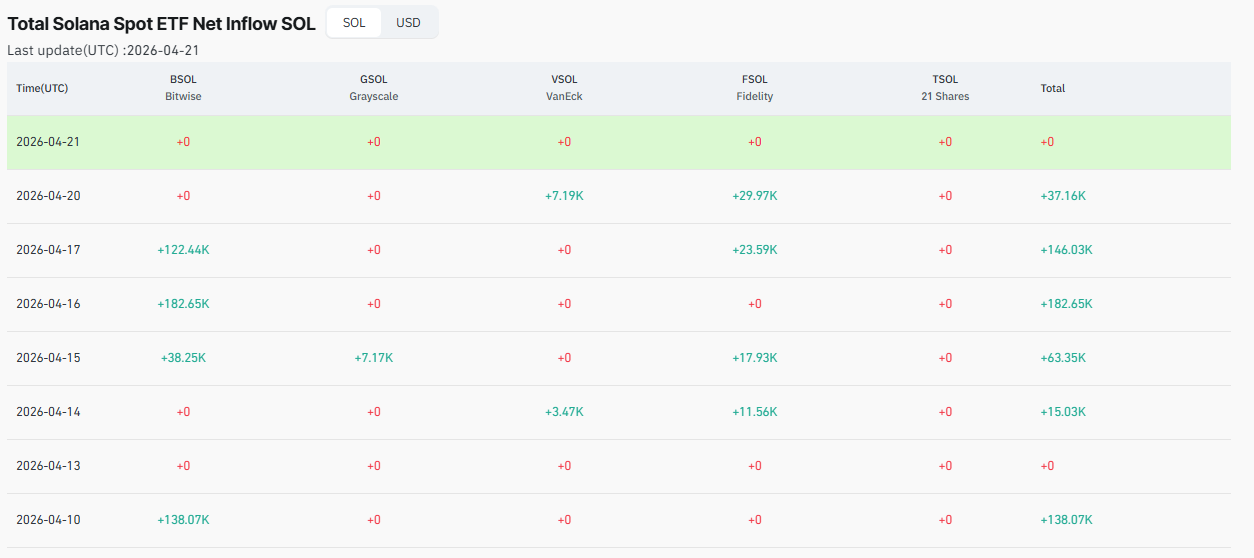
Meanwhile, Solana ETF flows have been showing intermittent but notable inflows over the past sessions, with strong spikes on April 16 (+182,000 SOL) and April 17 (+146,000 SOL), followed by smaller but still positive inflows on April 20.
However, the most recent data is showing flat flows (zero), indicating a pause in institutional demand.
This pattern suggests that demand has recently been strong but is now cooling in the short term.
The earlier inflows were likely supporting price strength and upward momentum, as ETF demand typically reflects spot buying pressure.
With flows now stalling, SOL could be entering a consolidation phase. If inflows resume, Solana’s price could continue to rise as fresh capital enters the market.
But if this pause turns into outflows or prolonged inactivity, it could reduce buying pressure, and the price may struggle to extend gains or could retrace in the near term.
Overall, ETF demand has been supportive, but the current slowdown suggests momentum may depend on whether inflows pick back up.
SOL Price Outlook: Recovery Phase in Motion
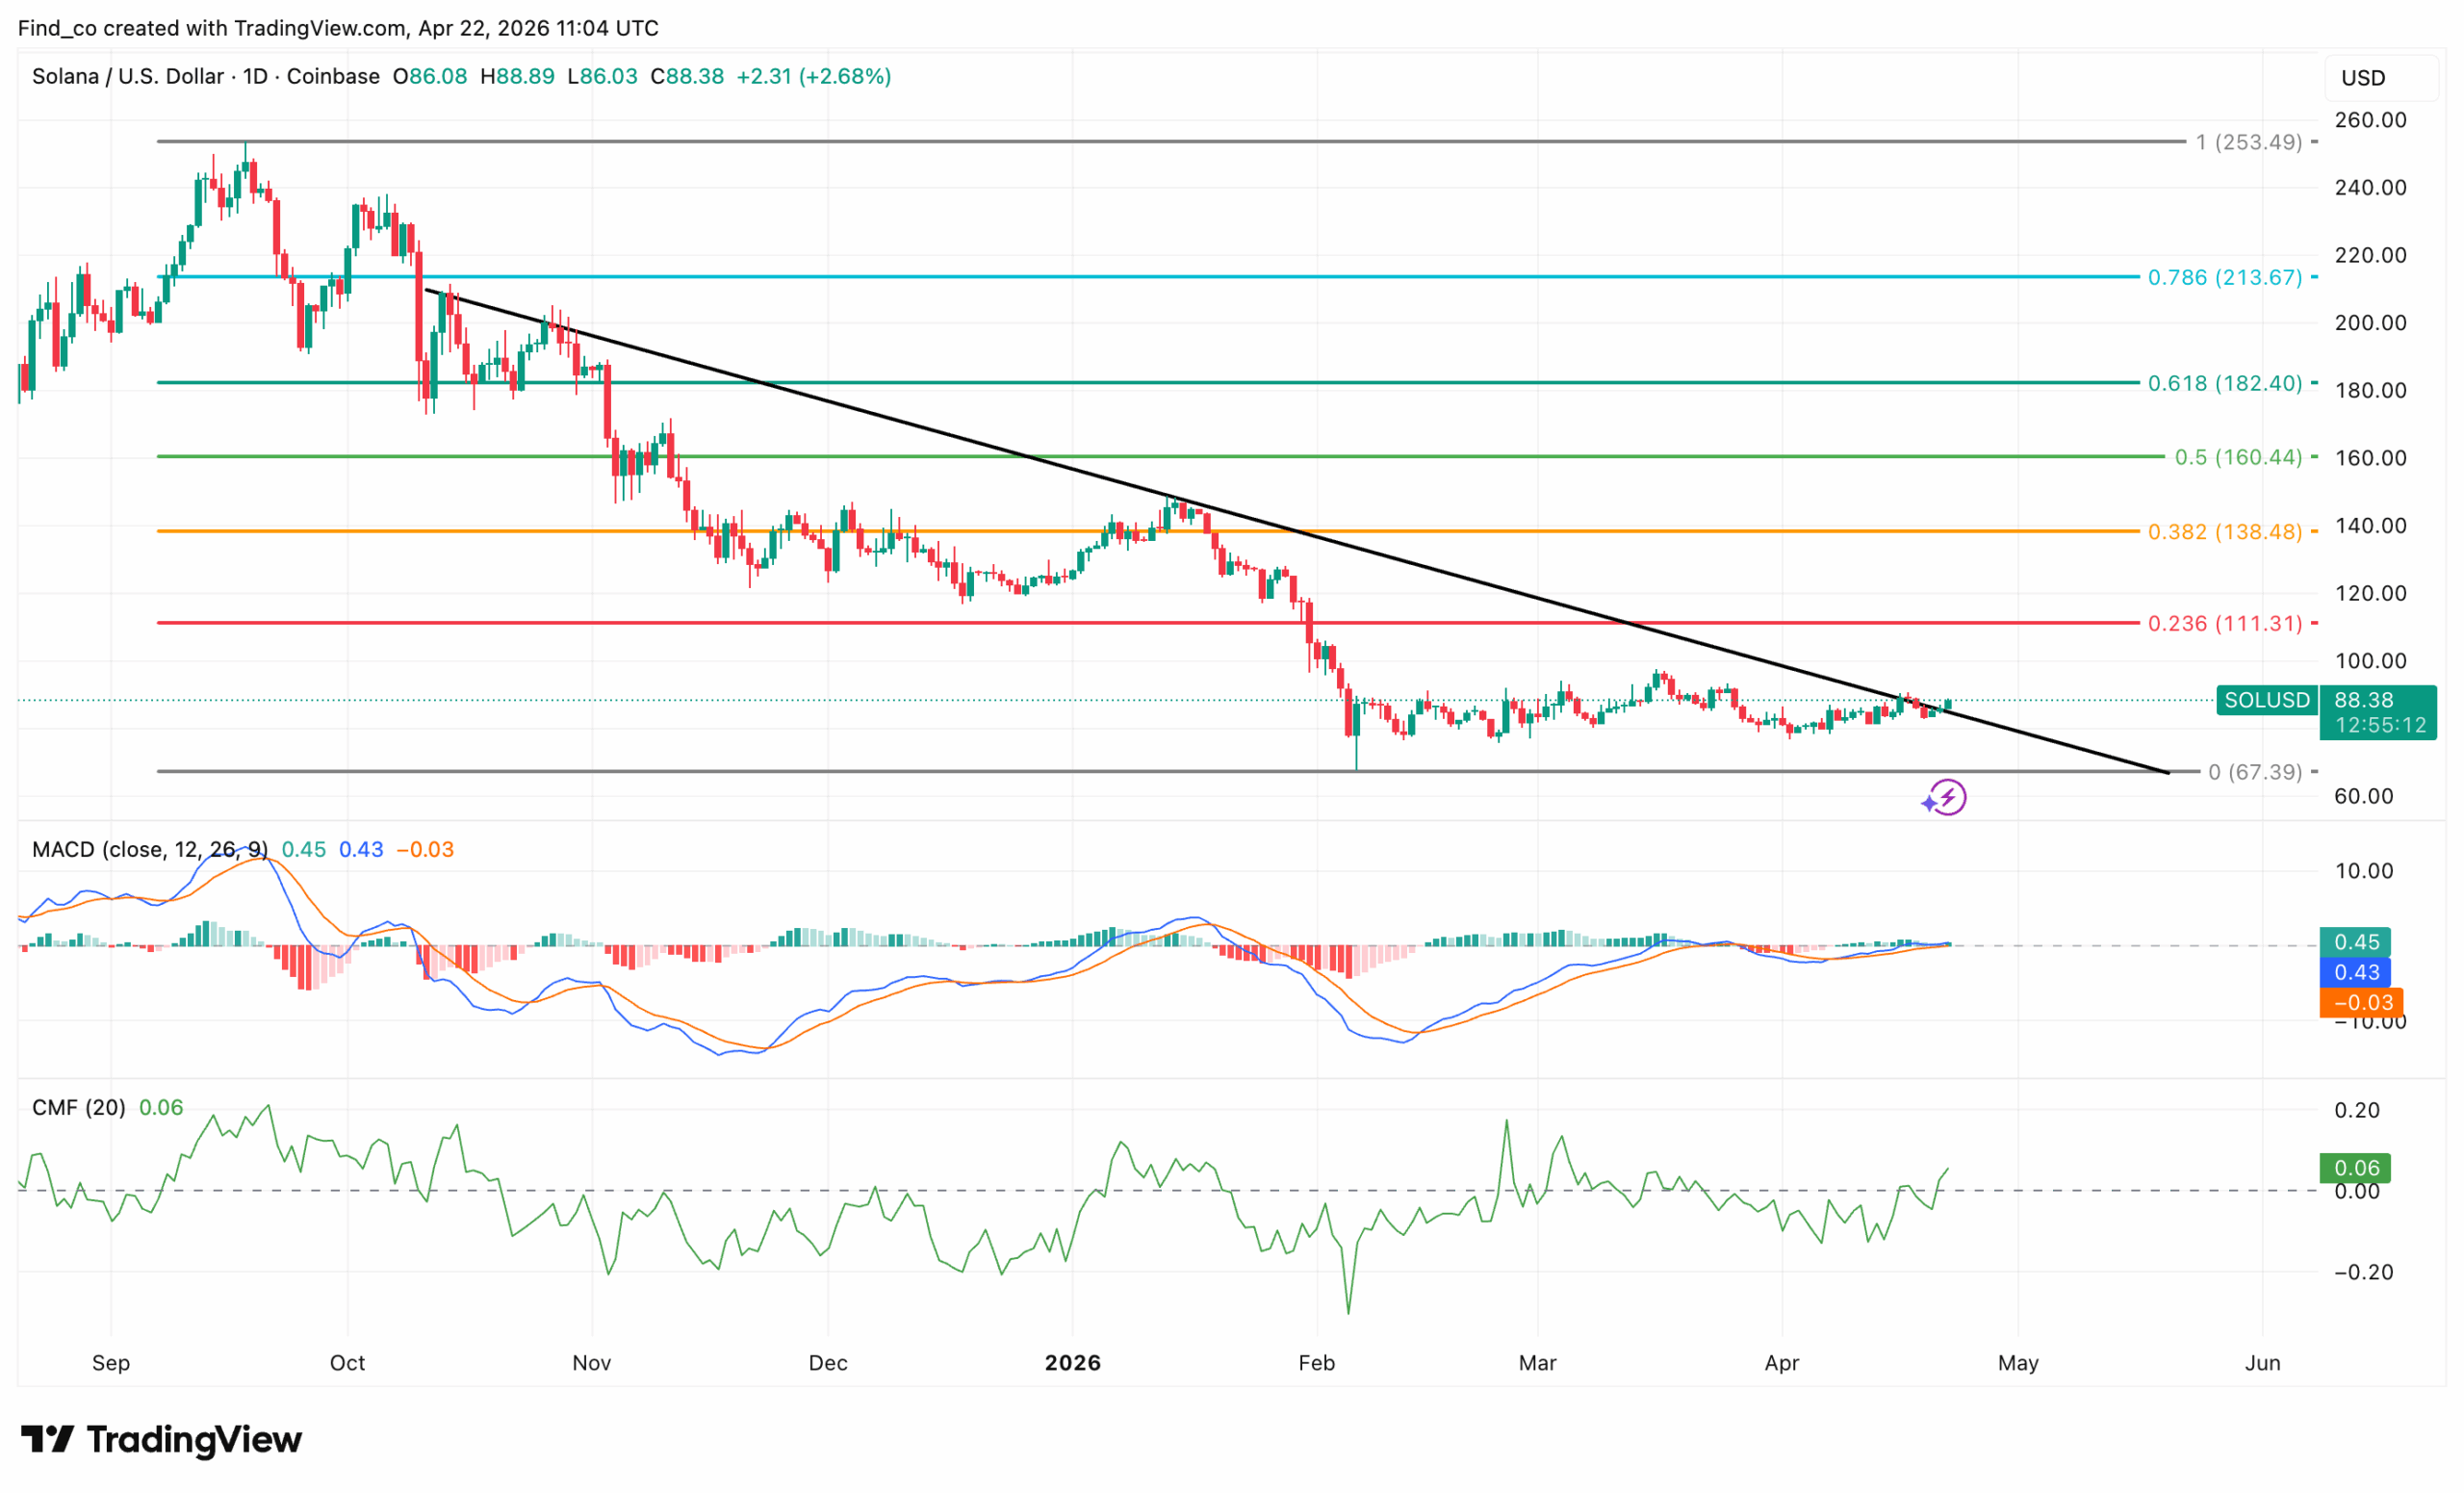
On the daily chart, Solana shows early signs of stabilization and is leaving the broader bearish trend behind. Price is trading around $88, holding above the $67 support zone that previously absorbed heavy selling pressure.
That level has become a key foundation, at least in the short term, as Solana’s price has broken the past descending trendline.
So far, each rebound has resulted in lower highs, reinforcing the prevailing downtrend.
That said, momentum is beginning to shift. The Moving Average Convergence Divergence (MACD) is flattening near the zero line, signaling that bearish pressure is fading.
At the same time, the Chaikin Money Flow (CMF) has turned slightly positive, indicating that capital is gradually flowing back into the market.
If buying volume increases, it could rise to $138.48. On the contrary, if bears take control, this might not happen, and instead, SOL might decline below $70.
Disclaimer:
The information provided in this article is for informational purposes only. It is not intended to be, nor should it be construed as, financial advice. We do not make any warranties regarding the completeness, reliability, or accuracy of this information. All investments involve risk, and past performance does not guarantee future results. We recommend consulting a financial advisor before making any investment decisions.
Victor Olanrewaju is a crypto analyst and reporter at CCN with deep roots in on-chain research and technical analysis. His crypto journey began in 2017, but it was the 2020 Uniswap airdrop that sparked a full-time pivot into the space.
With a foundation in copywriting, Victor honed his craft creating high-converting content for leading crypto brokers — most notably an XRP price prediction that ranked #1 on Google during the 2021 bull run.
He later joined AMBCrypto in 2022, where he combined storytelling with technical and on-chain analysis to cover key market narratives.
In 2024, he expanded his expertise at BeInCrypto, collaborating with analysts and using tools like Glassnode, Santiment, and IntoTheBlock to break down Bitcoin and altcoin trends.
At CCN, Victor covers the top cryptocurrencies, memecoins, macro shifts, blending real-time insights with deep-dive metrics.
He holds a Bachelor’s degree in Physics from the University of Ibadan, equipping him to simplify complex data for a wide audience. Follow his work or connect on LinkedIn or X.