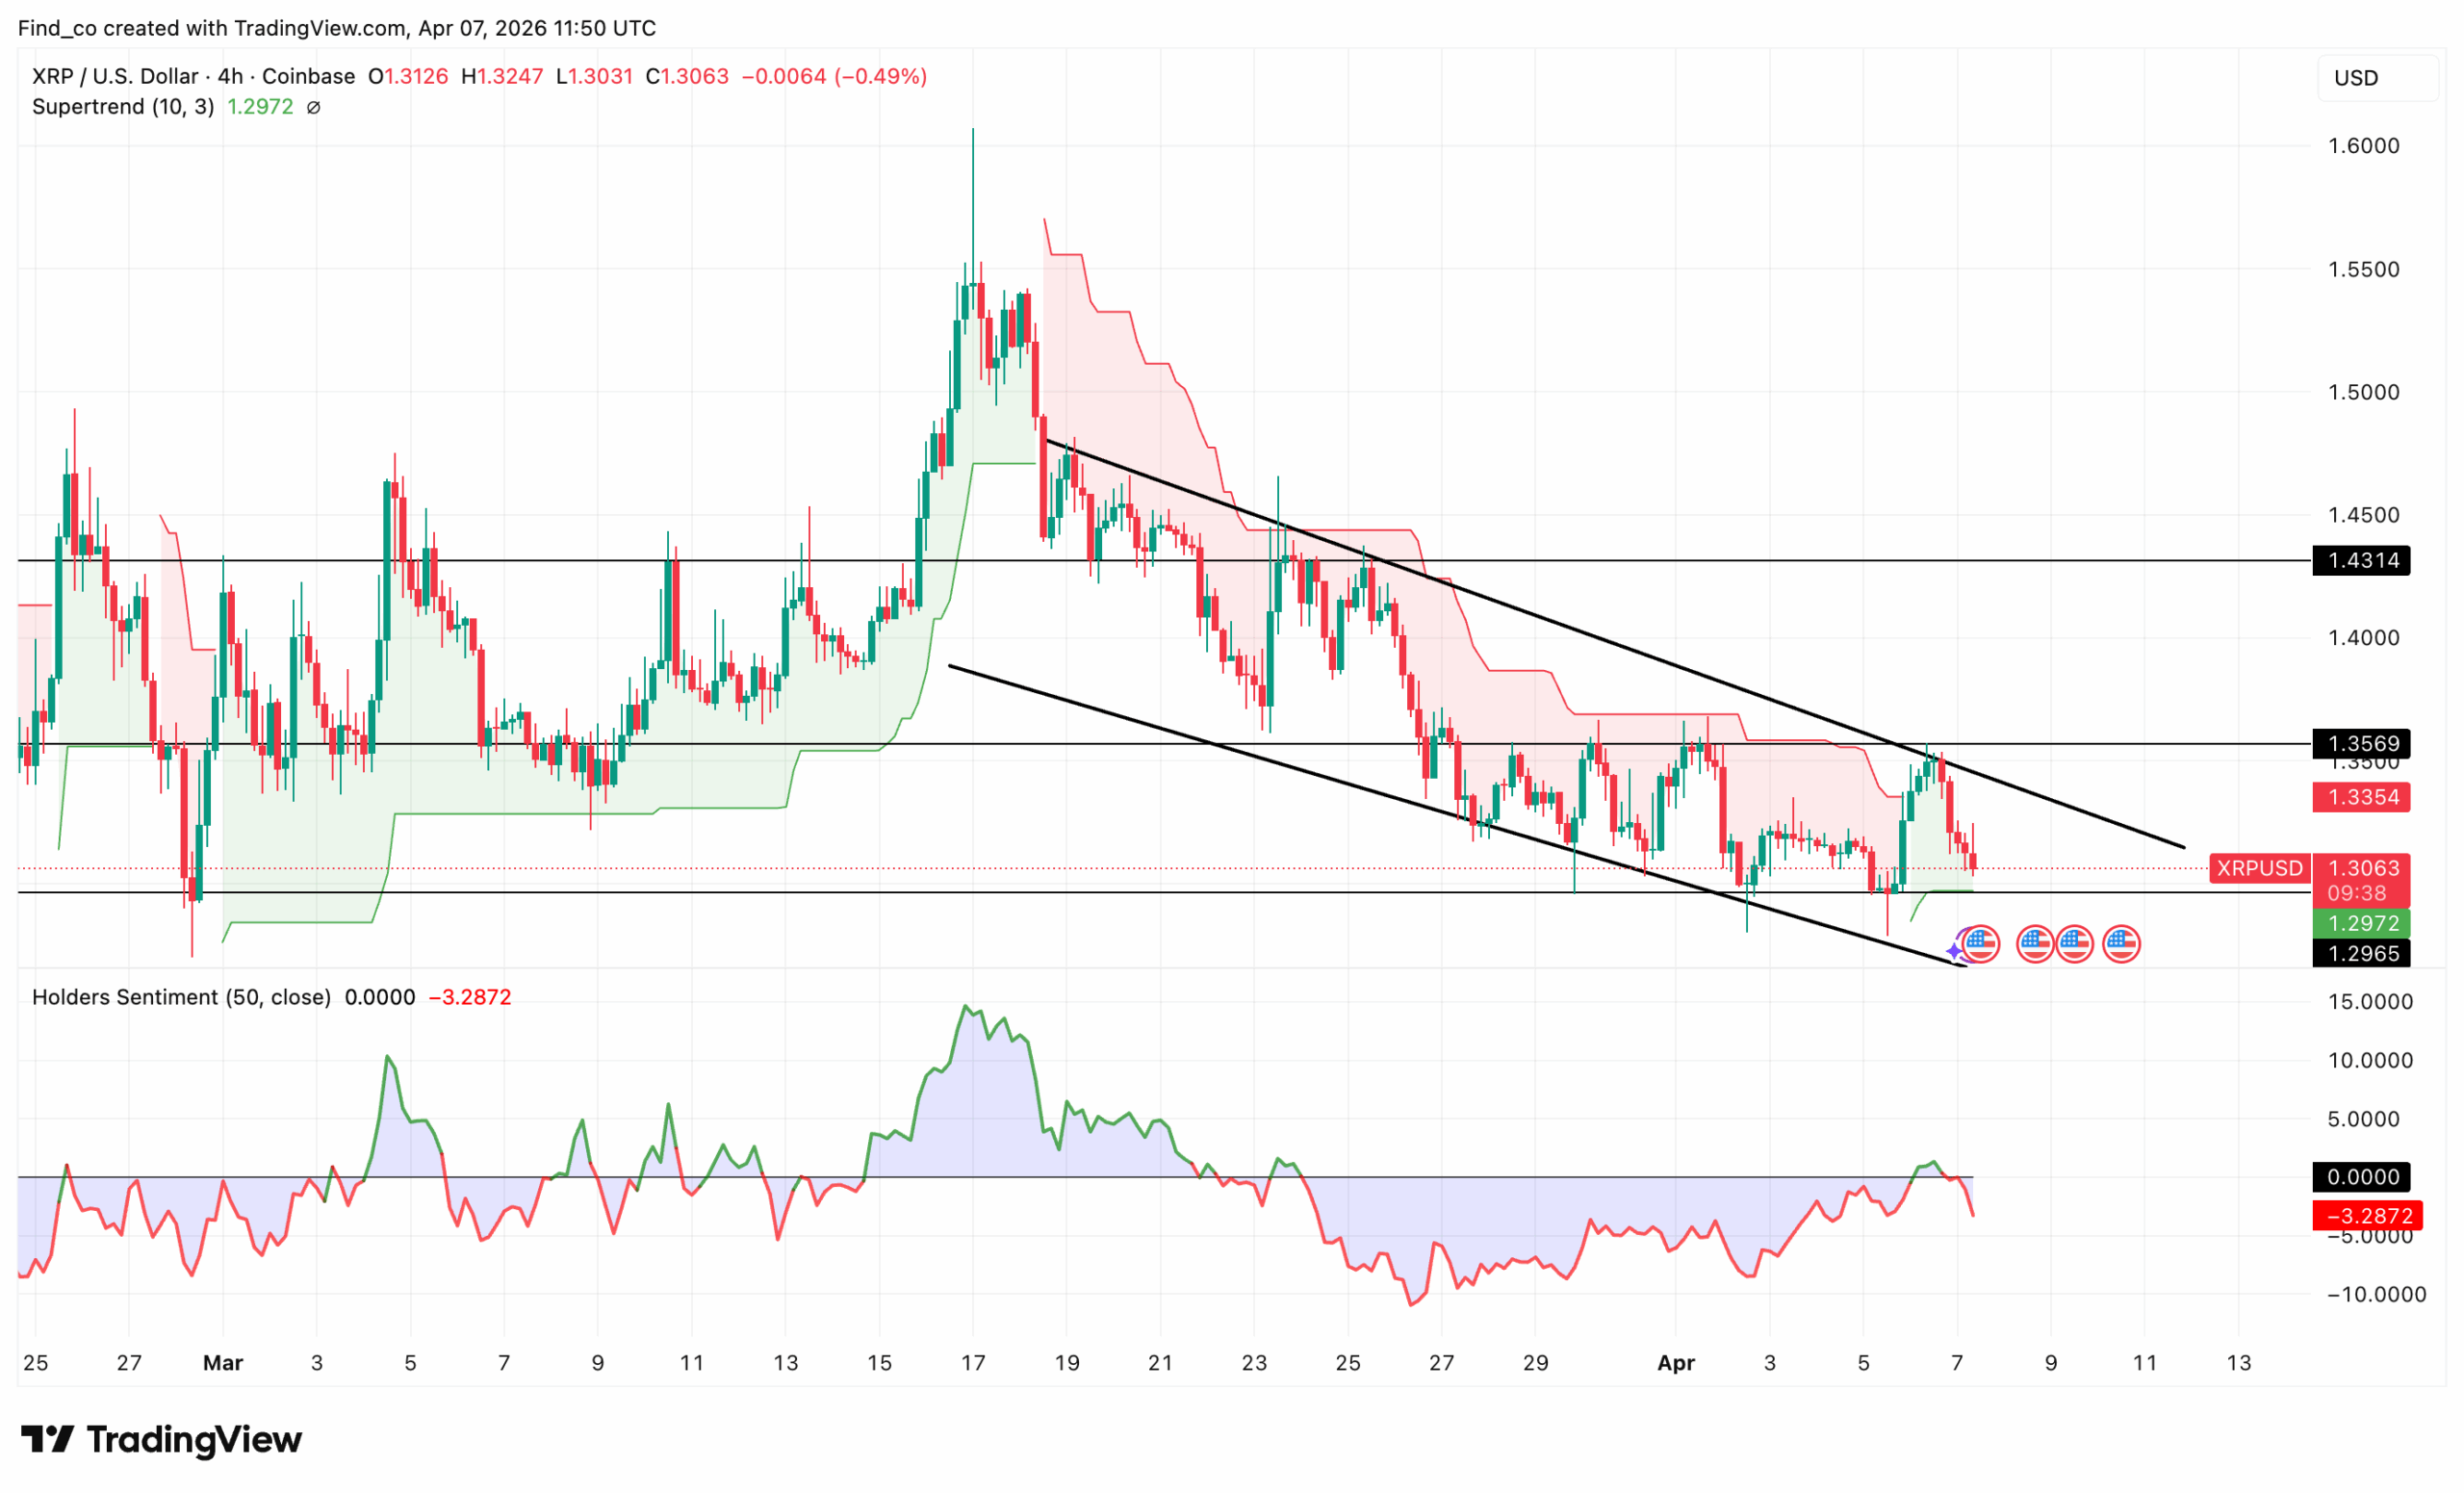
Price is currently moving within a downward channel, with the latest bounce failing near the $1.35 resistance zone.
This level aligns with both horizontal resistance and the channel’s upper boundary, reinforcing it as a key rejection area.
The Supertrend indicator also remains bearish, with the price trading below it. This confirms that the broader short-term trend remains downward.
At the same time, holders’ sentiment remains negative, sitting below the neutral line. This suggests that market confidence is still weak and that accumulation is limited.
However, XRP’s price is now approaching an important support zone near $1.30, which aligns with the channel’s lower boundary.
This area has been held multiple times and is now acting as a critical level for the next move.
Looking ahead, if XRP holds above this support and breaks above $1.36, it could trigger a short-term recovery toward $1.43.
A move beyond this level would weaken the bearish structure and signal a potential trend shift.
On the downside, a breakdown below $1.29 would confirm continuation of the downtrend. In that scenario, XRP’s price could drop toward $1.25 and potentially lower, as the channel structure remains intact.
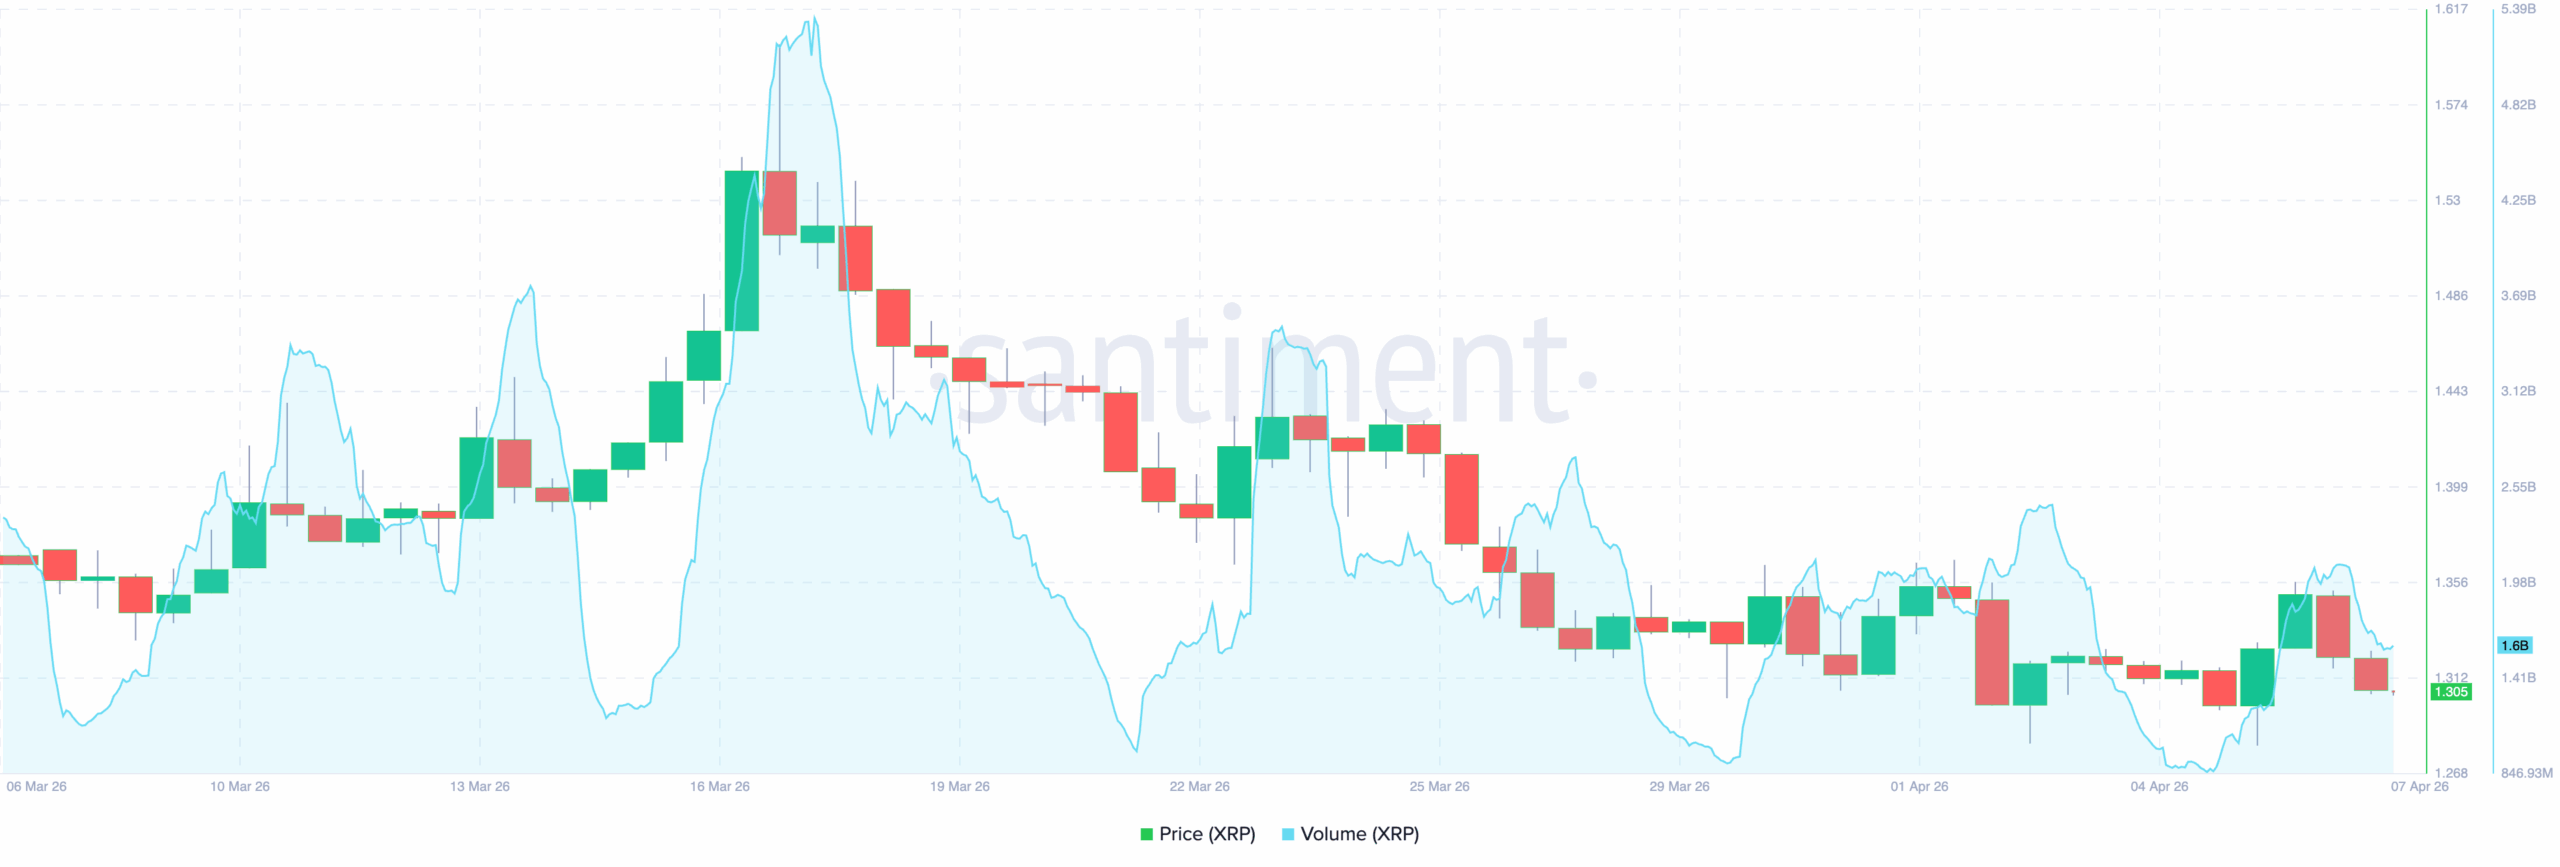
Volume Remains Flat
Outside that, XRP saw a strong push in mid-March, supported by a clear spike in volume.
This confirmed strong participation and helped drive the price toward local highs. However, that momentum did not last.
As the price began to decline, the trading volume also started to drop. As such, it failed to retest $2 billion.
More recently, XRP’s price has moved sideways with lower volatility. At the same time, volume has remained relatively muted, with only brief spikes.
This indicates a lack of strong demand to push prices higher.
The latest candles also show rejection near short-term highs, followed by declining volume. This suggests that buyers are stepping back, while sellers are gradually regaining control.
Looking ahead, if volume continues to weaken, XRP is likely to remain in consolidation or drift lower.
A break below recent support near the $1.30 zone could trigger further downside.
However, if a new volume surge appears alongside a breakout above recent highs, momentum could quickly return.
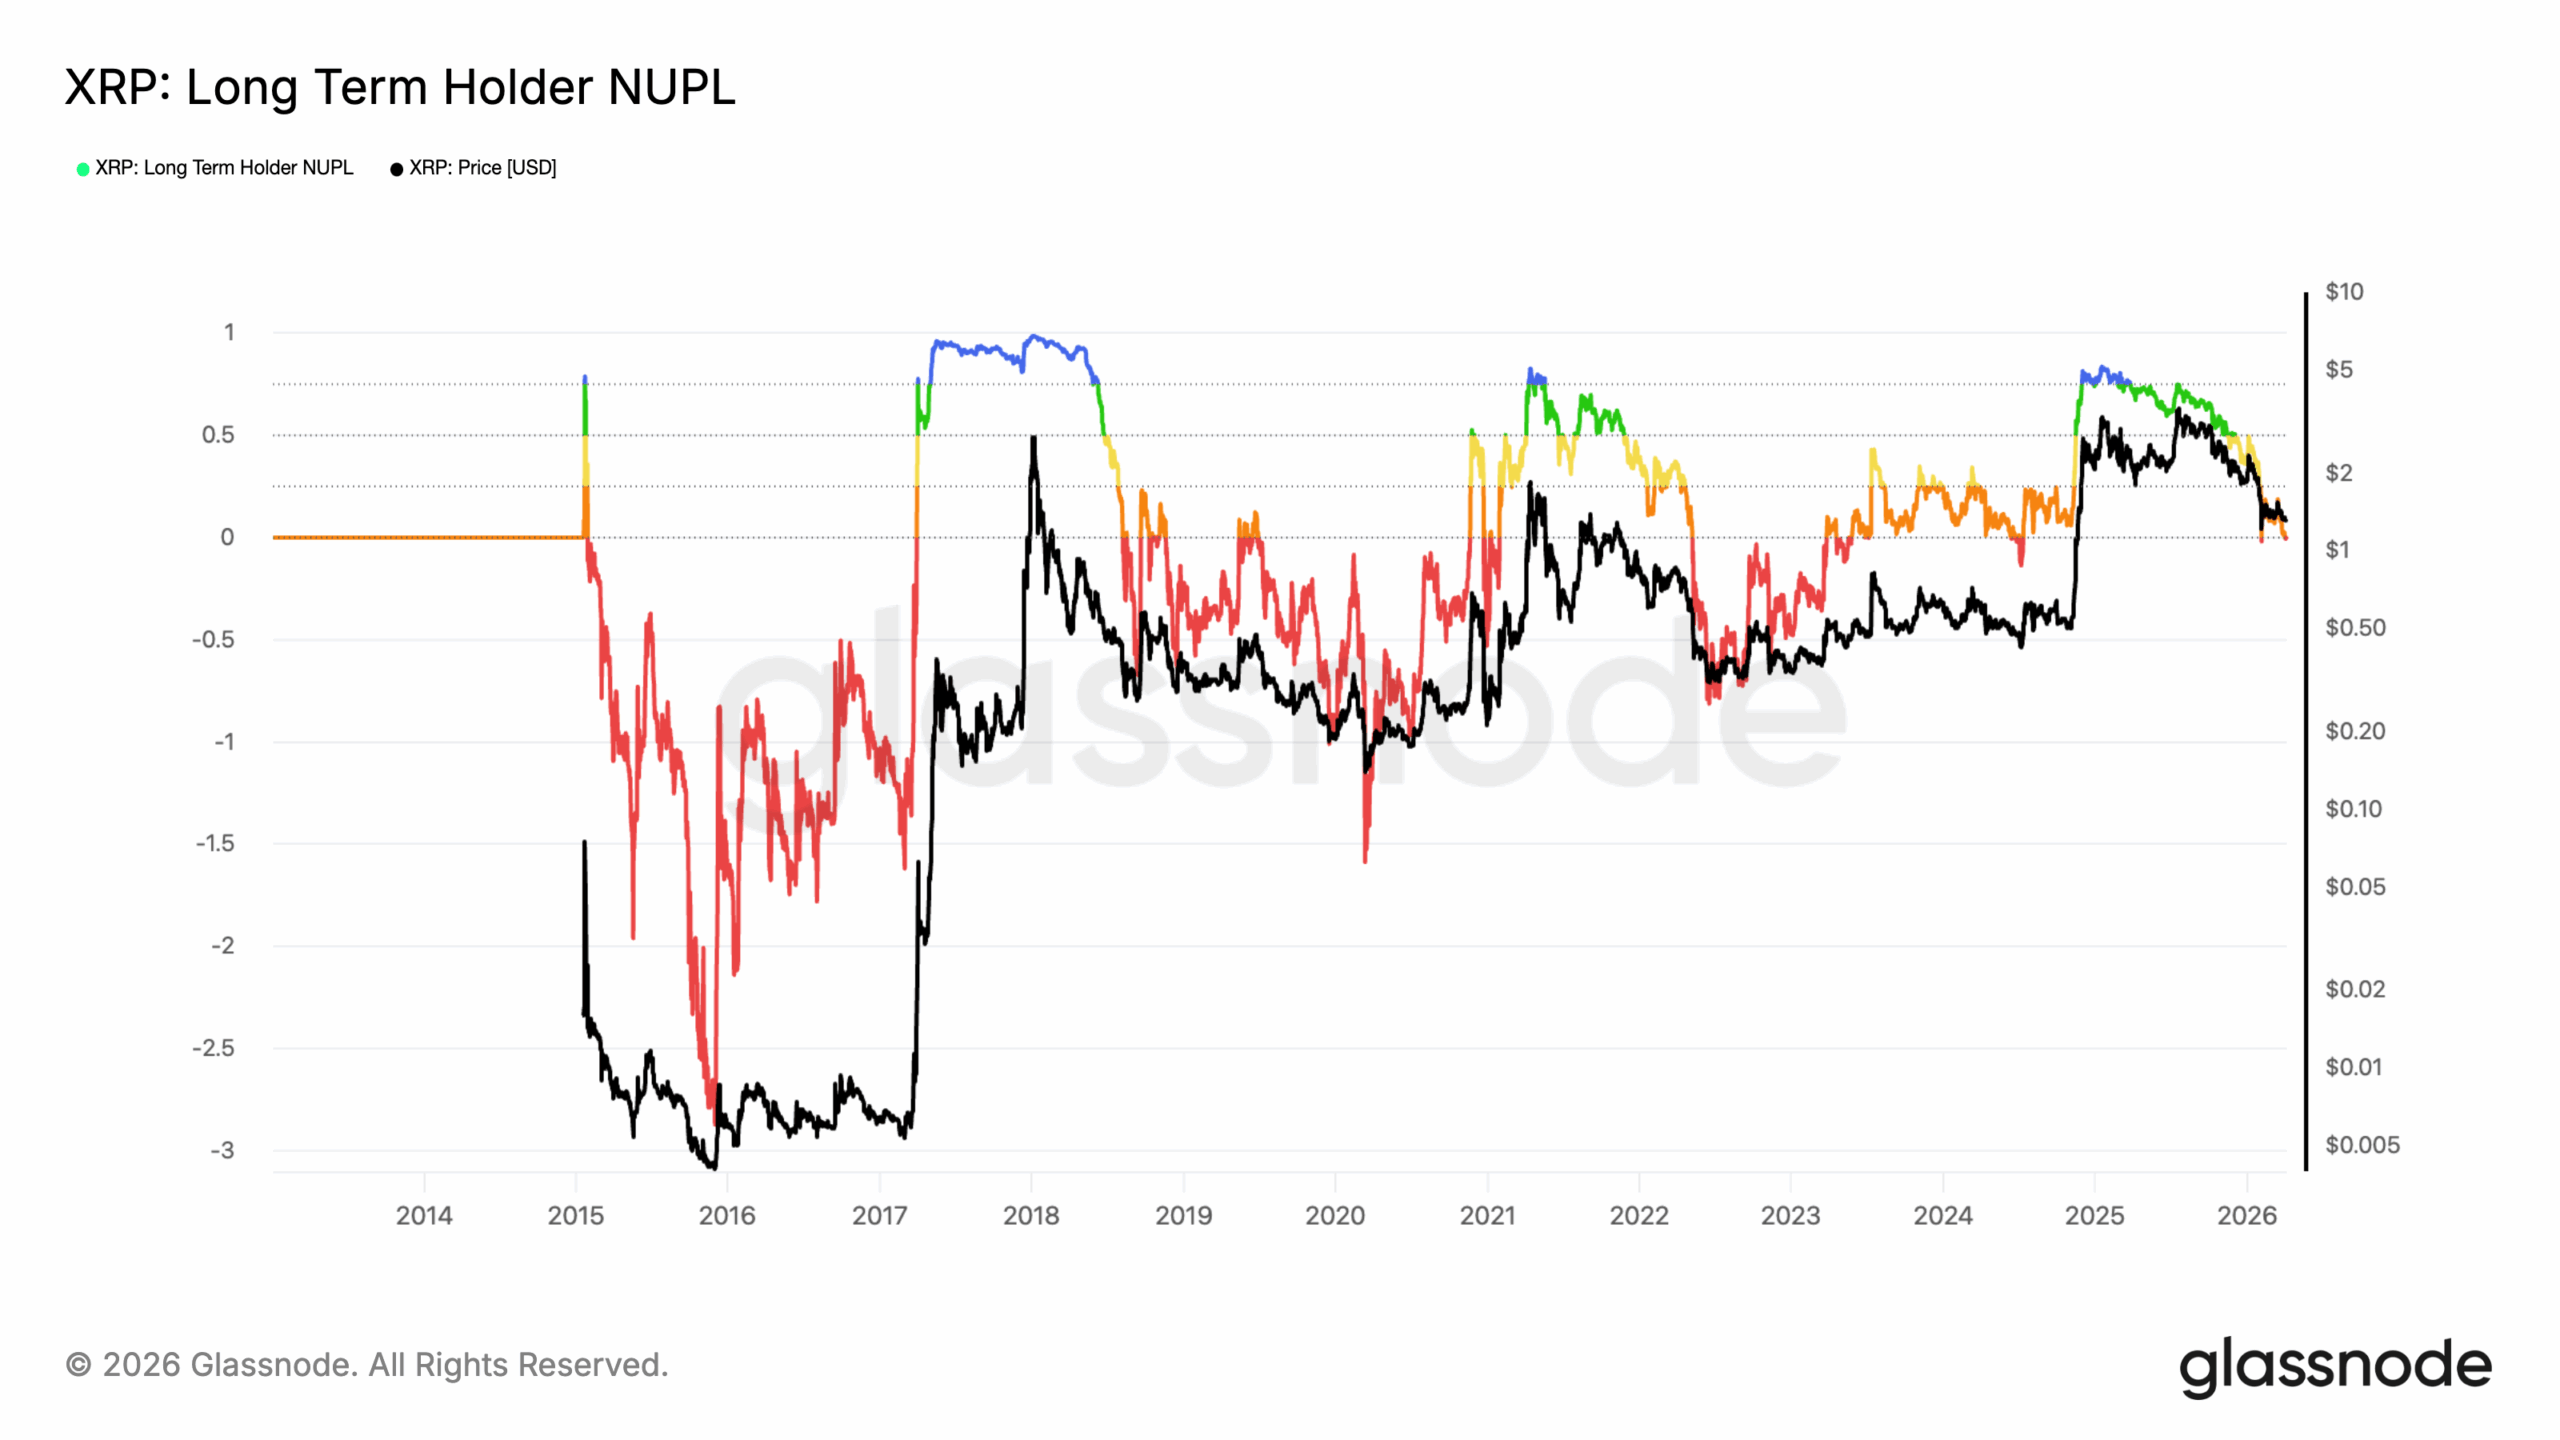
What On-Chain Data Shows
Meanwhile, the Long-Term Holder NUPL (Net Unrealized Profit/Loss) shows that XRP holders are still in profit. But sentiment has clearly declined from recent highs.
The metric has dropped from the “belief” zone into a more neutral range, indicating that long-term holders are beginning to reduce confidence.
Historically, this marks a transition phase rather than a strong bullish continuation.
At the same time, XRP’s price action reflects this hesitation. XRP recently climbed toward the $2 range (on the macro chart), but has since started to pull back.
Importantly, the current NUPL level is still above zero. This means most long-term holders remain in profit. However, it also increases the risk of distribution.
Looking back at historical patterns, similar NUPL declines have often led to sideways movement or extended pullbacks rather than immediate reversals to new highs.
In the near term, this supports the bearish signals seen on lower timeframes. Therefore, XRP’s price may remain under pressure unless sentiment stabilizes.
However, this is not a full bearish reset yet. For a major accumulation phase to begin, NUPL would typically fall much lower, reflecting fear or capitulation. However, that has not happened.
XRP Price Forecast
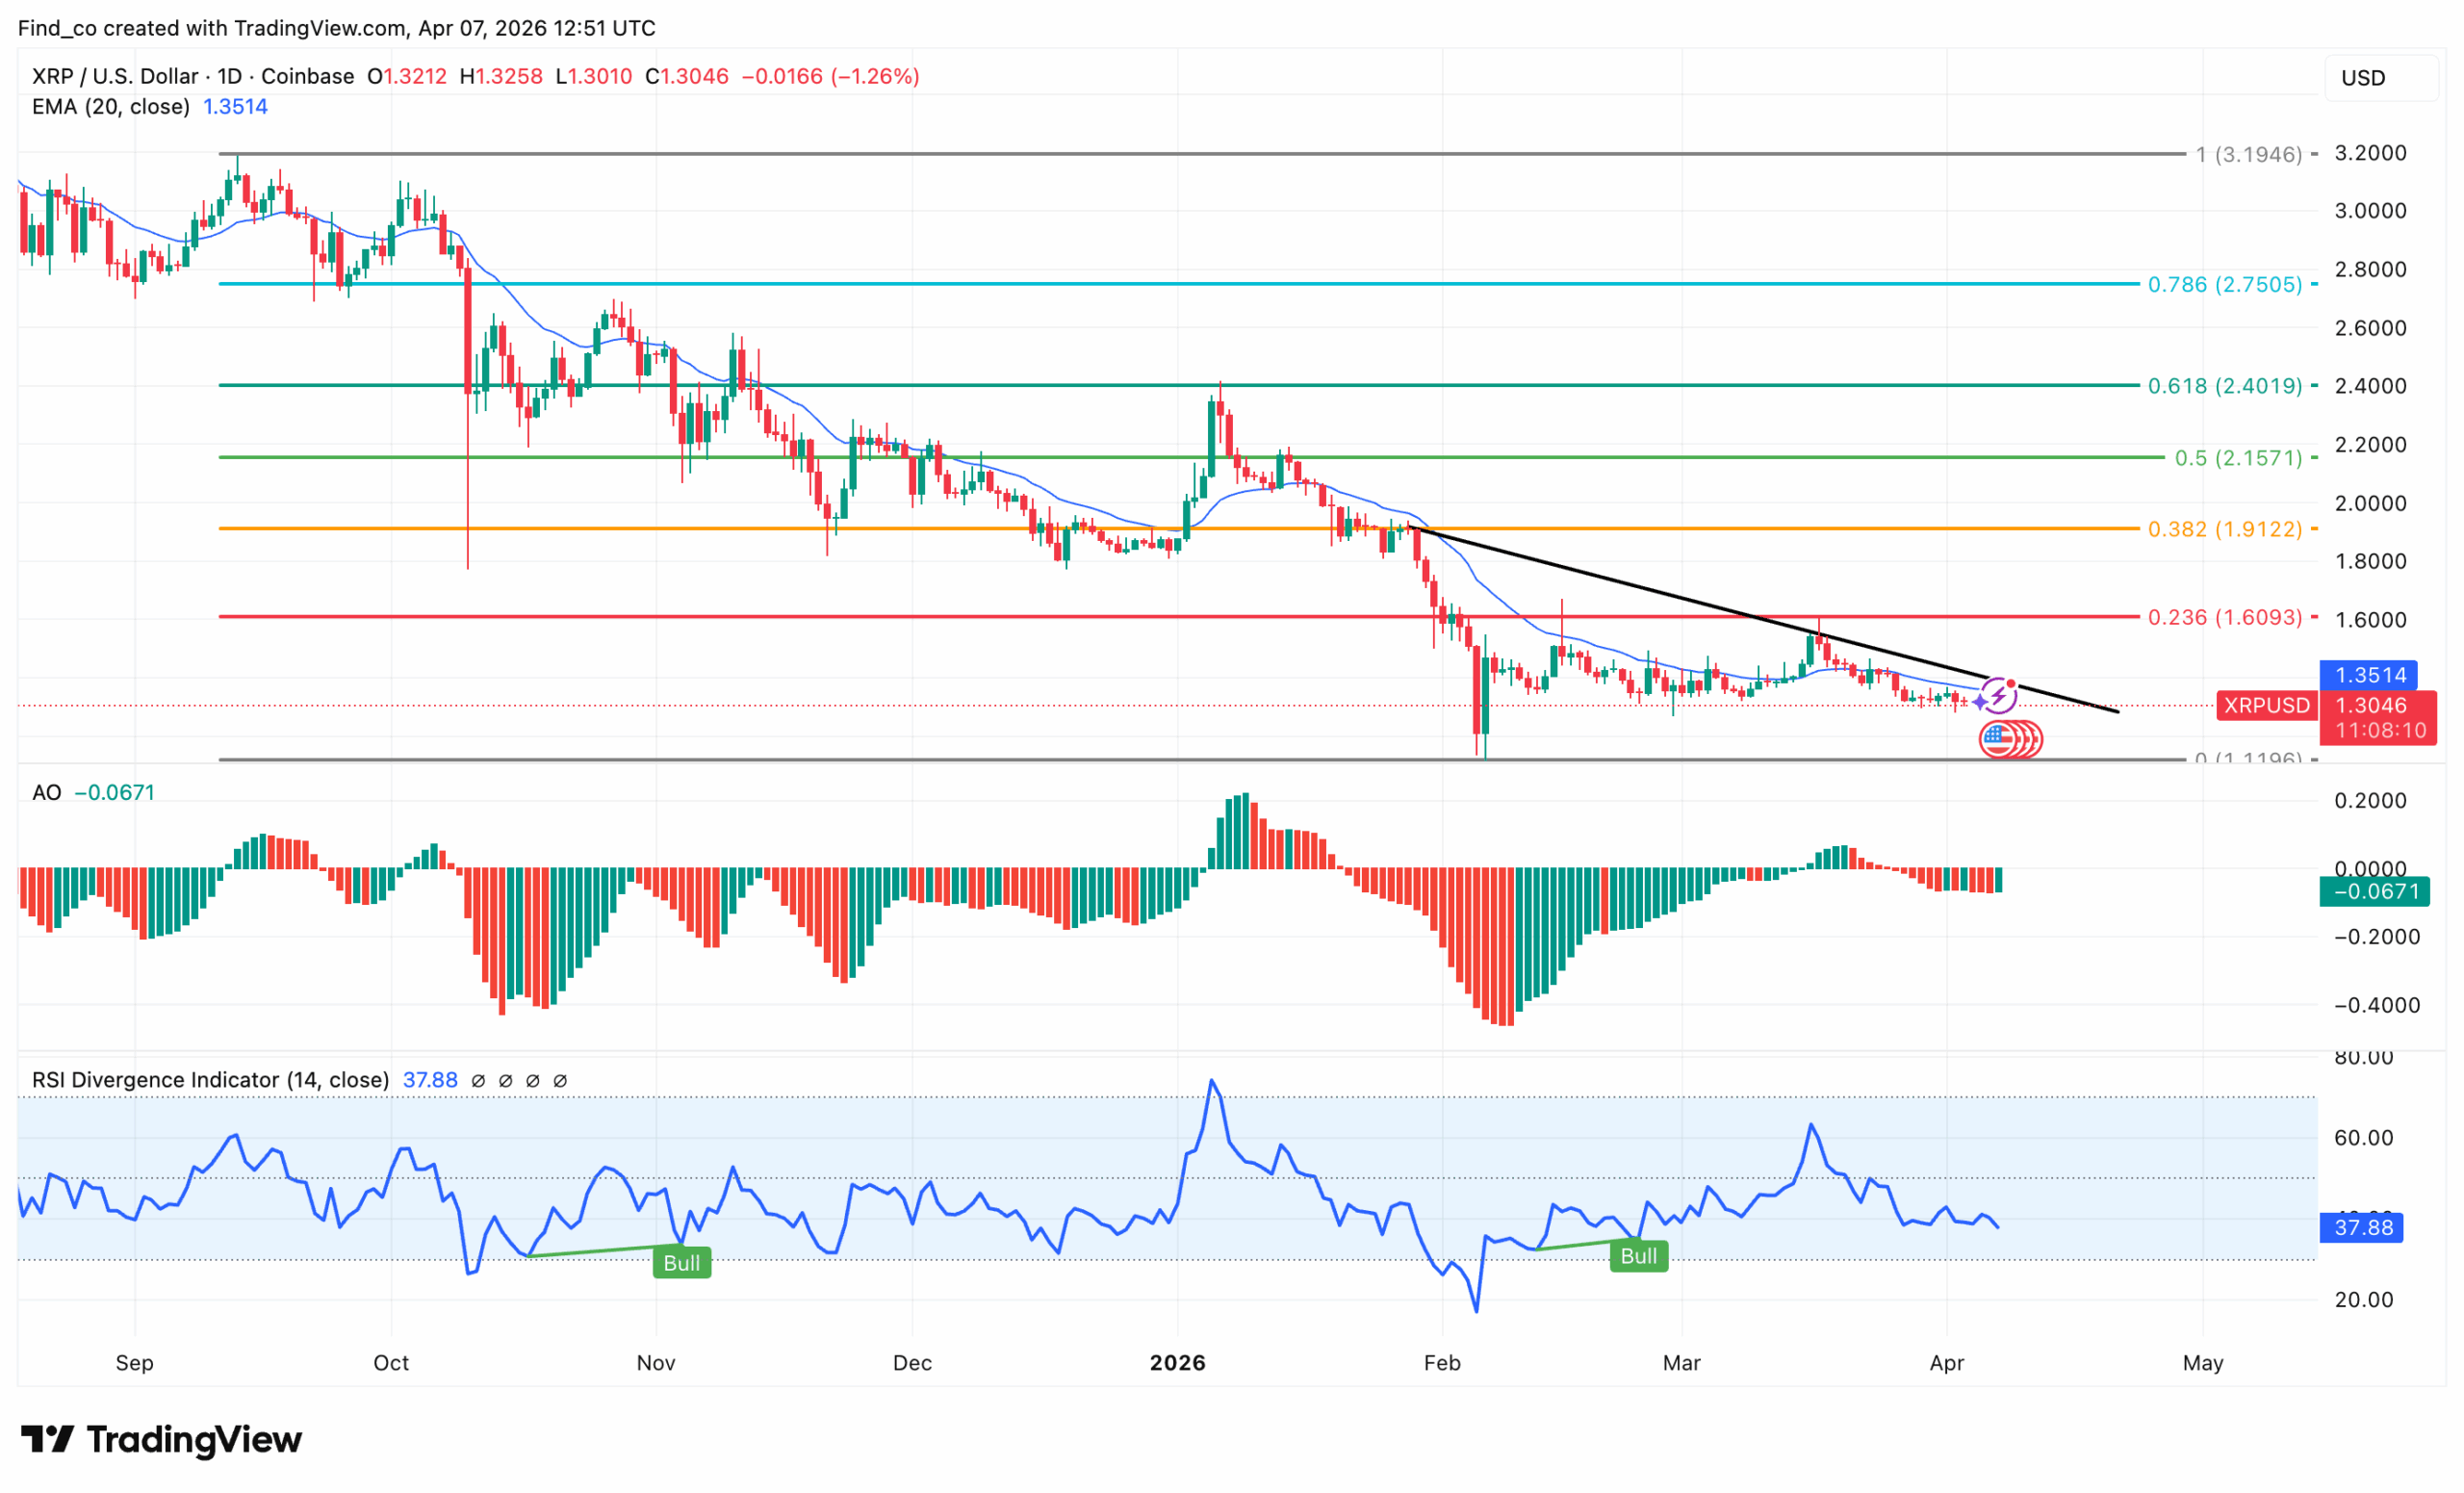
On the daily chart, XRP remains in a broader downtrend, with the price struggling to hold key resistance levels and momentum still weak.
Price is currently trading around $1.30, below the 20-day EMA near $1.35, which continues to act as dynamic resistance.
Fibonacci levels highlight the key barriers ahead. The $1.60 zone (0.236 Fib) remains the first major resistance, followed by $1.91.
Until these levels are reclaimed, upside attempts are likely to face rejection.
Momentum indicators also show weakness. The Awesome Oscillator (AO) remains negative, while RSI sits near 38, indicating limited buying strength despite minor bullish divergence signals.
Disclaimer:
The information provided in this article is for informational purposes only. It is not intended to be, nor should it be construed as, financial advice. We do not make any warranties regarding the completeness, reliability, or accuracy of this information. All investments involve risk, and past performance does not guarantee future results. We recommend consulting a financial advisor before making any investment decisions.
Victor Olanrewaju is a crypto analyst and reporter at CCN with deep roots in on-chain research and technical analysis. His crypto journey began in 2017, but it was the 2020 Uniswap airdrop that sparked a full-time pivot into the space.
With a foundation in copywriting, Victor honed his craft creating high-converting content for leading crypto brokers — most notably an XRP price prediction that ranked #1 on Google during the 2021 bull run.
He later joined AMBCrypto in 2022, where he combined storytelling with technical and on-chain analysis to cover key market narratives.
In 2024, he expanded his expertise at BeInCrypto, collaborating with analysts and using tools like Glassnode, Santiment, and IntoTheBlock to break down Bitcoin and altcoin trends.
At CCN, Victor covers the top cryptocurrencies, memecoins, macro shifts, blending real-time insights with deep-dive metrics.
He holds a Bachelor’s degree in Physics from the University of Ibadan, equipping him to simplify complex data for a wide audience. Follow his work or connect on LinkedIn or X.