XRP flirts with resistance after bouncing from support | Credit: Hameem Sarwar
Share
Key Takeaways
XRP is bouncing inside a falling channel, but it still looks range-bound.
XRP may struggle to break $2 because the Parabolic SAR is still above the price.
XRP can hit $2.13 if momentum improves, but here’s why it could slip to $1.77.
XRP’s price action is starting to resemble a bottoming phase after months of sideways movement.
Still, that doesn’t mean the trend has turned entirely bullish, driving it to multi-month highs.
While the downside momentum appears to be weak, XRP still trades below levels that typically mark a healthy uptrend, making this more of a warning than a victory.
So, what’s next for XRP’s price? Let’s analyze it.
XRP Sellers Shows Signs of Fatigue
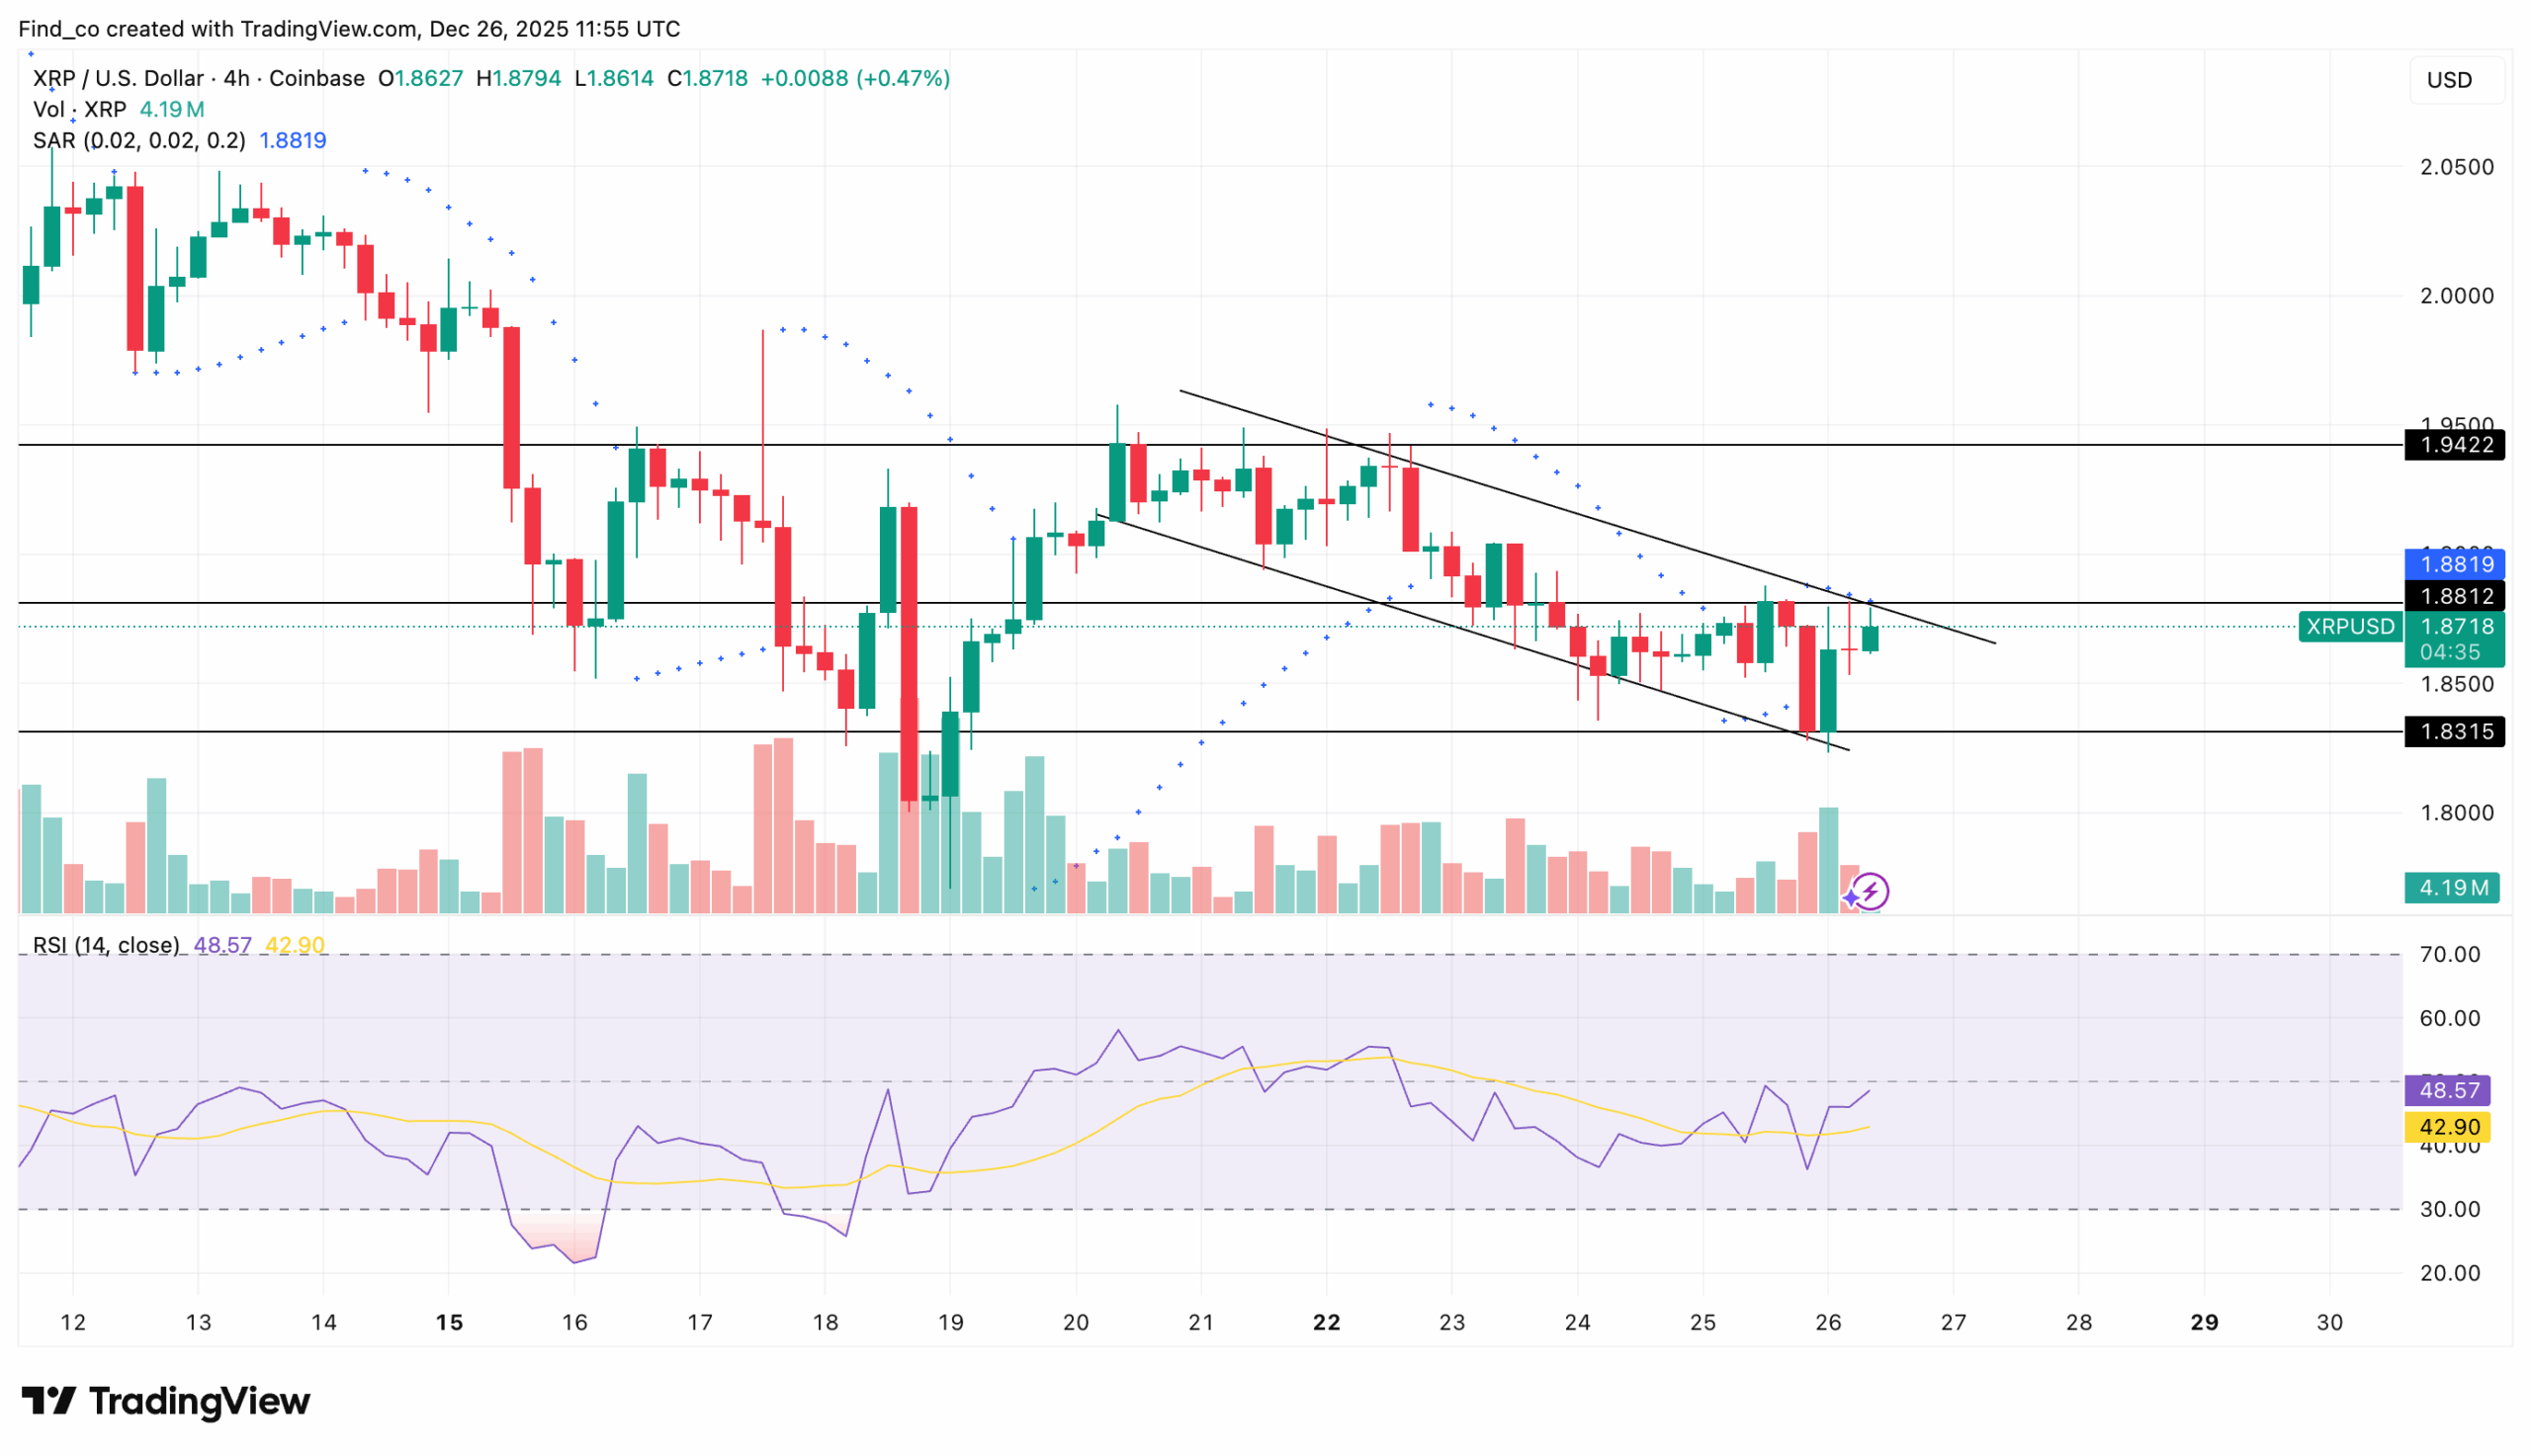
A look at the 4-hour chart shows that XRP’s price is confined in a falling channel. However, the altcoin has bounced off the lower trendline, suggesting that the month-long correction could be over.
As a result of this bounce, XRP is now flirting with the upper trendline of the descending channel.
If sustained, the altcoin will likely test the resistance at $1.88. Once that happens, the next target for the altcoin could be the overhead point of interest at $1.94.
Despite the stable technical setup, several indicators reveal that XRP might not break above $2 yet.
One reason for this is the Relative Strength Index (RSI), which measures momentum by analyzing the speed and magnitude of price changes.
As seen below, the RSI is yet to break above the neutral line. As long as this remains the same, XRP’s price may continue to consolidate between $1.83 and $1.94.
Besides the RSI, the Parabolic Stop And Reverse (SAR) indicator is above the price, indicating resistance. Should that trend hold, the altcoin might remain range-bound.
Signals Say Something’s Changing
Meanwhile, XRP’s Market Value to Realized Value (MVRV) ratio has dropped to 1.26, signaling that average holder profitability has narrowed compared with earlier in the cycle.
Historically, XRP’s price has bounced when the MVRV falls within the 1.13 to 1.99 range, suggesting the asset may be entering a zone where the downside becomes less attractive and dip-buying interest returns.
That said, MVRV is not a timing tool. While the metric can highlight conditions that precede rebounds, follow-through still depends on whether demand and broader market sentiment improve.
Momentum indicators remain hesitant, with the Moving Average Convergence Divergence (MACD) failing to flip decisively into positive territory.
In fact, the MACD is beginning to hint at bearish divergence versus price action, suggesting that while XRP’s price is attempting to press higher, underlying momentum is not strengthening at the same pace.
This setup implies that any break above resistance may be difficult to sustain in the near term, keeping XRP vulnerable to continued consolidation rather than an immediate trend reversal.
If buying pressure intensifies and momentum confirms the move, XRP’s price could attempt a push toward $1.99. In a more bullish continuation scenario, the token may extend toward $2.13.
However, if bearish pressure reasserts itself and demand remains weak, XRP risks sliding back toward $1.77
Disclaimer:
The information provided in this article is for informational purposes only. It is not intended to be, nor should it be construed as, financial advice. We do not make any warranties regarding the completeness, reliability, or accuracy of this information. All investments involve risk, and past performance does not guarantee future results. We recommend consulting a financial advisor before making any investment decisions.
Victor Olanrewaju is a crypto analyst and reporter at CCN with deep roots in on-chain research and technical analysis. His crypto journey began in 2017, but it was the 2020 Uniswap airdrop that sparked a full-time pivot into the space.
With a foundation in copywriting, Victor honed his craft creating high-converting content for leading crypto brokers — most notably an XRP price prediction that ranked #1 on Google during the 2021 bull run.
He later joined AMBCrypto in 2022, where he combined storytelling with technical and on-chain analysis to cover key market narratives.
In 2024, he expanded his expertise at BeInCrypto, collaborating with analysts and using tools like Glassnode, Santiment, and IntoTheBlock to break down Bitcoin and altcoin trends.
At CCN, Victor covers the top cryptocurrencies, memecoins, macro shifts, blending real-time insights with deep-dive metrics.
He holds a Bachelor’s degree in Physics from the University of Ibadan, equipping him to simplify complex data for a wide audience. Follow his work or connect on LinkedIn or X.