Stellar’s breakout hopes fade as XLM stays range-bound and bearish | Credit: Hameem Sarwar
Share
Key Takeaways
XLM is stuck in a tight range as buyers have refused to accumulate.
XLM remains bearish on the daily chart amid low RSI and MACD.
Here are the potential targets if bears break the $0.20 support level.
Stellar (XLM) is closing out 2025 in a defensive mode after failing to reach the widely anticipated $1 milestone.
Instead of sustaining upside momentum, XLM’s price has shed more than 35% year-to-date. This has compressed the altcoin into a narrow trading range, signaling fading bullish momentum.
With bearish momentum solid across multiple timeframes, XLM’s current structure favors consolidation over breakout.
Here’s why and what to expect from cryptocurrency in the last days of the year.
XLM Stalls in a Range
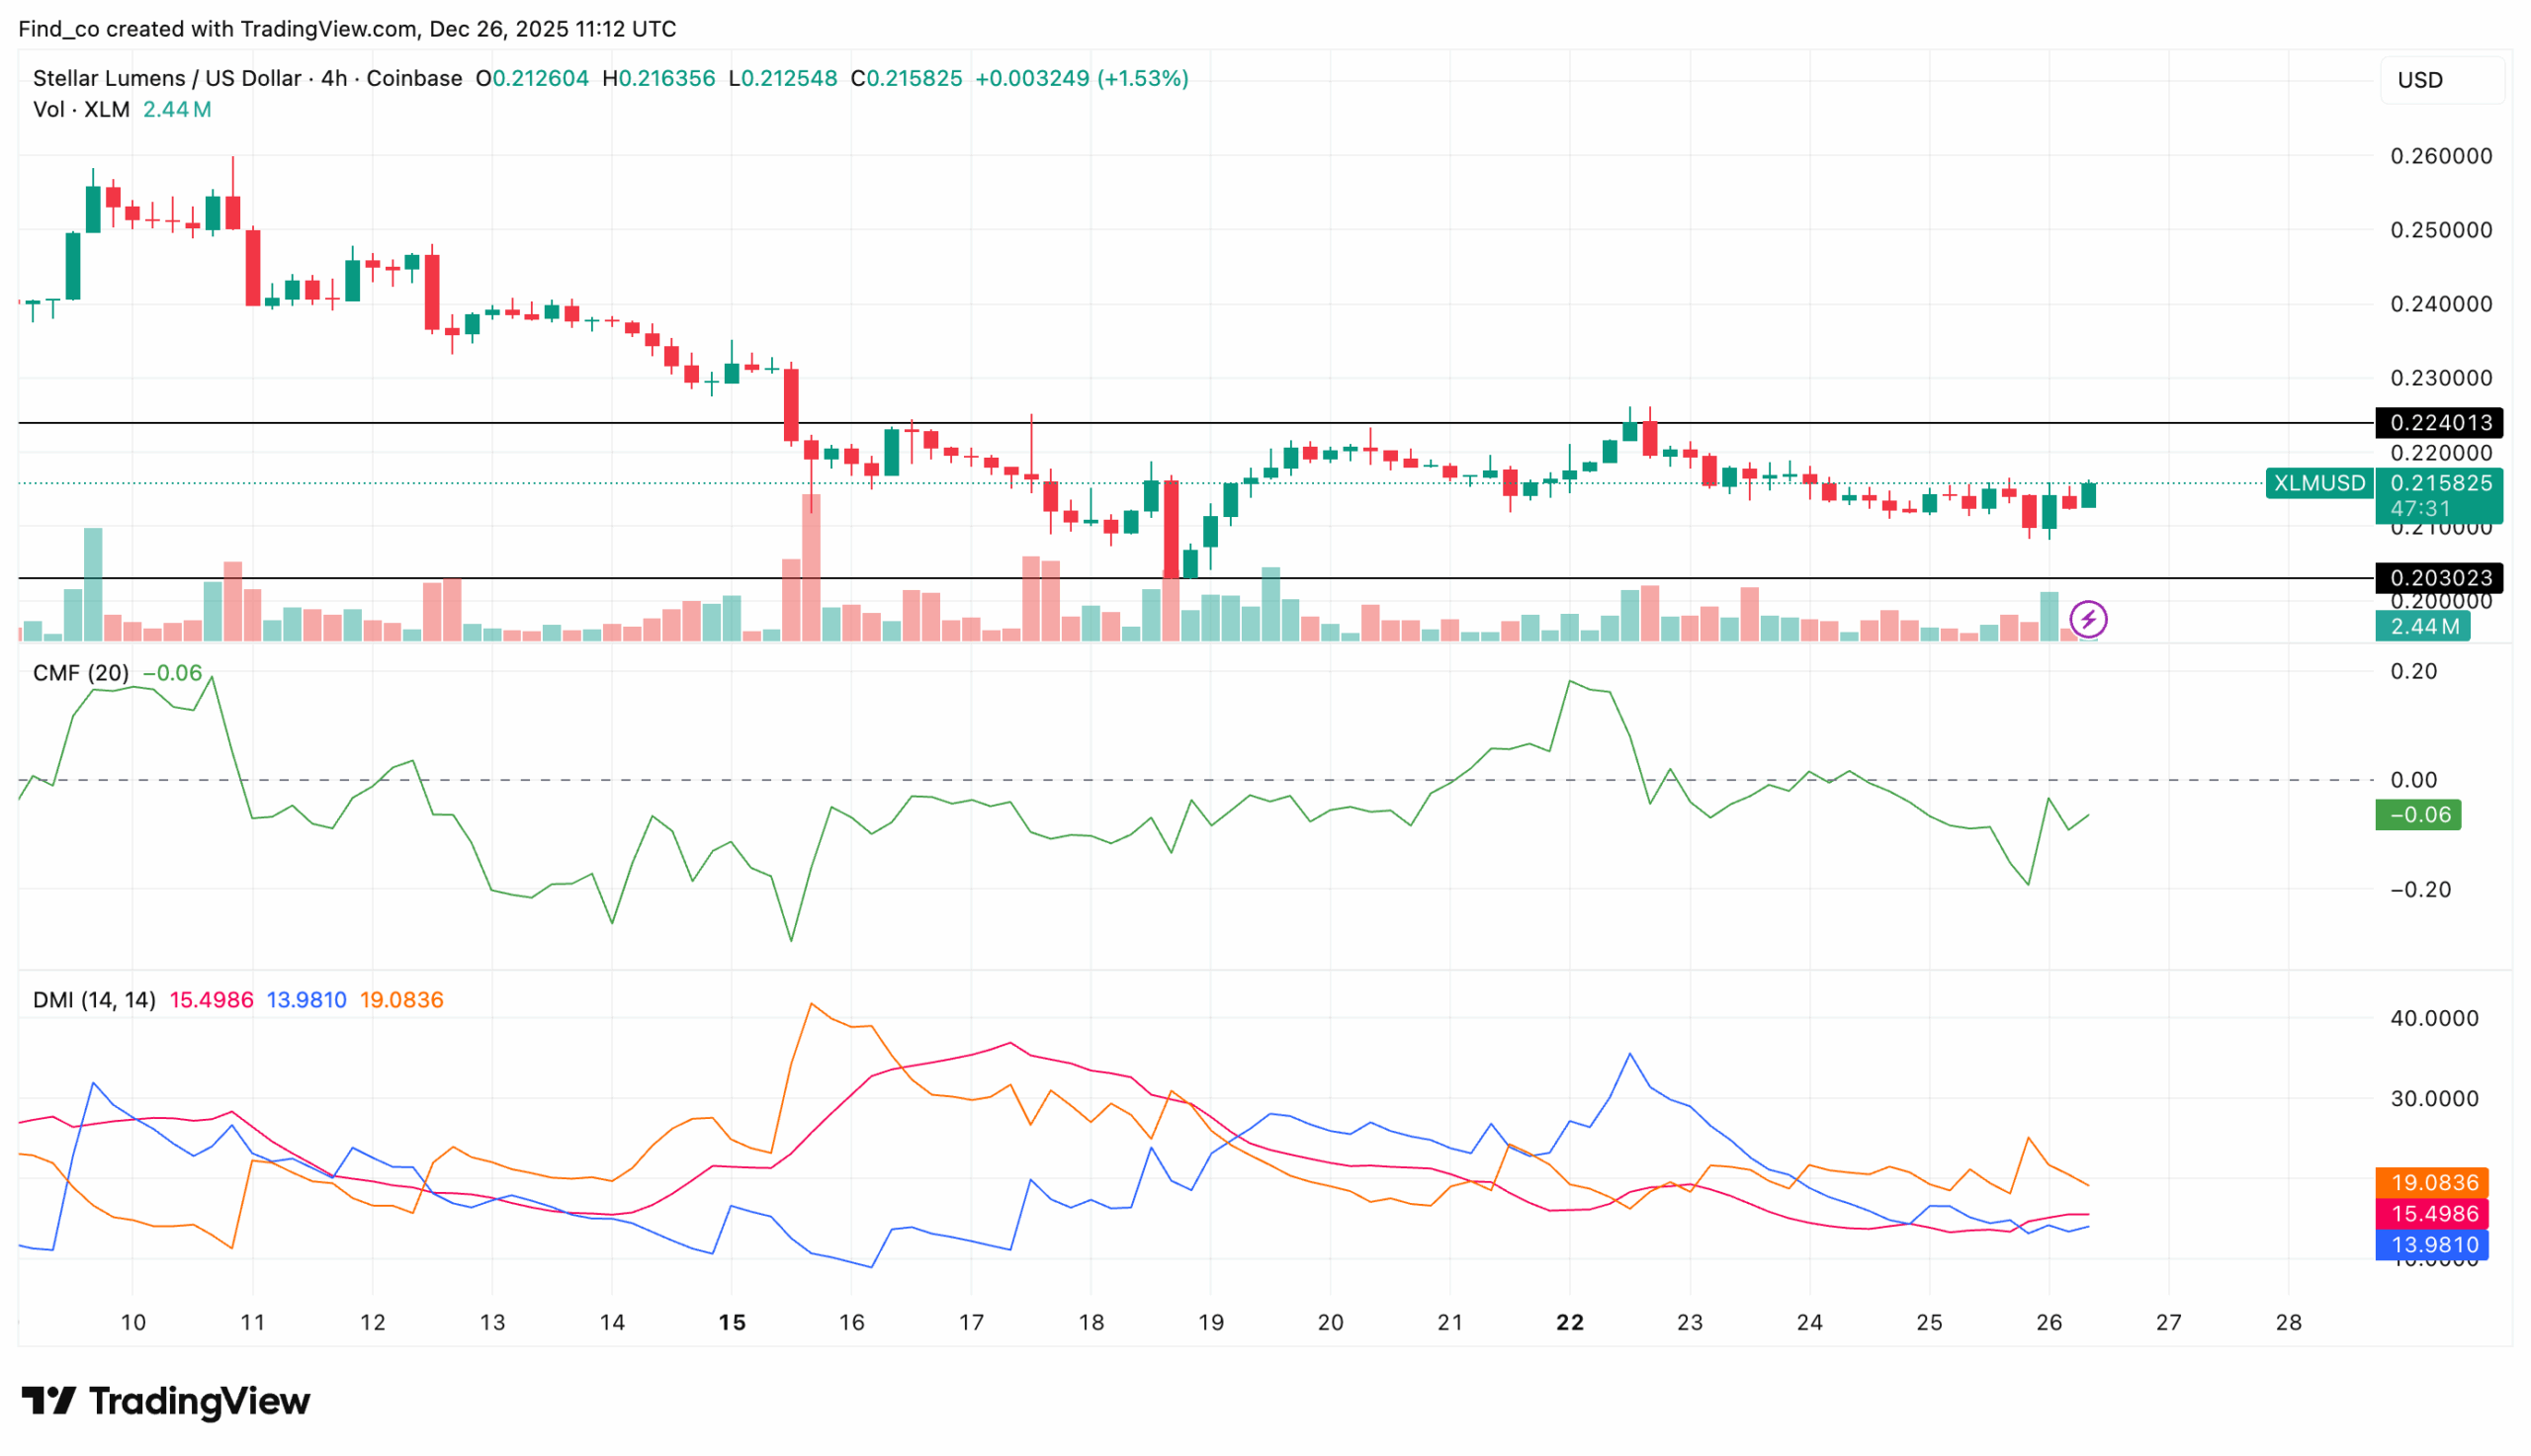
On the 4-hour chart, Chaikin Money Flow (CMF) continues to reflect a cautious setup.
The indicator remains below zero at –0.08, suggesting that outflows still outweigh inflows. This implies that recent price stability may be driven more by reduced volatility than meaningful accumulation.
Get These Top Crypto Casino Offers Now!
Sponsored
Disclosure
We sometimes use affiliate links in our content, when clicking on those we might receive a commission at no extra cost to you. By using this website you agree to our terms and conditions and privacy policy.
Directional metrics reinforce that view. The Directional Movement Index (DMI) indicates that the -DMI at 15.89 is slightly above the +DMI at 13.01, suggesting that bearish pressure still marginally prevails.
Meanwhile, the Average Directional Index (ADX) remains subdued, indicating weak trend strength and supporting the notion that XLM’s price is consolidating rather than preparing for a breakout.
Structurally, the price continues to churn between $0.21 and $0.22, with repeated failures to reclaim the $0.24 and $0.25 zone.
As long as XLM’s price remains beneath these resistance levels, upside attempts are likely to remain corrective rather than trend-changing.
Daily Chart Skews Bearish
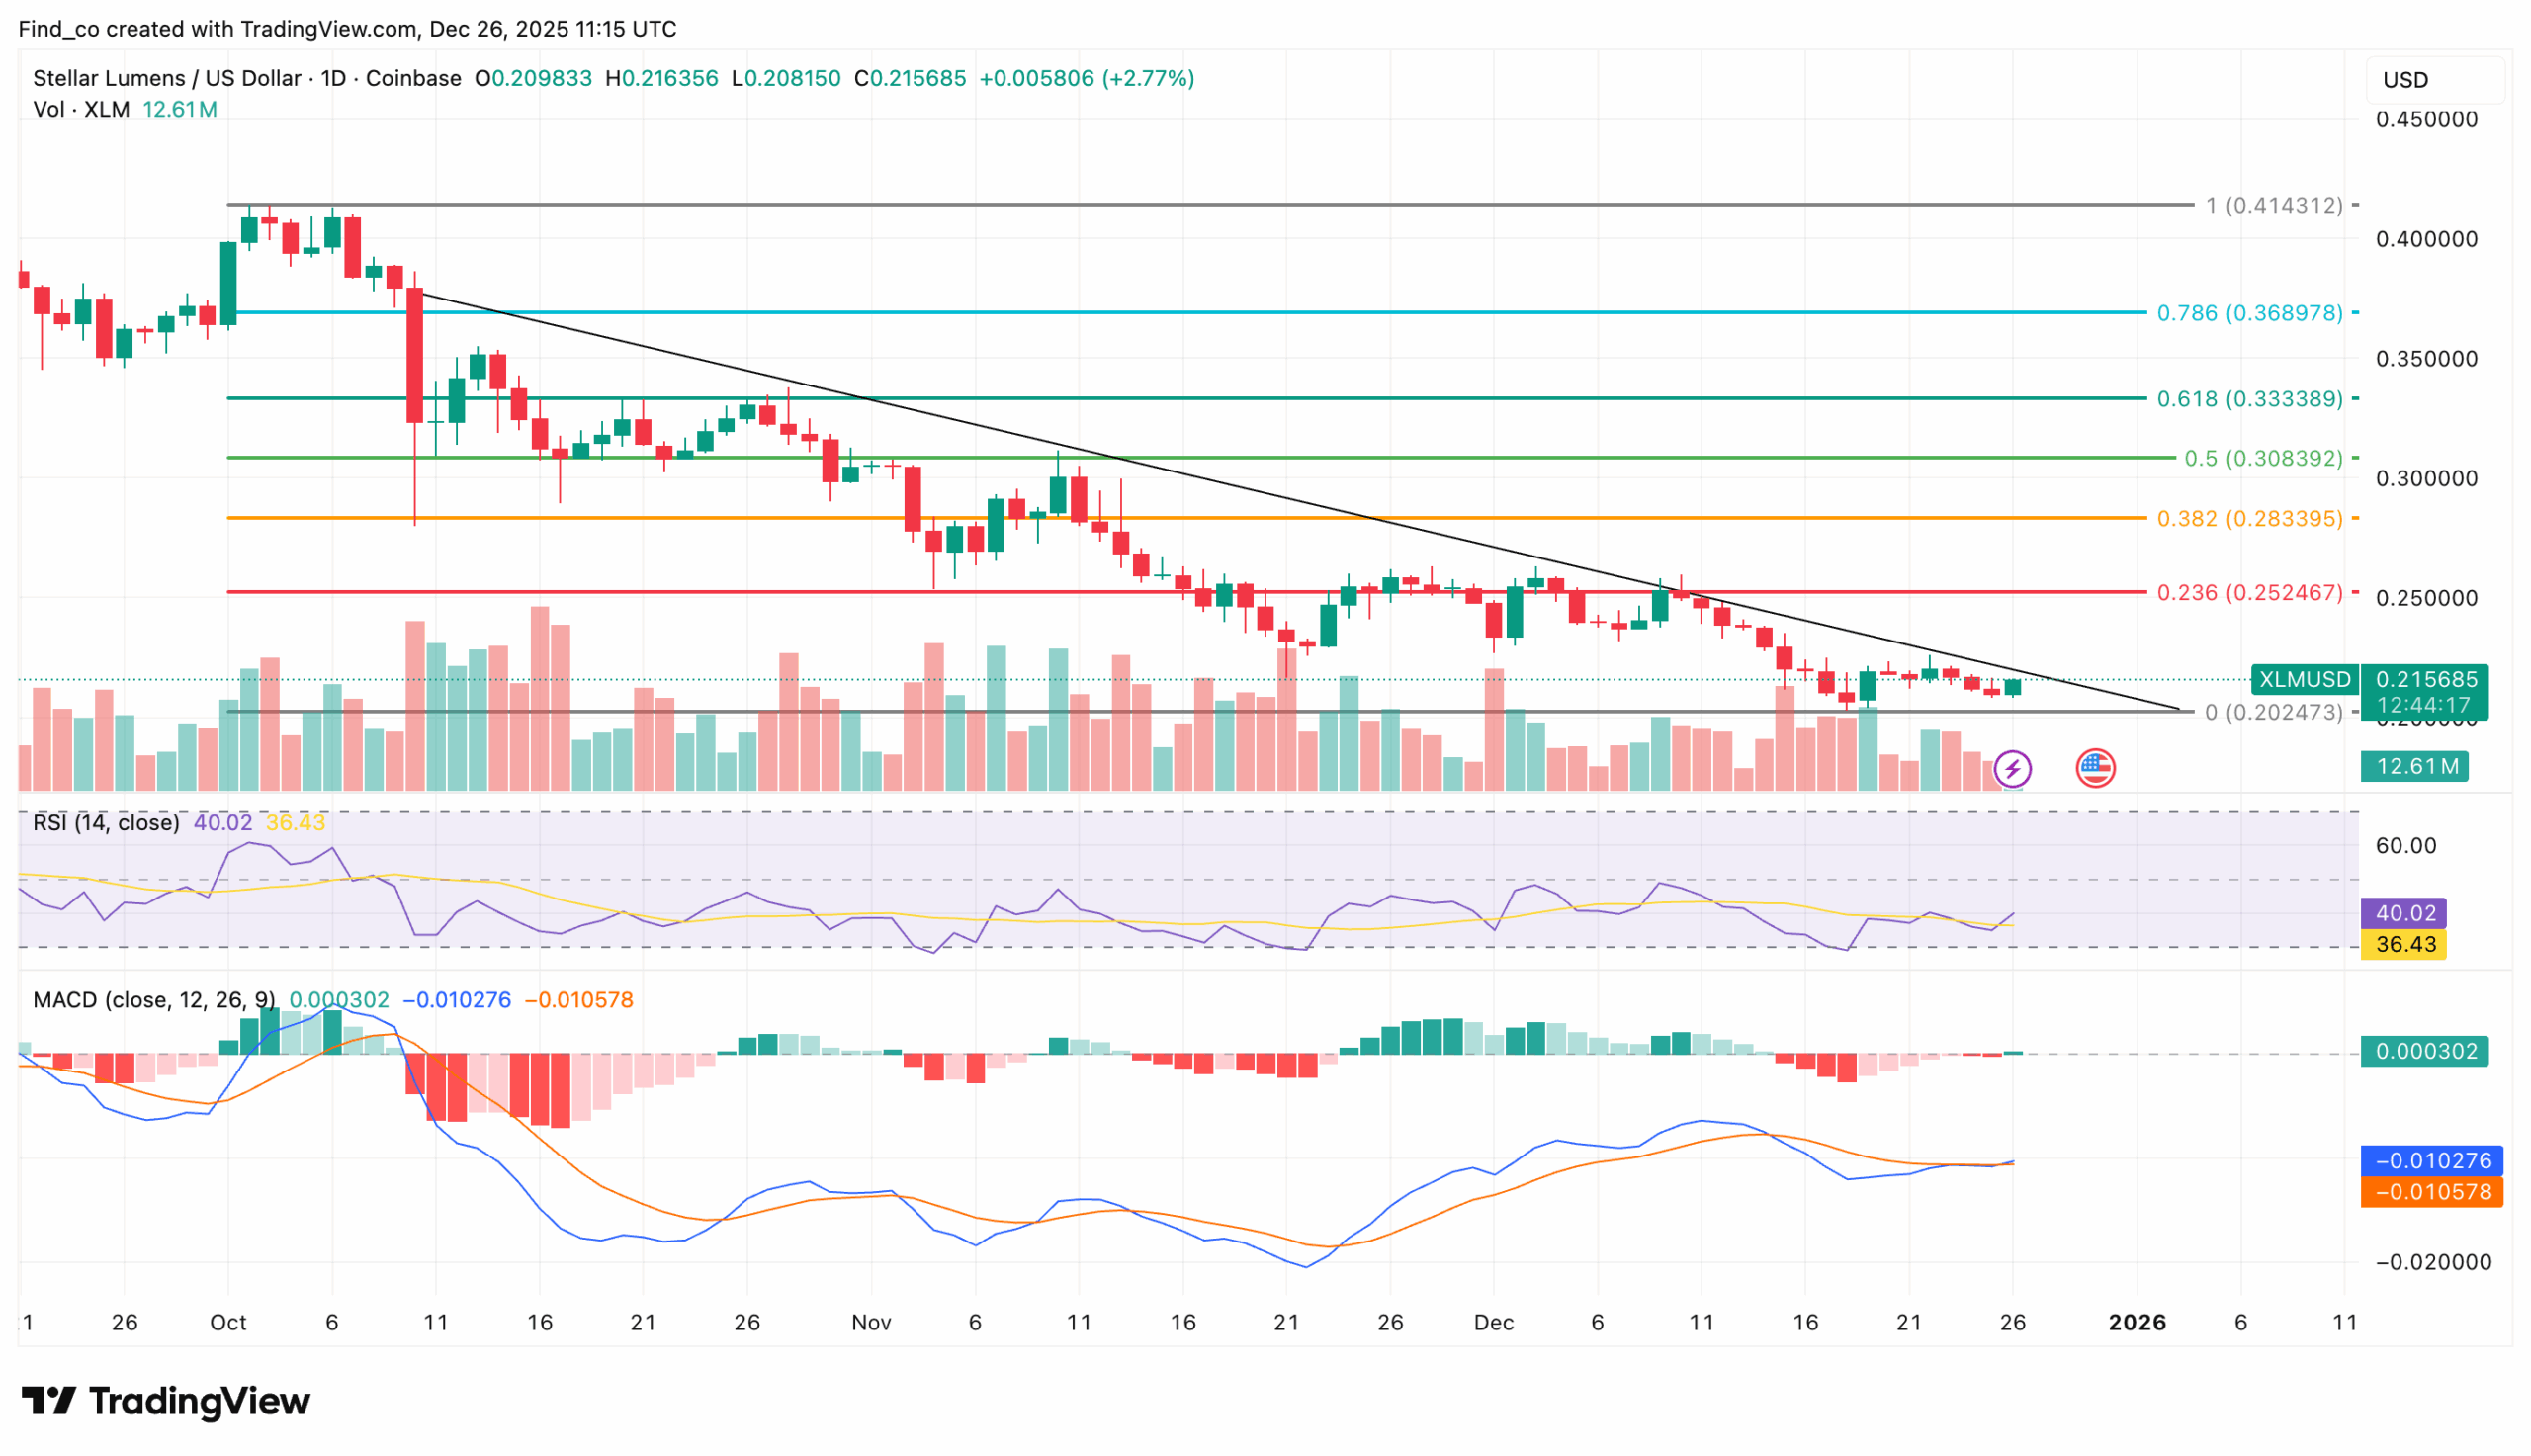
On the daily timeframe, XLM’s price remains confined within a descending channel.
At the time of writing, the chart shows the altcoin trades near $0.21, with indicators still indicating a bearish bias.
The Relative Strength Index (RSI) stands at 38.82, indicating weak momentum and continued selling pressure.
While this level can sometimes precede a relief bounce, it also confirms that bulls have not yet regained control.
The Moving Average Convergence Divergence (MACD) aligns with the bearish structure.
The indicator remains below the zero line, with the faster average positioned below the slower one, and red histogram bars are consistently printed, signaling that downside momentum remains active.
For now, Stellar’s structure remains constrained, and without an increase in demand, the charts suggest that consolidation or further downside remains the more probable path into year-end.
Disclaimer:
The information provided in this article is for informational purposes only. It is not intended to be, nor should it be construed as, financial advice. We do not make any warranties regarding the completeness, reliability, or accuracy of this information. All investments involve risk, and past performance does not guarantee future results. We recommend consulting a financial advisor before making any investment decisions.
Victor Olanrewaju is a crypto analyst and reporter at CCN with deep roots in on-chain research and technical analysis. His crypto journey began in 2017, but it was the 2020 Uniswap airdrop that sparked a full-time pivot into the space.
With a foundation in copywriting, Victor honed his craft creating high-converting content for leading crypto brokers — most notably an XRP price prediction that ranked #1 on Google during the 2021 bull run.
He later joined AMBCrypto in 2022, where he combined storytelling with technical and on-chain analysis to cover key market narratives.
In 2024, he expanded his expertise at BeInCrypto, collaborating with analysts and using tools like Glassnode, Santiment, and IntoTheBlock to break down Bitcoin and altcoin trends.
At CCN, Victor covers the top cryptocurrencies, memecoins, macro shifts, blending real-time insights with deep-dive metrics.
He holds a Bachelor’s degree in Physics from the University of Ibadan, equipping him to simplify complex data for a wide audience. Follow his work or connect on LinkedIn or X.