XRP enters the holidays under pressure despite ETF inflows | Credit: Hameem Sarwar
Share
Key Takeaways
XRP lost momentum after its peak and is now down nearly 50%.
Bearish indicators signal the risk of further downside for the coin
Recovery unlikely without a strong return of XRP spot demand.
Optimism around XRP surged in July after the token printed a fresh all-time high, with growing calls for a move toward $5.
That momentum, however, failed to carry through. Instead of extending higher, XRP’s price has retraced, shedding roughly 48% of its peak value as bullish sentiment waned.
Heading into the Christmas and New Year period, the pressure has intensified. XRP has slipped below the $2 mark, and a growing cluster of technical indicators suggests the token may struggle to reclaim higher ground during the holiday stretch.
Here’s what’s weighing on XRP, and what the charts suggest could come next.
XRP Setup Remains Bearish
On the weekly chart, CCN observed that XRP’s price has printed a higher number of red candlesticks than green ones since setting its all-time high, highlighting a sustained loss of upward momentum.
As a result, price action has compressed into a descending triangle, with horizontal support forming near the $1.88 level.
Get These Top Crypto Casino Offers Now!
Sponsored
Disclosure
We sometimes use affiliate links in our content, when clicking on those we might receive a commission at no extra cost to you. By using this website you agree to our terms and conditions and privacy policy.
Momentum indicators suggest this structure remains vulnerable, raising the risk of an extended breakdown if support fails to hold.
One indicator reinforcing this bearish bias is the Supertrend. At the time of this writing, the red Supertrend line has crossed above XRP’s price.
Typically, this position signals a sell signal.
Therefore, as long as this setup persists, XRP may struggle to build enough momentum to challenge higher levels, including a sustained move toward the $3 region.
Adding to the downside risk, the Moving Average Convergence Divergence (MACD) remains locked in a bearish crossover, indicating that negative momentum has yet to unwind.
If this configuration persists, XRP’s price risks sliding toward the next underlying support level, near $1.43, especially if broader market conditions remain unsupportive.
Notably, this bearish technical setup contrasts with the fund flow data.
Despite the price weakness, XRP exchange-traded funds (ETFs) recorded inflows of over 22 million coins yesterday, suggesting that institutional interest has not yet entirely dissipated.
But since demand on the spot market has continued to lag, the altcoin’s price might fail to break out this Christmas or New Year.
XRP Price to Opt Against Holiday Rally
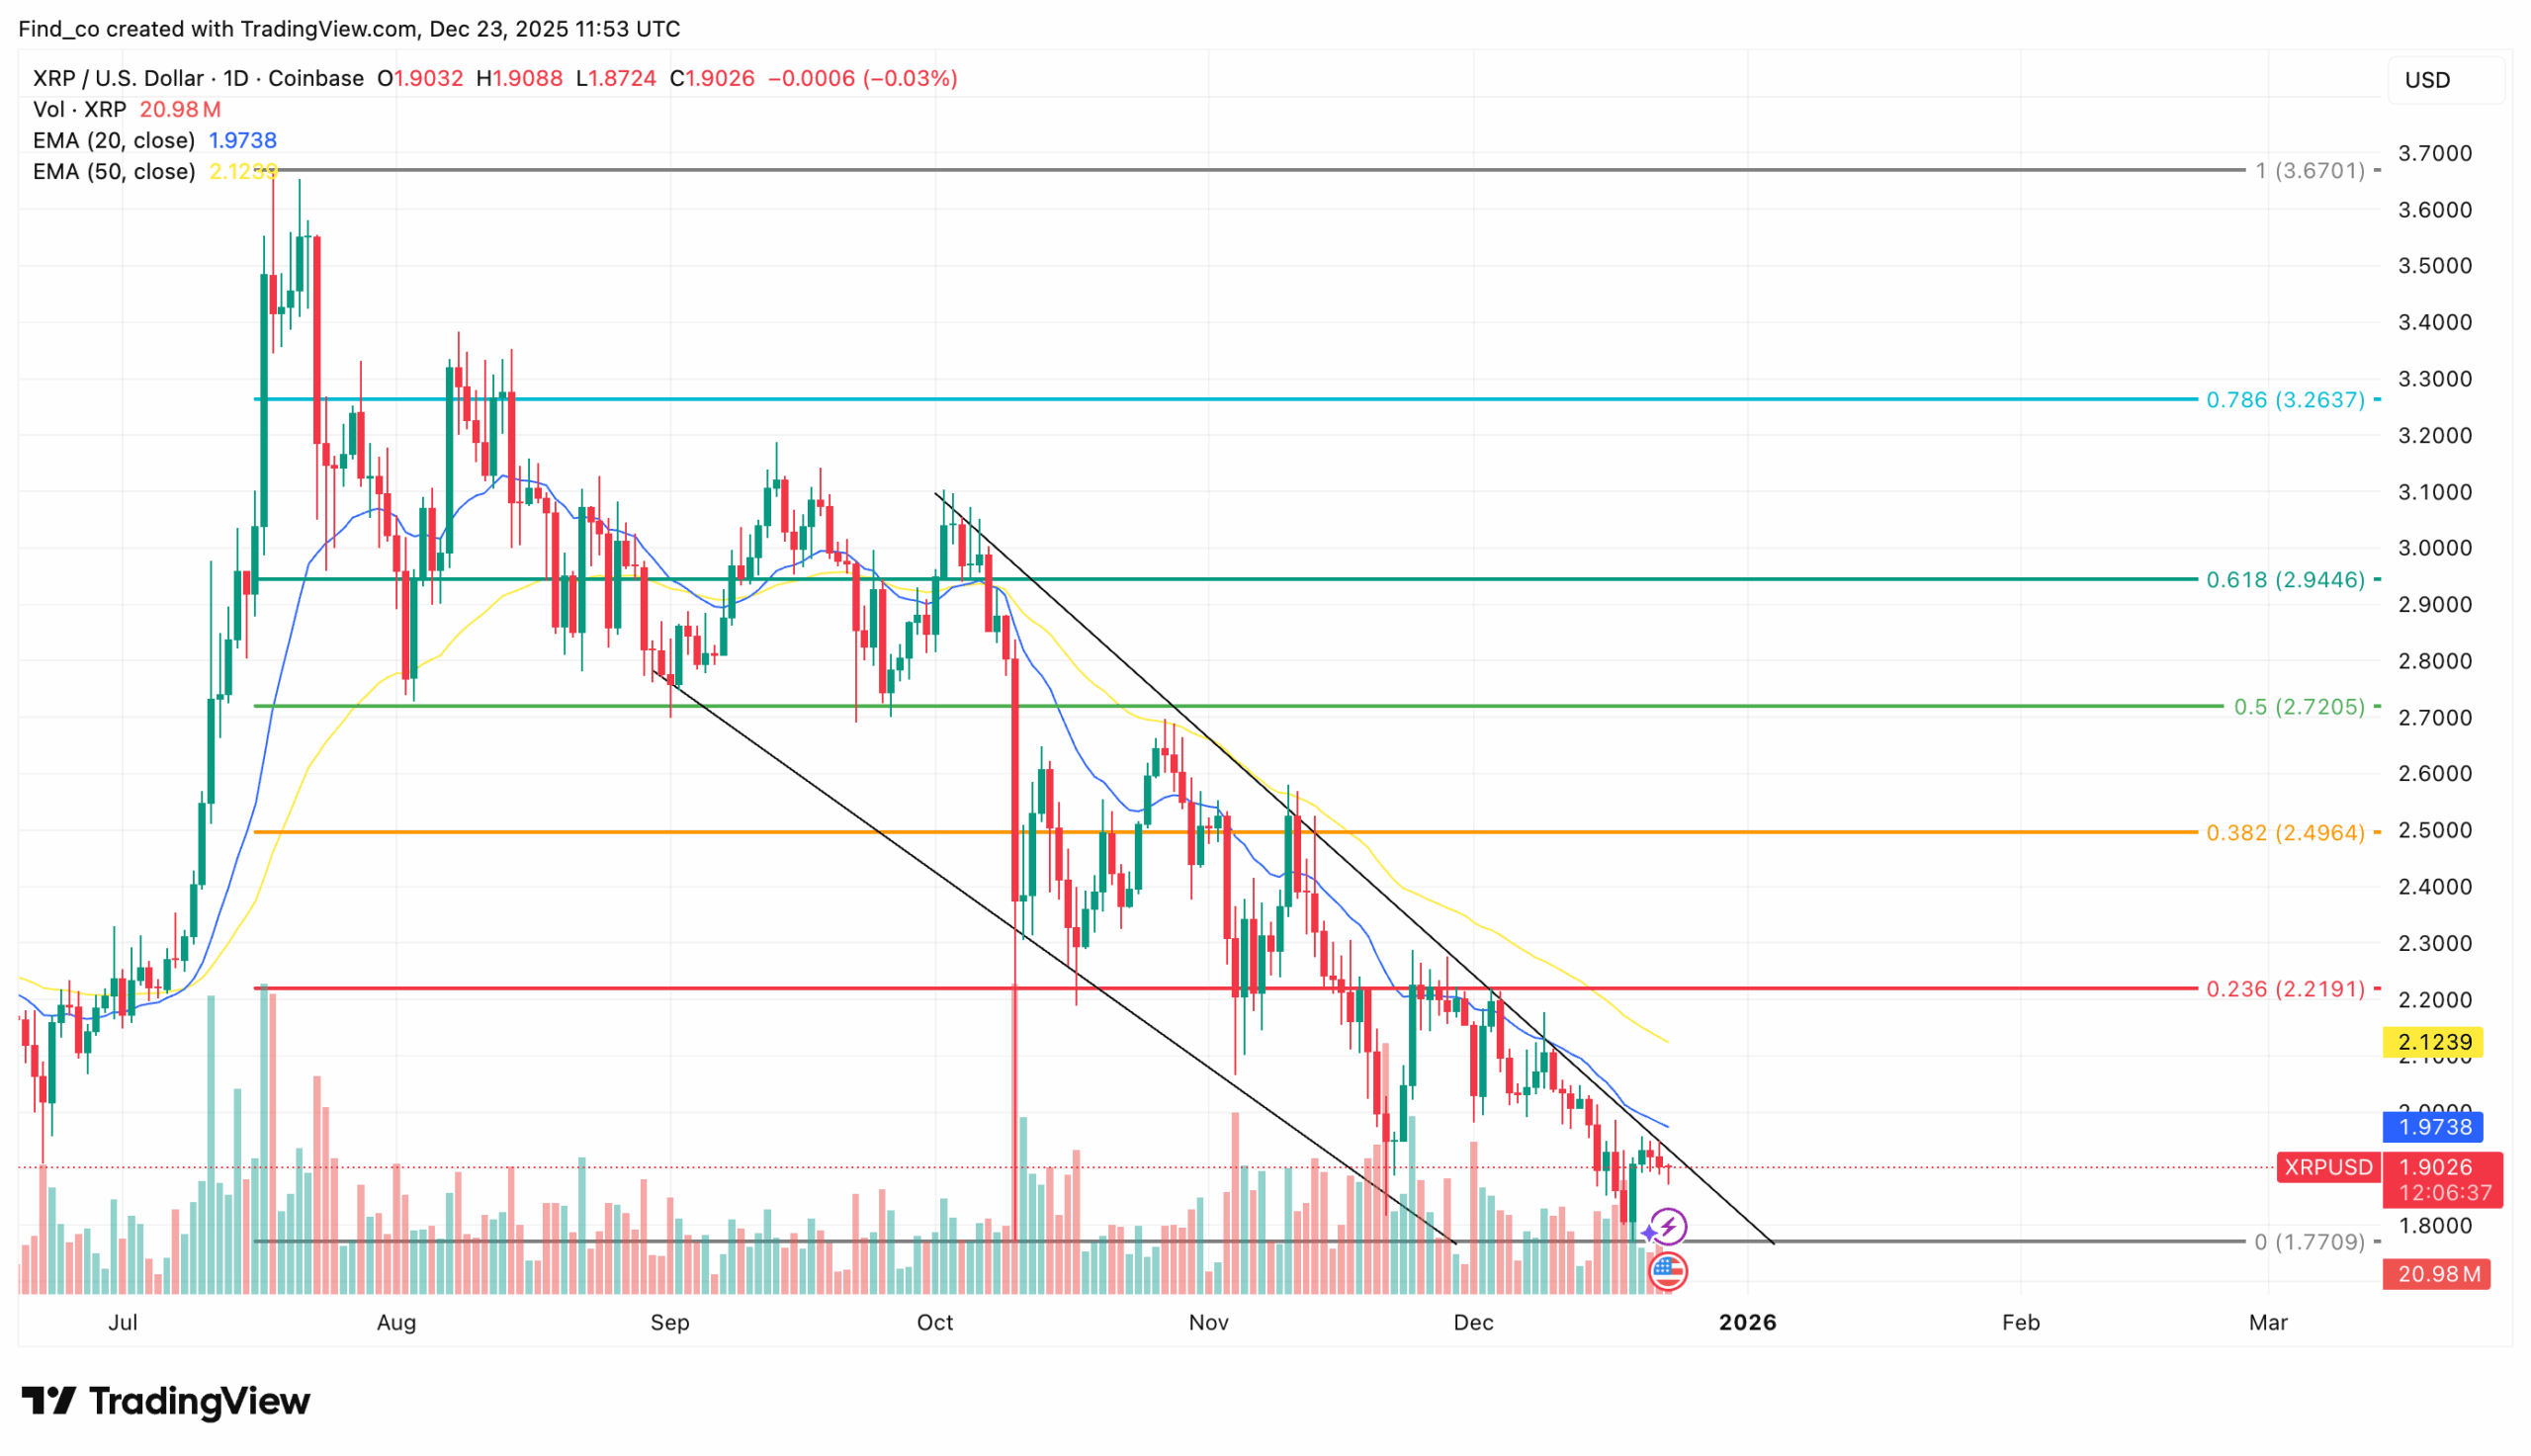
On the daily chart, XRP continues to trade within a falling channel, reinforcing the view that overcoming overhead resistance remains challenging in the near term.
Adding to the bearish setup, the token has formed a death cross on the EMA structure.
The signal emerged as the 20-day EMA crossed below the 50-day EMA.
If this technical setup remains the same, XRP risks sliding toward the $1.77 level, where the next area of technical support lies.
Disclaimer:
The information provided in this article is for informational purposes only. It is not intended to be, nor should it be construed as, financial advice. We do not make any warranties regarding the completeness, reliability, or accuracy of this information. All investments involve risk, and past performance does not guarantee future results. We recommend consulting a financial advisor before making any investment decisions.
Victor Olanrewaju is a crypto analyst and reporter at CCN with deep roots in on-chain research and technical analysis. His crypto journey began in 2017, but it was the 2020 Uniswap airdrop that sparked a full-time pivot into the space.
With a foundation in copywriting, Victor honed his craft creating high-converting content for leading crypto brokers — most notably an XRP price prediction that ranked #1 on Google during the 2021 bull run.
He later joined AMBCrypto in 2022, where he combined storytelling with technical and on-chain analysis to cover key market narratives.
In 2024, he expanded his expertise at BeInCrypto, collaborating with analysts and using tools like Glassnode, Santiment, and IntoTheBlock to break down Bitcoin and altcoin trends.
At CCN, Victor covers the top cryptocurrencies, memecoins, macro shifts, blending real-time insights with deep-dive metrics.
He holds a Bachelor’s degree in Physics from the University of Ibadan, equipping him to simplify complex data for a wide audience. Follow his work or connect on LinkedIn or X.