Bearish crossover hits DOT again | Credit: Hameem Sarwar
Share
Key Takeaways
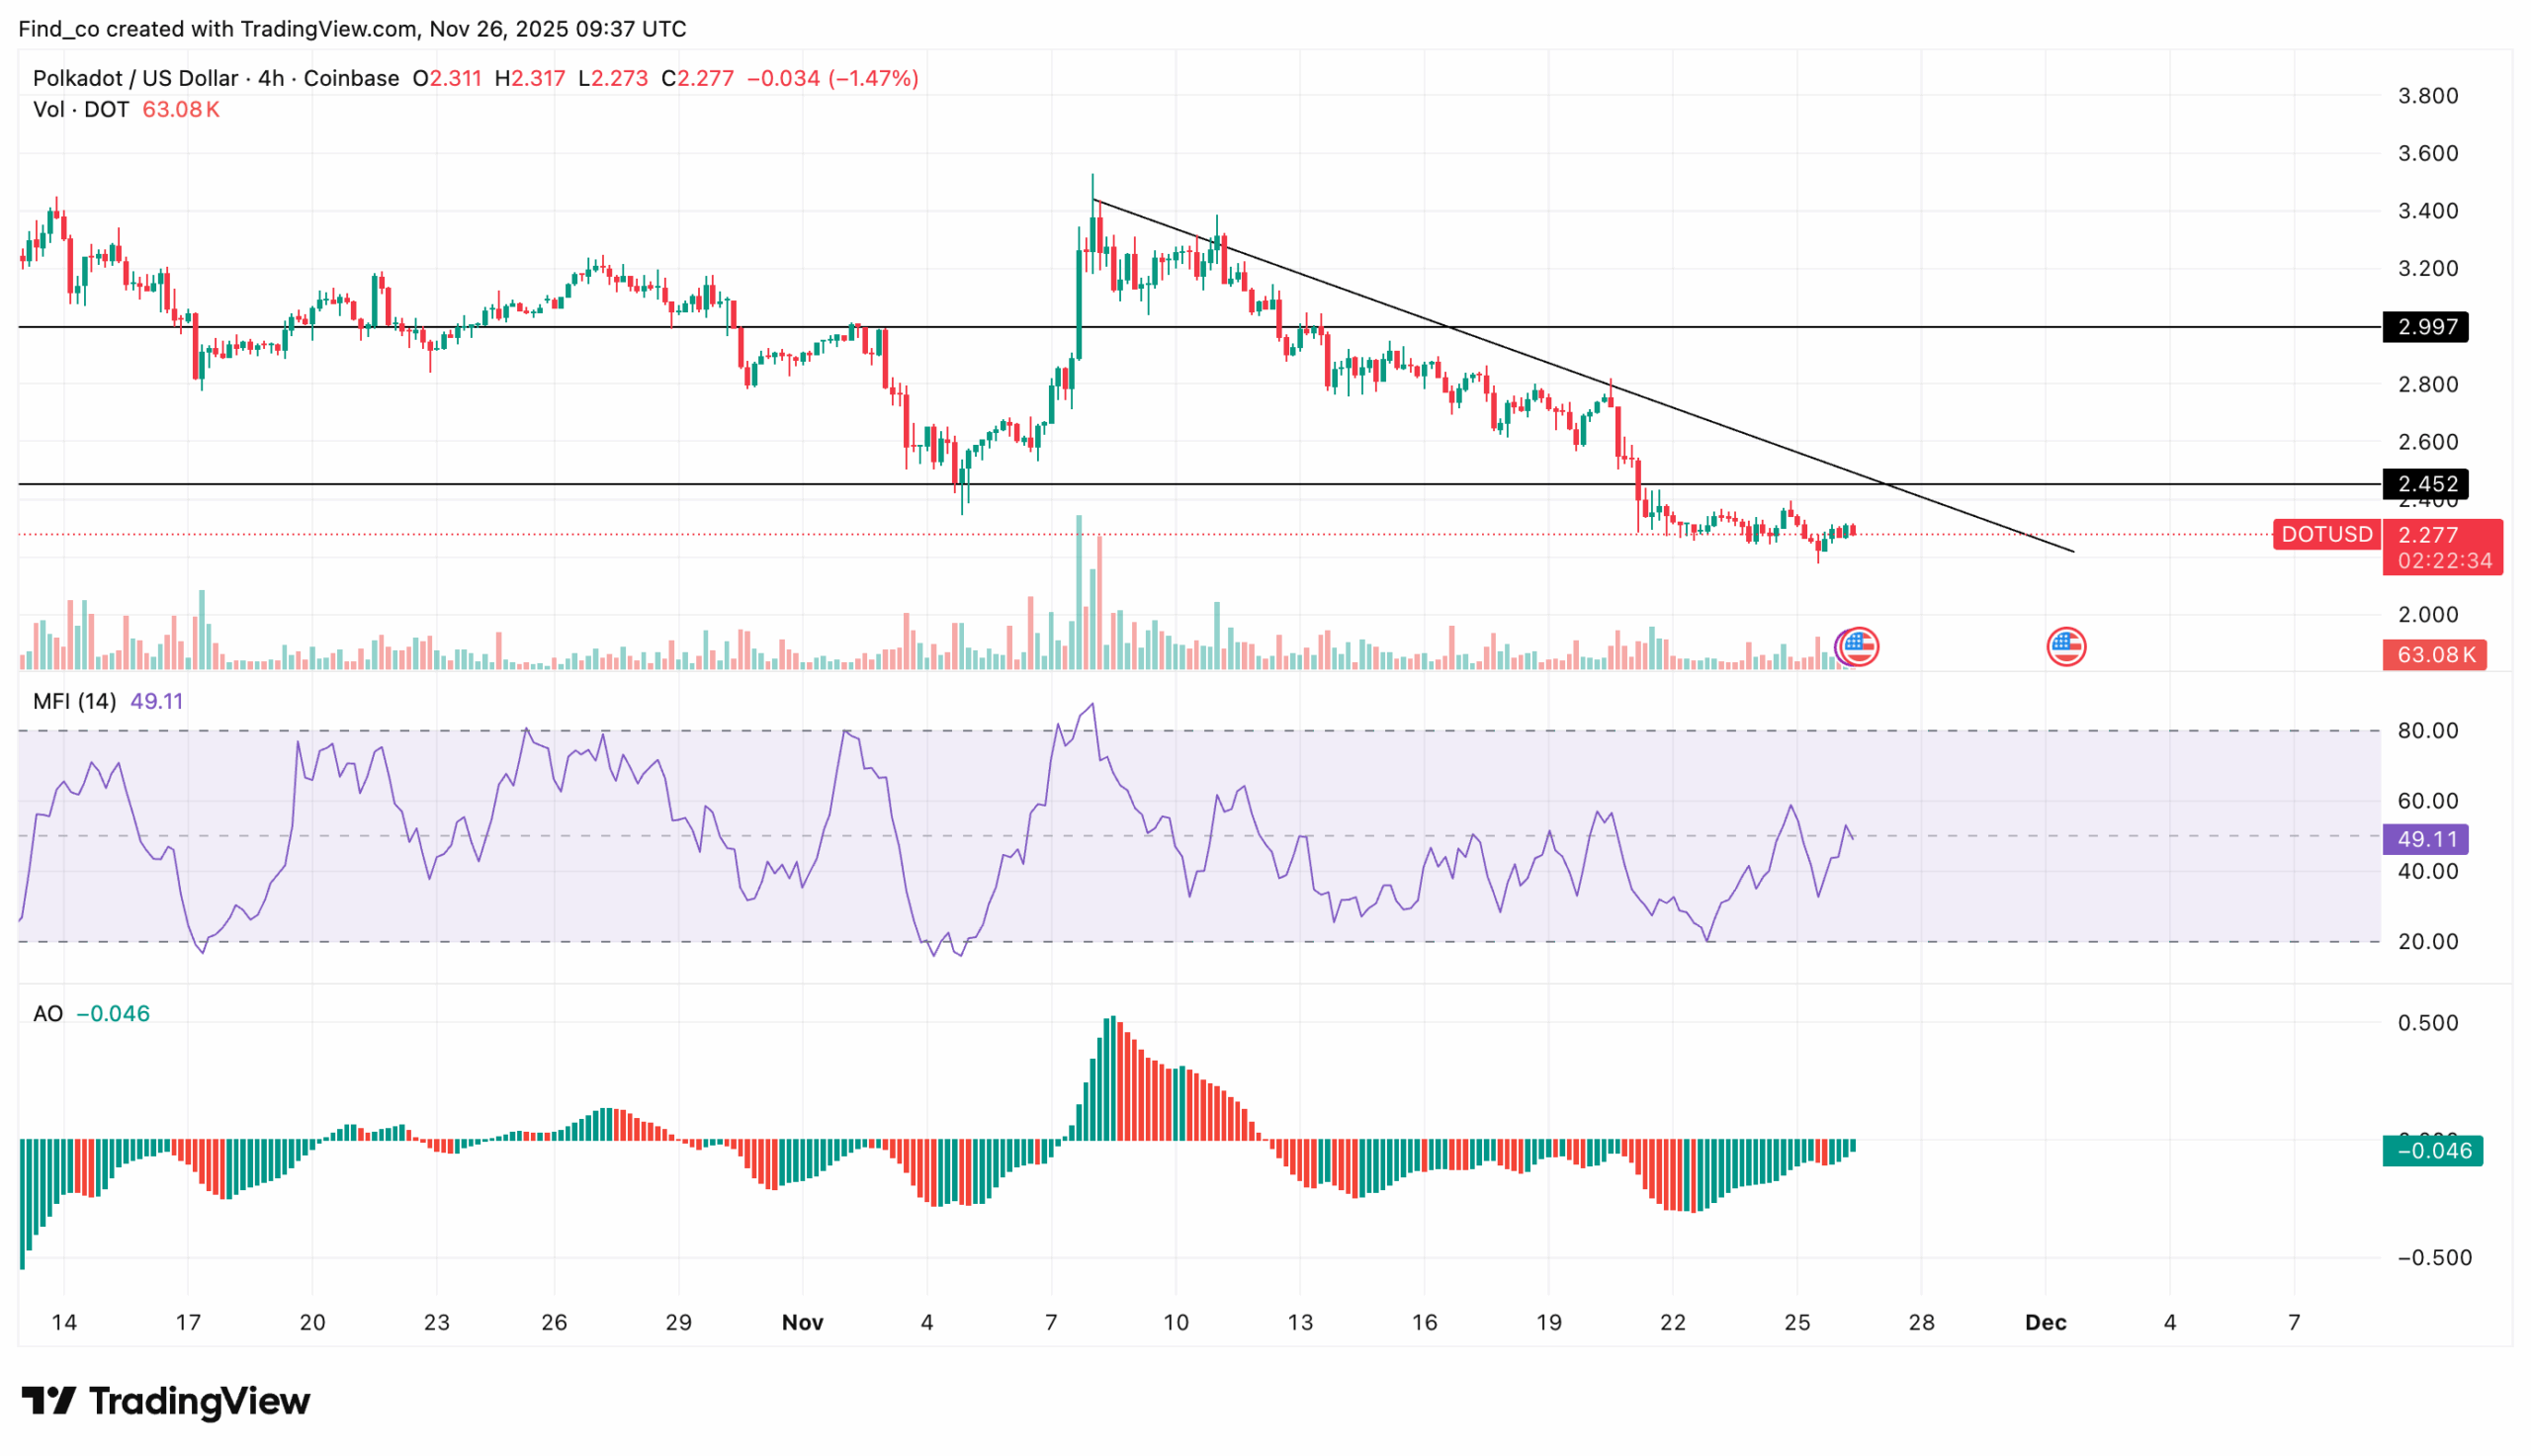
DOT is trapped in a descending triangle with bearish momentum strengthening.
Negative funding and weak indicators suggest a decline toward the $1.96 support.
A Polkadot rebound could only occur if it breaches the resistance level near $2.77.
It’s the end of the second week of December, and the bearish crossover blinking on Polkadot’s (DOT) charts highlights a troubling trend.
At the time of writing, the Polkadot coin price was hovering around $2.25. This value represents a 68% drawdown from its value at the beginning of the year.
For some, this could mean that DOT is undervalued. However, several indicators suggest that it does not appear likely for the altcoin to bounce soon.
This pattern signals a bearish continuation. Furthermore, the Moving Average Convergence Divergence (MACD) has formed a bearish crossover, indicating weakening momentum and increasing downward pressure.
Get These Top Crypto Casino Offers Now!
Sponsored
Disclosure
We sometimes use affiliate links in our content, when clicking on those we might receive a commission at no extra cost to you. By using this website you agree to our terms and conditions and privacy policy.
The last time this setup appeared was on Nov. 29. During that period, DOT’s price fell from $2.28 to $1.99 shortly after the crossover.
While price action does not repeat perfectly, similar structures often lead to comparable movements.
If this pattern repeats, Polkadot’s price could decline toward the underlying horizontal support near $2, which represents the base of the triangle.
Supporting the bearish case, the DOT price has also dropped below the 20-period Exponential Moving Average (EMA), confirming that sellers currently have the upper hand.
Due to this, the cryptocurrency may struggle to move above the resistance near $2.38, let alone $2.88.
Drawdown to Extend
Amid this setup, the funding rate has turned negative, showing that traders in the derivatives market are increasingly positioning themselves on the short side.
Usually, negative funding during a decline can hint that the market is becoming oversaturated with bearish sentiment.
Sometimes, this creates conditions for a relief bounce.
However, in this case, DOT’s price continues to fall despite the negative funding, suggesting that selling pressure is strong enough to overpower any potential short squeeze.
The Awesome Oscillator (AO) sits in the negative region, confirming that bearish momentum is still dominant.
At the same time, Holders Sentiment has turned negative.
If these conditions persist, the Polkadot coin price may decline toward $1.96, which aligns with a key lower support zone within the channel.
However, the outlook shifts if buying pressure begins to build. A rebound from current levels could invalidate the bearish path and allow DOT to climb toward $2.77.
Disclaimer:
The information provided in this article is for informational purposes only. It is not intended to be, nor should it be construed as, financial advice. We do not make any warranties regarding the completeness, reliability, or accuracy of this information. All investments involve risk, and past performance does not guarantee future results. We recommend consulting a financial advisor before making any investment decisions.
Victor Olanrewaju is a crypto analyst and reporter at CCN with deep roots in on-chain research and technical analysis. His crypto journey began in 2017, but it was the 2020 Uniswap airdrop that sparked a full-time pivot into the space.
With a foundation in copywriting, Victor honed his craft creating high-converting content for leading crypto brokers — most notably an XRP price prediction that ranked #1 on Google during the 2021 bull run.
He later joined AMBCrypto in 2022, where he combined storytelling with technical and on-chain analysis to cover key market narratives.
In 2024, he expanded his expertise at BeInCrypto, collaborating with analysts and using tools like Glassnode, Santiment, and IntoTheBlock to break down Bitcoin and altcoin trends.
At CCN, Victor covers the top cryptocurrencies, memecoins, macro shifts, blending real-time insights with deep-dive metrics.
He holds a Bachelor’s degree in Physics from the University of Ibadan, equipping him to simplify complex data for a wide audience. Follow his work or connect on LinkedIn or X.