Meet the Top 101 in Crypto

This Chart Signals a 60% XRP Price Crash Below $1 — Could It Really Happen?

Published 19 December 2025
Valdrin Tahiri
Authors
Edited by Insha Zia
Key Takeaways
  • The XRP price broke down from an ascending parallel channel.
  • XRP risks closing below the long-term horizontal support at $2.
  • Will XRP crash to end the year, or can it prevent a breakdown?

XRP is under heavy pressure as bearish technical signals stack up.

After losing its long-term upward structure, XRP is now hovering near a critical support zone that could decide its fate before year-end.

So, why is XRP’s price going down right now, and does this move signal the start of a much larger correction or a final shakeout before a rebound?

Let’s break down the technicals, analyst sentiment, and key levels traders are watching closely.

XRP Price Analysis

The weekly XRP price action is as bearish as it gets.

XRP has fallen by nearly 50% since its all-time high, breaking down from a long-term ascending parallel channel in the process.

This week, XRP’s price is at risk of closing below the $2 horizontal support area.

XRP Long-Term
XRP/USDT Weekly Chart | Credit: Valdrin Tahiri/TradingView

The area has existed since November 2024, so a breakdown below it could trigger a massive crash.

Therefore, all eyes are on the $2 horizontal area, as a break from it could cause XRP’s price to crash by 55% to the next support level at $0.85.

What Analysts Are Saying

Despite the bearish price action, analysts are bullish on the future.

Analyst “Steph Is Crypto” posted a fractal with the 2017 price movement, which predicts a massive increase to $25.

BitGuru, another analyst, was also bullish and believes XRP’s price is close to bottoming and starting a massive rally.

“Price is now sitting near a key support zone where selling pressure is weakening. If this base holds, XRP can shift momentum and start a recovery,” the analyst shared.

The extremely oversold RSI levels are another reason why CryptoRus expects a massive bounce.

As outlined previously, these levels have historically led to significant increases.

“The weekly RSI dropping to 33 signals that XRP is approaching oversold territory, a level where historically strong bounces often occur,” CryptoRus noted. 

Institutional investment is also increasing, and total net held assets in Exchange-Traded Funds (ETFs) are now $1.14 billion.

Despite the bearish trend, sentiment around XRP remains positive, and traders expect new highs soon.

Why Is XRP’s Price Going Down?

Nevertheless, the XRP technical analysis is decisively bearish.

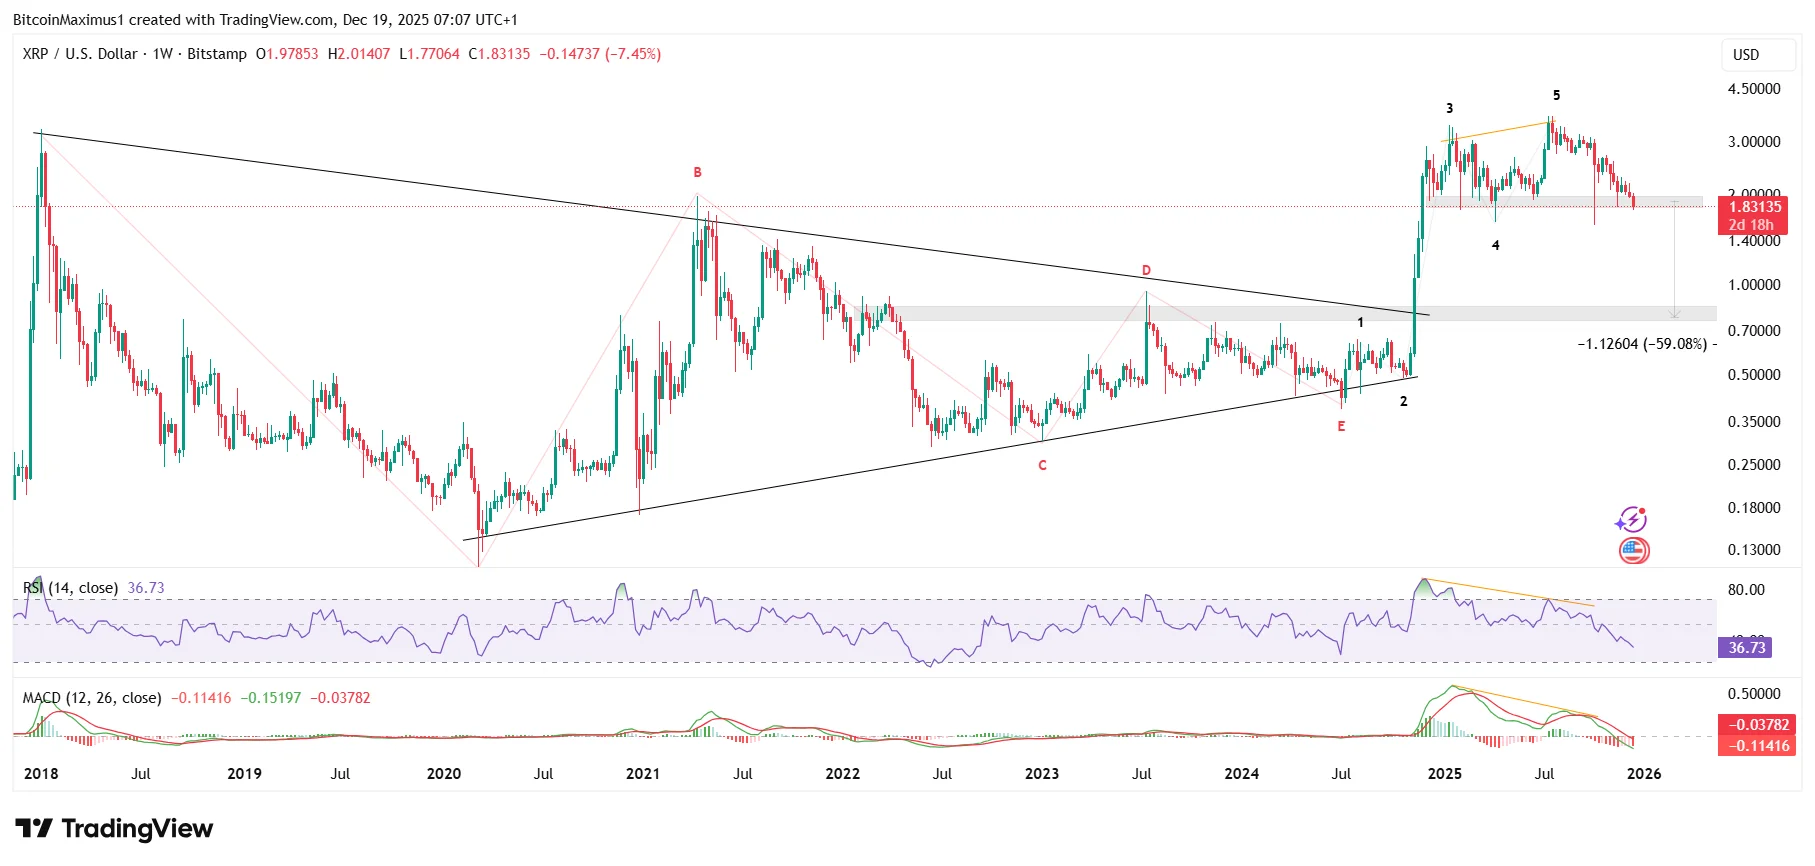
The long-term wave count reiterates this, since it shows that the XRP price has completed a five-wave upward movement (black).

What preceded it was a triangle breakout, which is likely wave four in a long-term five-wave movement.

XRP Wave Count
XRP/USDT Weekly Chart | Credit: Valdrin Tahiri/TradingView

Momentum indicators are also decisively bearish.

  • The Relative Strength Index (RSI) generated a bearish divergence.
  • The Moving Average Convergence/Divergence (MACD) did the same.
  • Both indicators are moving downward and are in bearish territory.

Hence, the future XRP price prediction is bearish.

Once the price closes below $1.90, it could crash nearly 60% to the next support at $0.80.

Another Crash Incoming

The answer to why the XRP price is going down lies squarely in the charts.

XRP has broken its long-term ascending channel, momentum indicators are flashing bearish signals, and the price is now threatening to lose the crucial $2 support level.

If this area fails, XRP could see a sharp drop toward the $0.80 to $0.85 range, aligning with historical support and long-term wave targets.

However, oversold conditions, rising institutional exposure, and bullish analyst outlooks suggest the downside may be limited if buyers step in soon.

For now, XRP remains at a make-or-break level.

The next weekly close could determine whether this move turns into a full-scale crash or sets the stage for a powerful recovery rally.

Disclaimer: The information provided in this article is for informational purposes only. It is not intended to be, nor should it be construed as, financial advice. We do not make any warranties regarding the completeness, reliability, or accuracy of this information. All investments involve risk, and past performance does not guarantee future results. We recommend consulting a financial advisor before making any investment decisions.
Valdrin Tahiri

Valdrin Tahiri is a cryptocurrency analyst and reporter at CCN, specializing in technical analysis with a focus on Elliott Wave theory, on-chain metrics, and fundamental research. He brings over seven years of experience in the crypto space as both a trader and writer.

He discovered cryptocurrencies in 2017 while earning his MSc in Financial Markets at the Barcelona School of Economics, which sparked a deep interest in blockchain and market dynamics. Since then, he’s contributed to top crypto outlets like BeInCrypto and CoinGape.

Valdrin also served as Community Manager of BeInCrypto’s Telegram group for three years, helping grow it into one of the largest crypto communities worldwide. His expertise in market structure and price patterns allows him to break down complex trends into clear, actionable insights.

He’s published thousands of articles covering altcoins, Bitcoin cycles, and macro trends.

Related

Survey Icon
Help us improve
1 of 4
Is this your first time here?
What brought you here today?
What are you most interested in?
Would you be interested in:
Thank you icon
Thank you for your feedback!
DMCA.com Protection Status