XRP price is likely to keep trading sideways | Credit: Hameem Sarwar
Share
Key Takeaways
XRP is forming a recovery structure but remains stuck in a $1.50 range.
Weak network activity and a negative divergence signal fragile demand.
A breakout above $1.50 could drive a 20% rally, while risks remain.
XRP is getting close again.
After weeks of rebuilding momentum, the altcoin is now setting up for a potential move higher, with a 20% rally in May firmly in sight.
But there’s a catch. At the time of writing, XRP’s price still hasn’t cleared the levels that matter most.
So, what does this mean for the cryptocurrency? Let’s find out.
XRP Bulls Take on Bears
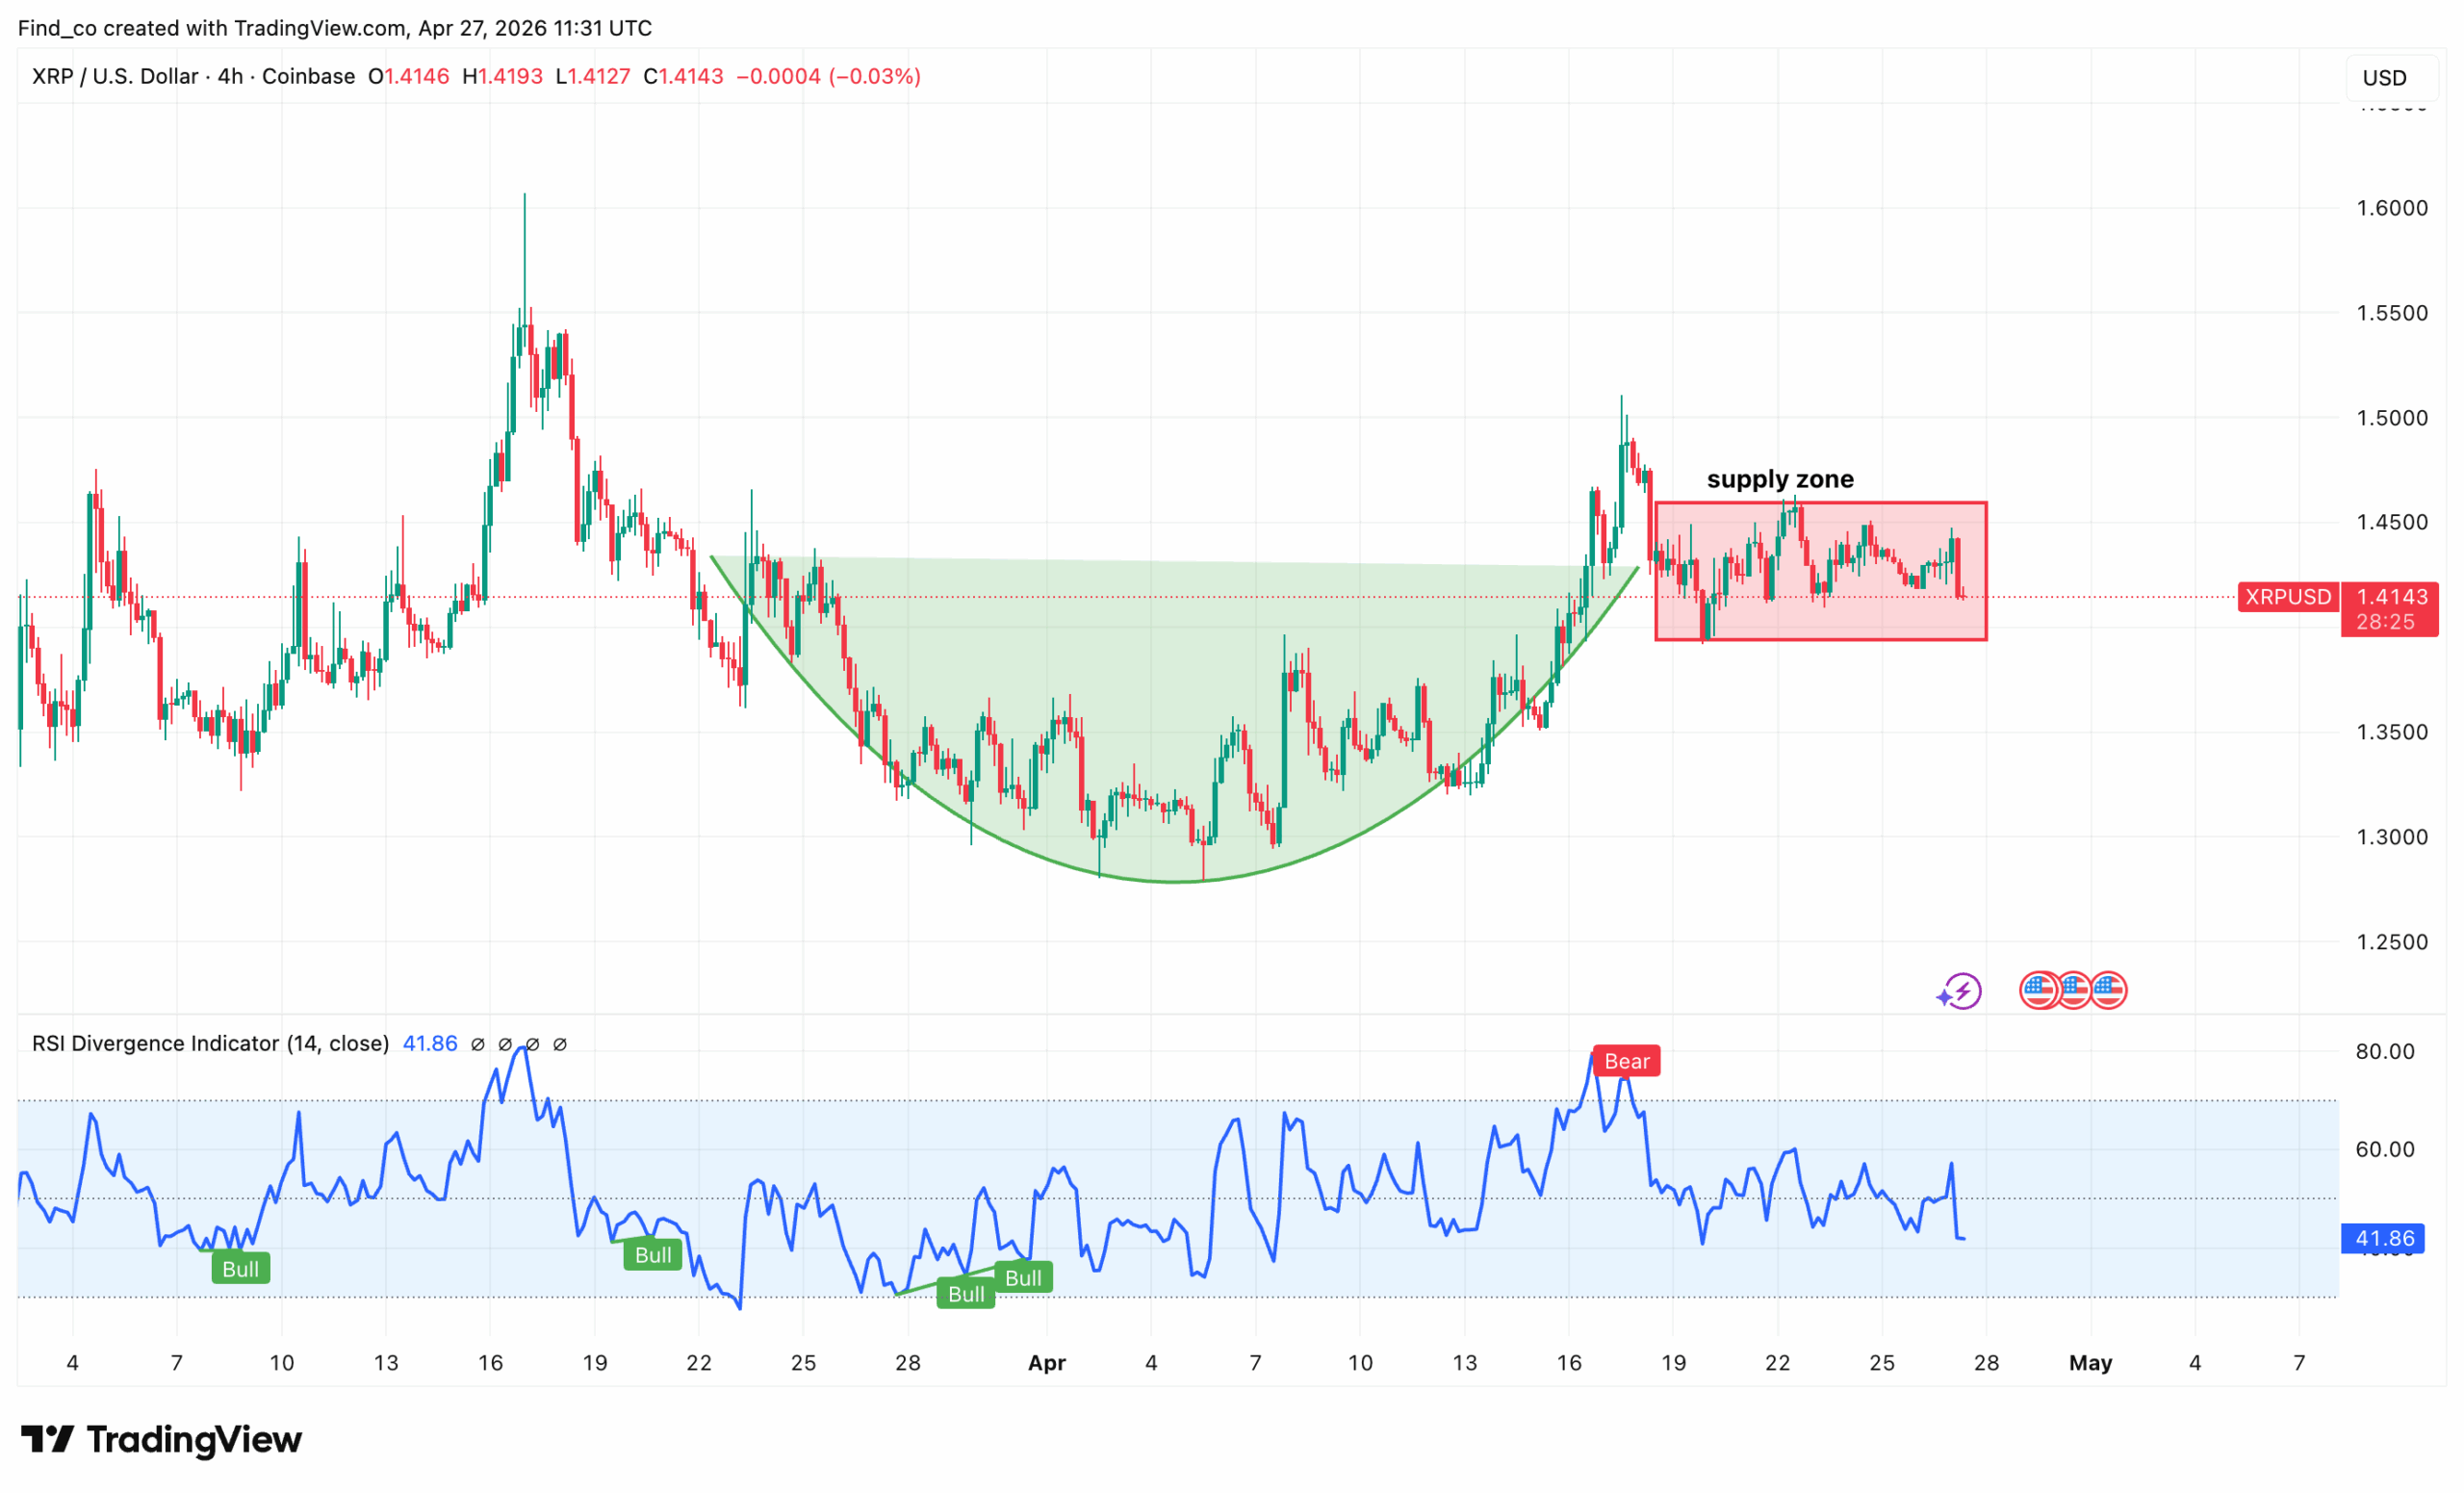
On the 4-hour chart, XRP’s price has completed a clear rounding bottom, which signals a shift from a downtrend into a potential accumulation and recovery phase.
At the time of writing, XRP’s price is sitting in a supply zone between $1.40 and $1.50 and has started moving sideways rather than breaking out.
That kind of structure usually reflects sellers absorbing demand, as each attempt to raise prices is rejected.
Sponsored
Disclosure
We sometimes use affiliate links in our content, when clicking on those we might receive a commission at no extra cost to you. By using this website you agree to our terms and conditions and privacy policy.
Instead of continuation, the market is showing hesitation. Momentum aligns with that.
As shown below, the Relative Strength Index (RSI) has dropped to around 42 after flashing a bearish signal near the highs, suggesting momentum peaked at resistance and is now weakening.
That reduces the probability of an immediate breakout.
If XRP can break and hold above 1.50, the rounding bottom will be confirmed, and a continuation higher becomes likely.
If it continues to stall or loses $1.40, the structure shifts toward a rejection, with a likely move back toward $1.25, where the base of the rounding formation sits.
Activity Goes Against Bullish Setup
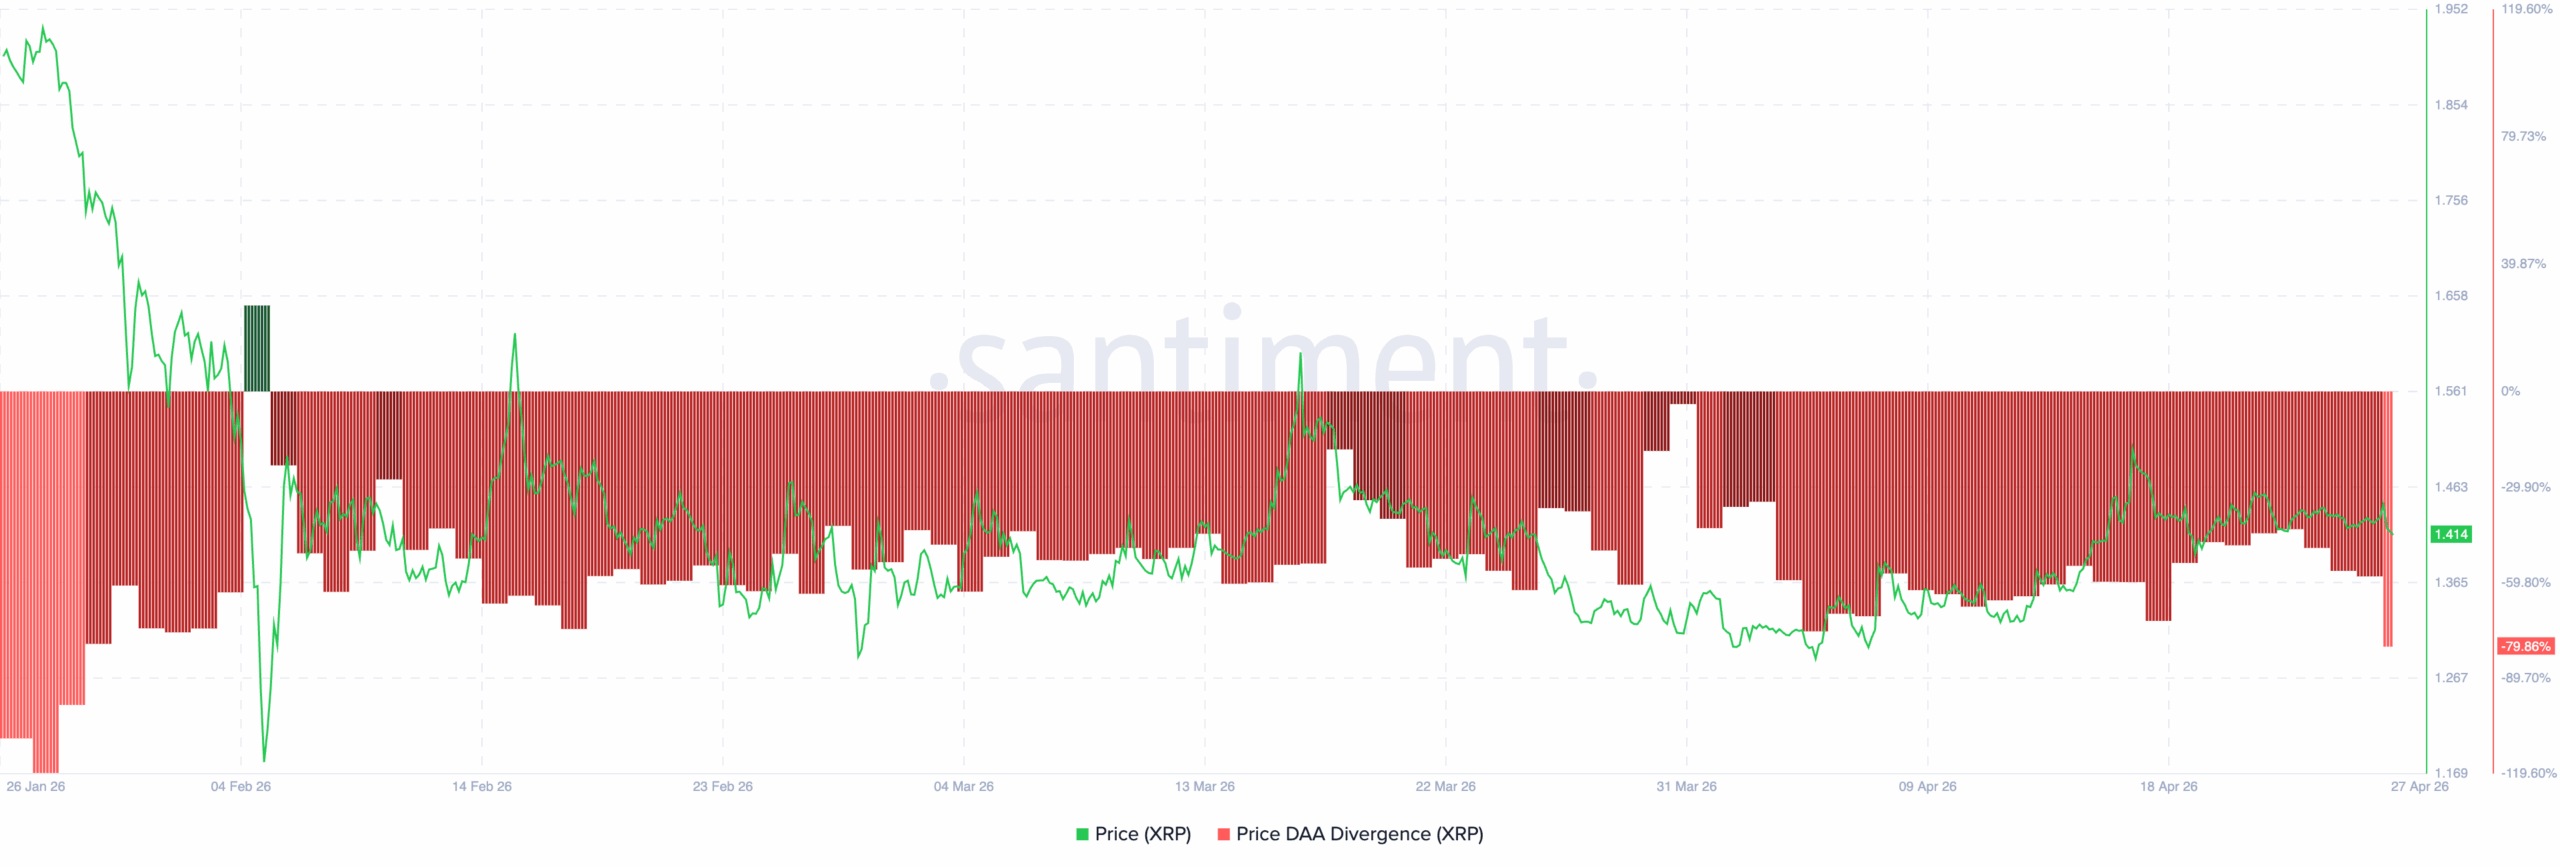
Outside the technical outlook, the DAA divergence bars are deeply negative (red).
This means that XRP’s price has been either holding up or grinding higher, while network activity is not keeping pace.
Even in the recent bounce toward $1.45, the divergence remains strongly negative and worsens further on the right side of the chart.
In simple terms, there’s not enough “organic demand” backing the price.
The brief green spikes earlier (early February and mid-March) showed periods when activity outpaced price, and those periods tended to precede short-term recoveries.
So, combining this with the range structure: XRP sitting near the middle/top of its range, while DAA divergence is deeply negative, makes this area fragile.
If buyers don’t step in with real participation, this kind of setup usually resolves with a pullback.
Should that be the case, XRP’s price might slide toward the lower end of the range ($1.25).
For a stronger bullish case, you’d want to see those red bars shrink or flip green.
If that were to happen, it would mean rising activity starts expanding alongside price.
Until then, upside moves are likely to be less reliable and more prone to rejection.
XRP Price Forecast: Trend Unclear
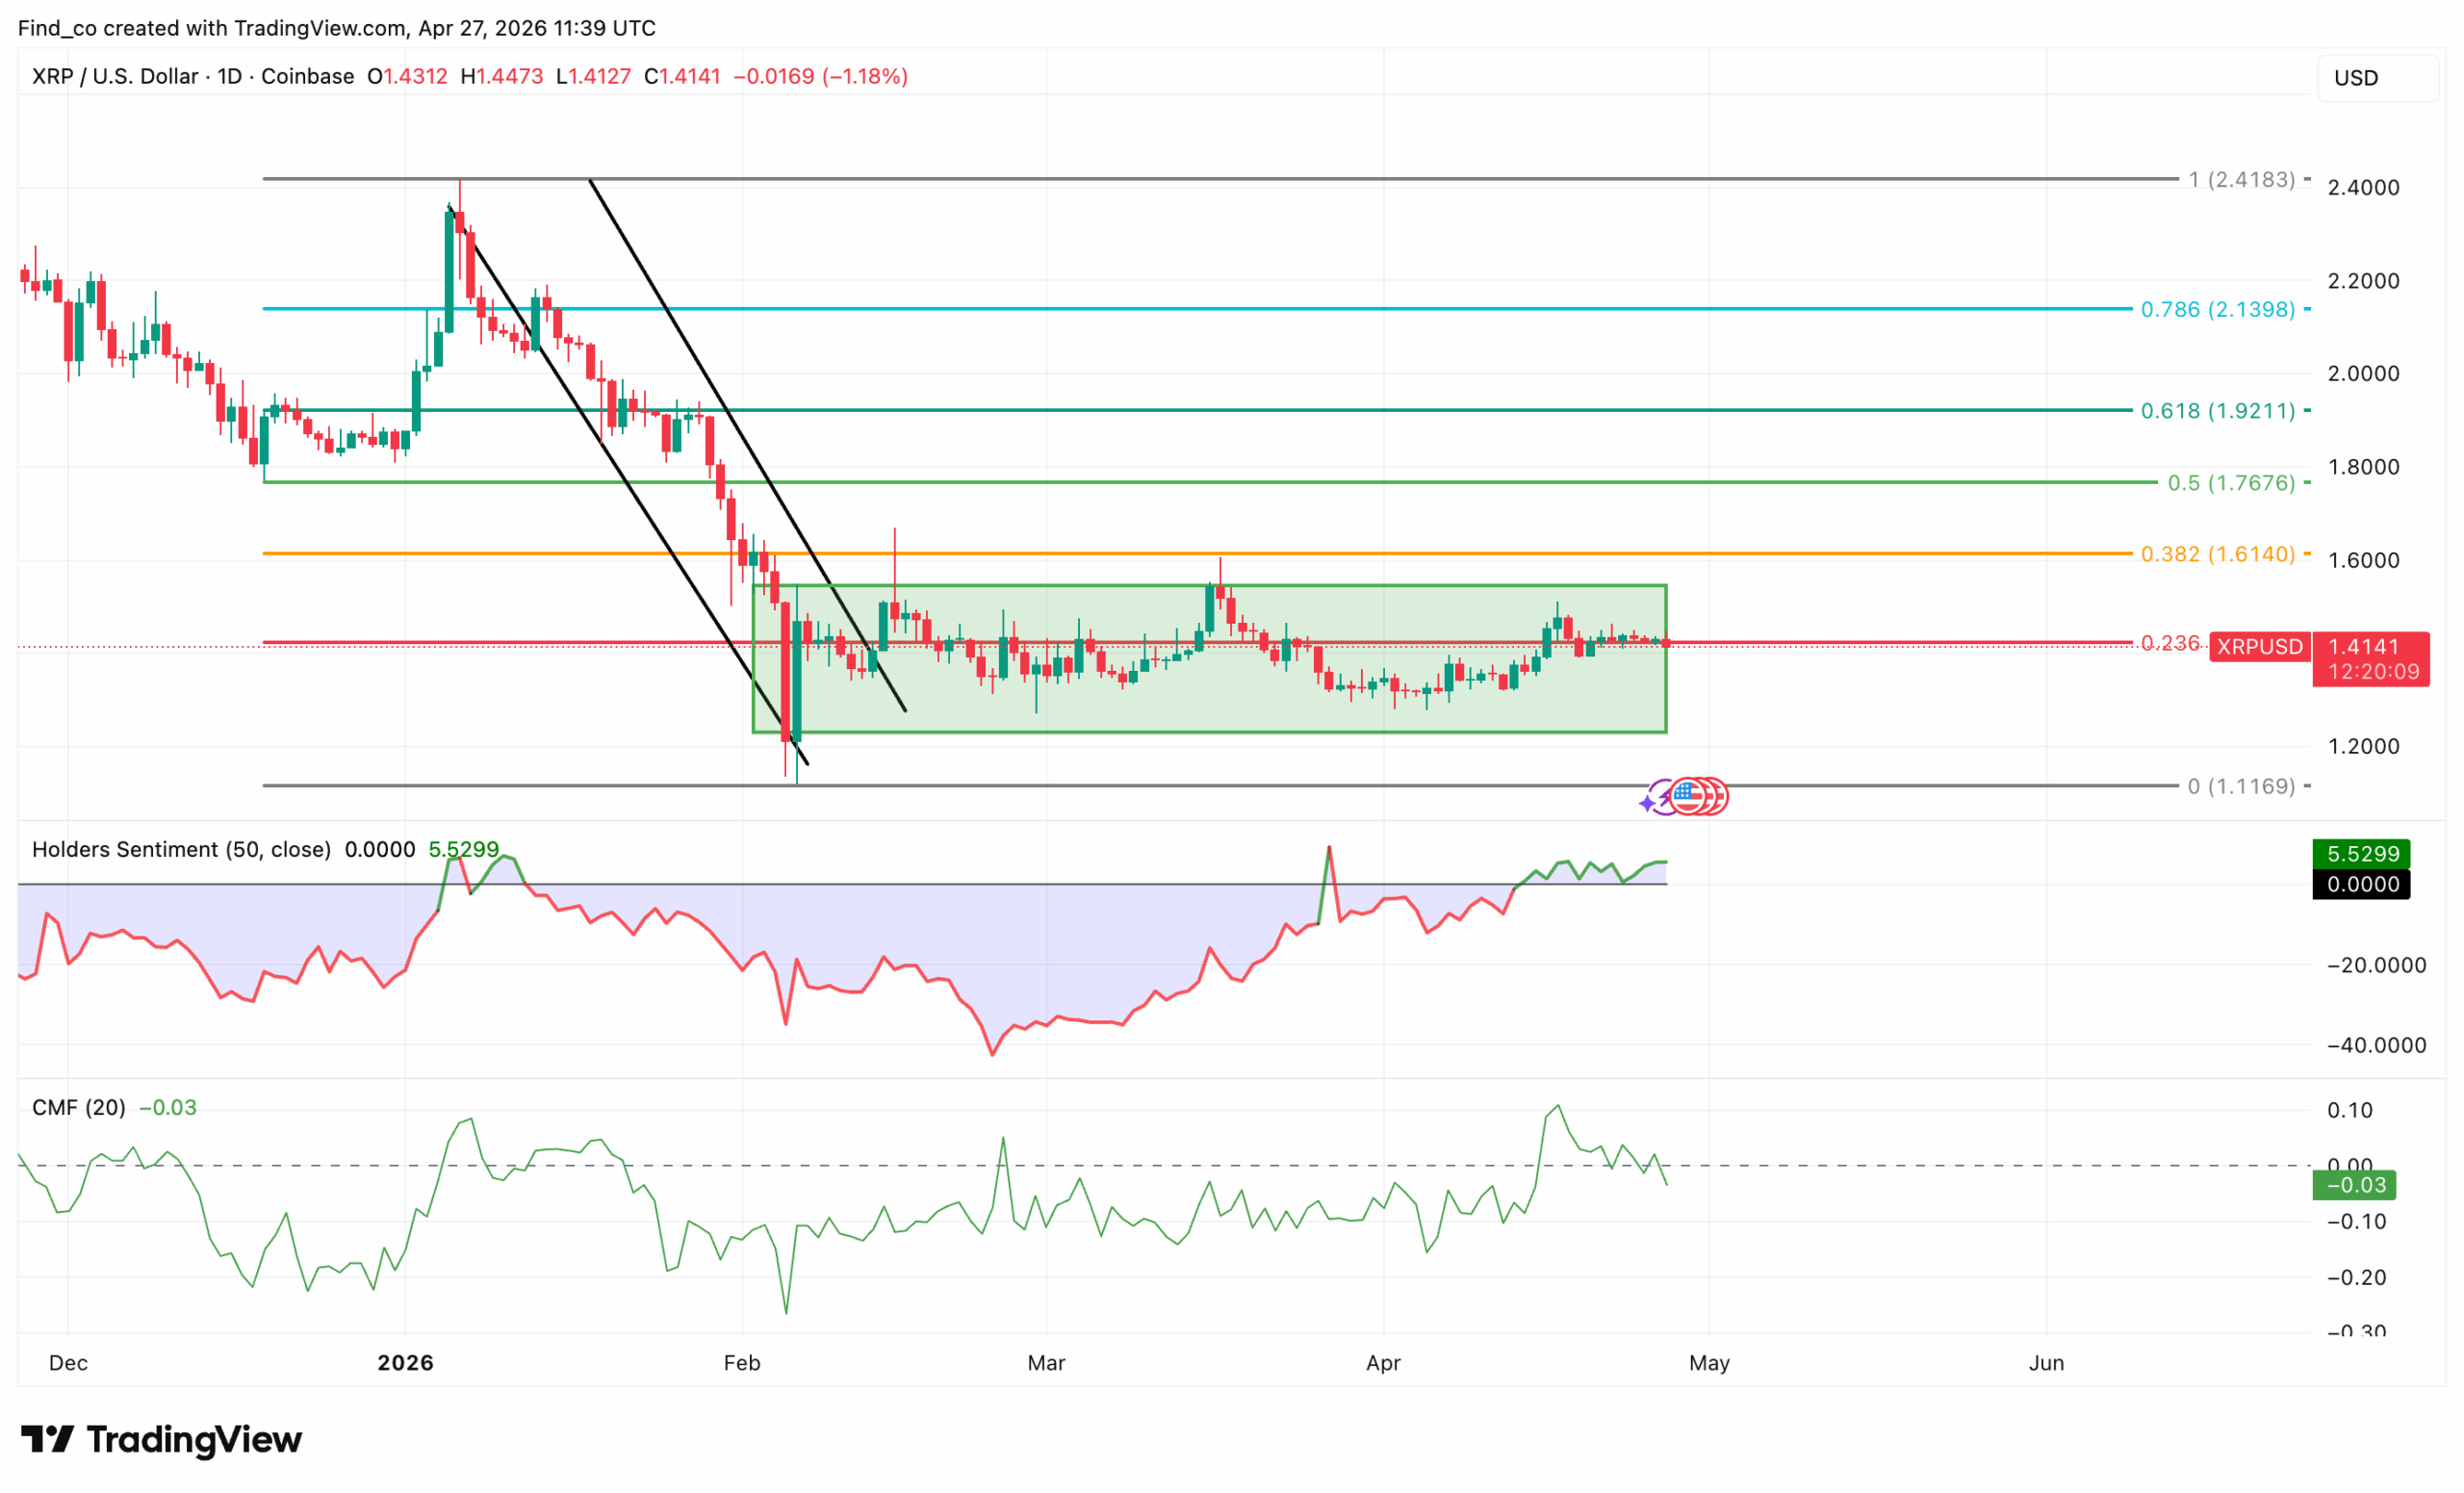
On the daily chart, XRP is clearly range-bound between roughly $1.25 and 1$.50.
Notably, the altcoin is sitting right around the 0.236 Fib ($1.41), which is acting as a midpoint rather than strong support or resistance.
The prior downtrend has already been broken. However, XRP’s price hasn’t transitioned into a sustained uptrend either, which puts it in a neutral accumulation phase.
What stands out is that, despite the price moving sideways, holder sentiment has been steadily rising and is now positive.
This suggests that larger players are gradually positioning rather than exiting. That’s typically constructive over time, but it doesn’t guarantee immediate upside.
At the same time, the Chaikin Money Flow (CMF) is slightly negative. This implies the actual capital inflow hasn’t fully confirmed the sentiment.
So, there’s a bit of a disconnect between positioning and real buying pressure.
Price behavior reflects that conflict. Every move toward $1.50 gets rejected, showing supply is still active, while dips toward $1.30 get bought, forming a stable base.
Disclaimer:
The information provided in this article is for informational purposes only. It is not intended to be, nor should it be construed as, financial advice. We do not make any warranties regarding the completeness, reliability, or accuracy of this information. All investments involve risk, and past performance does not guarantee future results. We recommend consulting a financial advisor before making any investment decisions.
Victor Olanrewaju is a crypto analyst and reporter at CCN with deep roots in on-chain research and technical analysis. His crypto journey began in 2017, but it was the 2020 Uniswap airdrop that sparked a full-time pivot into the space.
With a foundation in copywriting, Victor honed his craft creating high-converting content for leading crypto brokers — most notably an XRP price prediction that ranked #1 on Google during the 2021 bull run.
He later joined AMBCrypto in 2022, where he combined storytelling with technical and on-chain analysis to cover key market narratives.
In 2024, he expanded his expertise at BeInCrypto, collaborating with analysts and using tools like Glassnode, Santiment, and IntoTheBlock to break down Bitcoin and altcoin trends.
At CCN, Victor covers the top cryptocurrencies, memecoins, macro shifts, blending real-time insights with deep-dive metrics.
He holds a Bachelor’s degree in Physics from the University of Ibadan, equipping him to simplify complex data for a wide audience. Follow his work or connect on LinkedIn or X.