Uniswap and PancakeSwap Lead Pack Amid March Record Breaking DEX Volume

Uniswap and PancakeSwap Leading DEXes in March | Credit: Getty Images
Key Takeaways
- Decentralized exchange (DEX) volume reached a new monthly all-time high in March.
- The Uniswap and PancakeSwap DEXes led the way with the highest volume.
- Despite this milestone, the UNI and CAKE prices have corrected for more than two weeks.
The total DEX volume reached a new monthly all-time high in March. Ethereum was the biggest chain, followed by Solana. The DEXes with the highest volume were the Uniswap and PancakeSwap exchanges.
However, the prices of both their native tokens, UNI and CAKE have fallen significantly since the beginning of March. Will the bottom be reached in April, or will the correction continue?
DEX Volume Reaches All-Time High
The DEX volume in March reached a new all-time high of $267 billion, surpassing the $235 billion volume in November 2021. The highest weekly volume was recorded in Uniswap at $15.7 billion followed by PancakeSwap at $10.3 billion. No other DEXes crossed the $4 billion threshold.

The increase in DEX volume is aided by memecoins and liquid staking solutions, especially in the Solana blockchain. Ethereum is the largest chain, followed by Solana and BSC. Even though PancakeSwap is on BSC, Solana has four entries in the top 10, more specifically Orca, Phoenix, Lifintiy and Raydium, leading to its second place classification.
Base, Coinbase’s Layer-2 network broke onto the scene for the first time and is already ranked seventh. A significant portion of the volume in Base comes from its decentralized exchange Aerodrome Finance.
How Long Will UNI Price Correct?
There are several interesting developments for Uniswap, starting from the announcement of the Uniswap extension. The extension will be similar to the Ethereum Name Service (ENS) domains. In the case of Uniswap, users will claim .uni.eth usernames instead of ther wallet addresses, allowing for simpler wallet recognition.
UNI also reached its all-time high for monthly Uniswap volume on Layer 2-s. The greatly reduced transaction fees on Ethereum Layer-2s after the Dencun upgrade likely contributed to this. The top volume tokens in Uniswap are USDT and Wrapped ETH.
Nevertheless, the UNI price has corrected since March 6, likely as part of an A-B-C corrective structure. If so, the price reached the top of wave B on March 30 and is now in wave C.
This possibility is supported by both the RSI and MACD. The RSI fell below 50 (red icon) while the MACD rejected a bullish cross (red circle).

The first potential target for the bottom of the correction is near $10, created by a horizontal support area, 0.618 Fib retracement support level and the resistance trend line of the previous ascending parallel channel.
On the other hand, moving above the wave B high of $13.36 (red line) will invalidate this bearish prediction and indicate the bottom is in.
What About PancakeSwap?
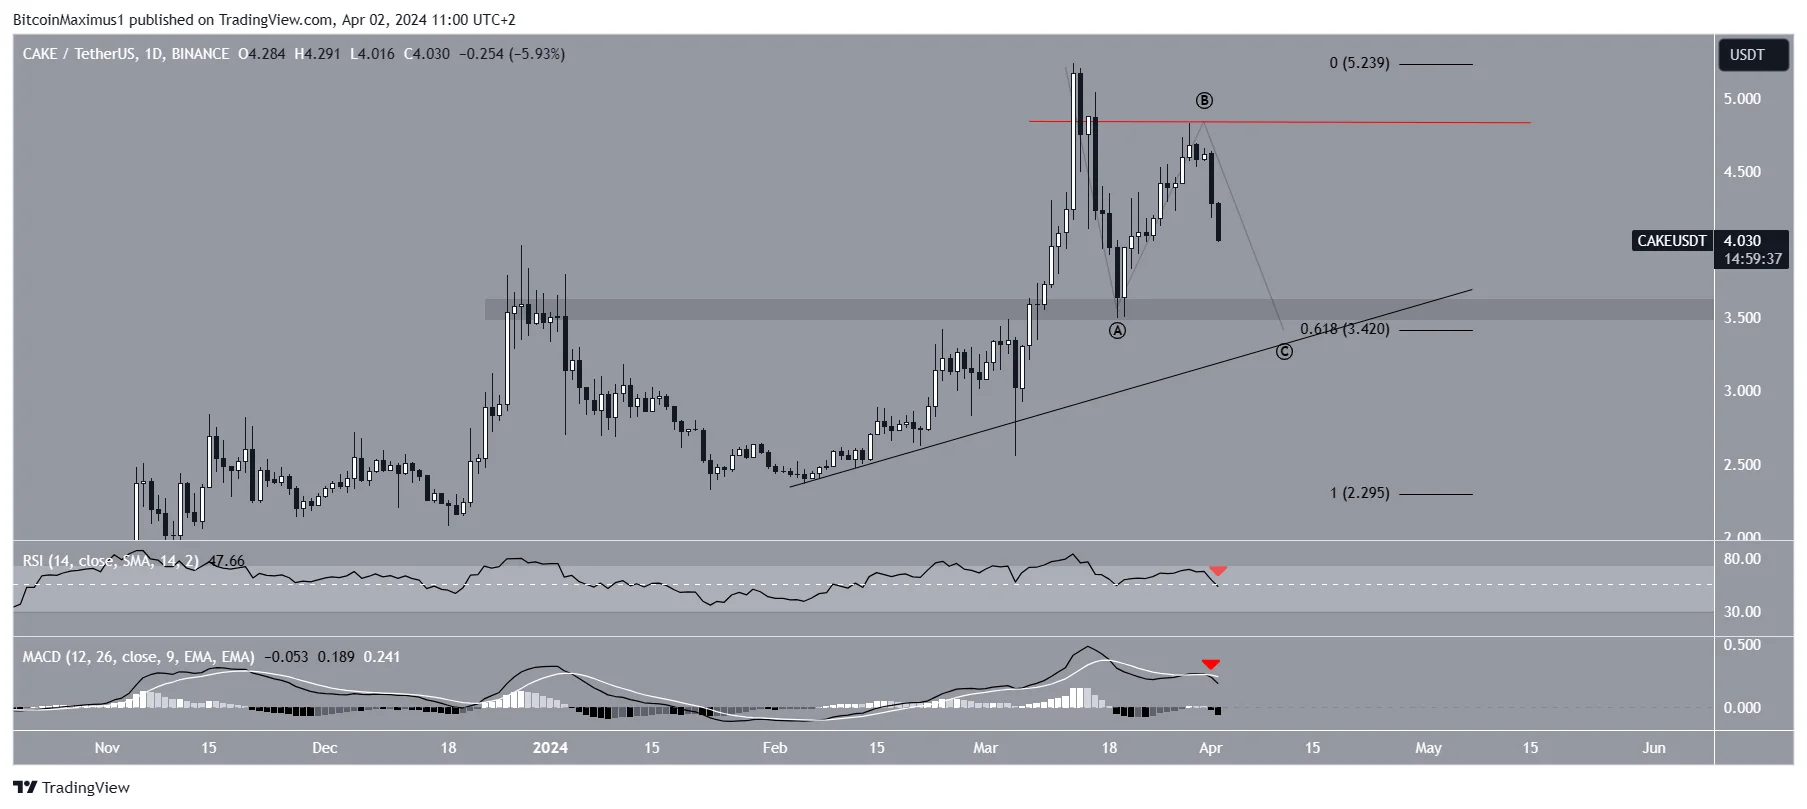
The price movement of CAKE is very similar to that of UNI. The price has fallen since March 13 in what is likely an A-B-C corrective structure. If the count is correct, CAKE started wave C on March 29. The down trending RSI and MACD (red icons) align with this bearish outlook.

A potential target for the bottom of the correction is at $3.42, at the 0.618 Fib retracement support level of the previous upward movement. This would also validate a long-term ascending support trend line.
Similarly to UNI, a movement above the wave B high of $4.83 (red line) will confirm the correction is over.
Marketwide Correction Continues
Despite record high volumes, the price of both UNI and CAKE have corrected since the middle of March. This is likely due to a marketwide crypto correction started by the fall of BTC, underscoring the correlation between cryptocurrency assets.


