UNI price analysis reveals that the token is undervalued, and could hit new highs in 2025.
Share
Key Takeaways
Like several altcoins, Uniswap has suffered inconsistencies in 2025. Yet, the altcoin has refrained from undergoing a notable crash.
However, that does not mean that UNI is close to its previous market top, especially as liquidity has been dropping in the market.
In this analysis, CCN reveals what the Uniswap price prediction for 2025, 2026, and 2030 could be. Read on.
Uniswap Price Prediction
While UNI’s price has decreased lately, there is still a chance that the altcoin might hit new highs before 2025 ends. Thus, in this segment, we examined the Uniswap price prediction for 2025, 2026, and 2030.
Minimum UNIPrice Prediction
Average UNIPrice Prediction
Maximum UNIPrice Prediction
2025
$8.11
$13.79
$19.48
2026
$4.60
$7.91
$10.28
2030
$16.29
$28.67
$50
Uniswap Price Prediction for 2025
In 2025, the Uniswap price prediction will likely hit a minimum value of $8.11. However, altcoins might also see an increase in demand before the year ends. If that happens, then UNI could rally to $19.48.
Get These Top Crypto Casino Offers Now!
Sponsored
Disclosure
We sometimes use affiliate links in our content, when clicking on those we might receive a commission at no extra cost to you. By using this website you agree to our terms and conditions and privacy policy.
By 2026, UNI might not experience a surge in demand as it did in 2025. Due to this, the cryptocurrency’s market value could drop as low as $4.60. At the maximum, Uniswap’s price might climb to $10.28
Uniswap Price Prediction for 2030
The 2030 Uniswap price prediction might be bullish. By this period, cryptos linked to the Ethereum blockchain could be in high demand due to their utility. If that happens, the UNI’s price could trade between $16.29 and $50. In a highly bullish condition, it could hit an all-time high of $50.
UNI Price Analysis
Looking at the weekly chart, Uniswap’s price is in a descending triangle. However, there seems to be strong support around $4.97.
Due to this, the altcoin might not undergo any significant correction. Instead, the market value might bounce above the resistance line.
Should this be the case, UNI’s price might rally toward $16 in the coming months. However, failure to drive high buying pressure might invalidate this outlook.
In the short term, Uniswap’s price might not decline. However, it might continue swinging between $6 and $7.
Uniswap Market Cap to TVL Ratio
The Total Value Locked (TVL) to market cap ratio (TVL ratio) measures the valuation of a decentralized finance (DeFi) project by comparing its market capitalization to the total value of assets locked in its smart contracts. This ratio shows the project’s utilization and links the platform’s health to locked asset value.
A ratio above 1.0 indicates overvaluation because the market cap exceeds the value of assets used in the platform. A ratio below 1.0 indicates undervaluation because the market cap is lower than the value of locked assets.
As of this writing, the Uniswap TVL ratio was 0.75, indicating that the cryptocurrency is undervalued.
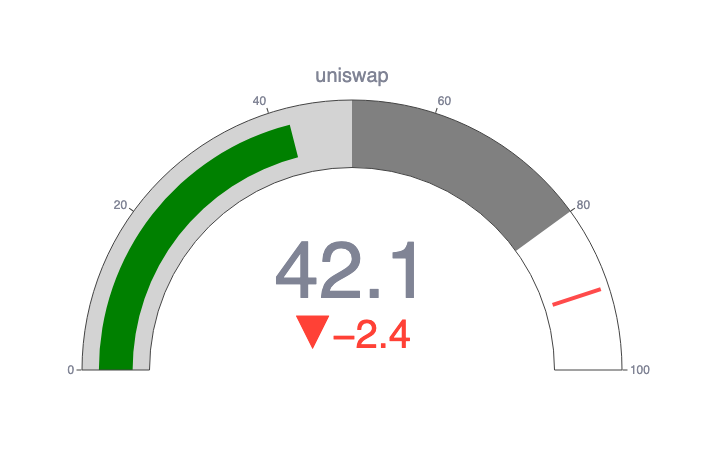
CCN Strength Index
The CCN Strength Index combines an array of advanced market signals to measure the strength of individual cryptocurrencies over the last 30 days.
Every day, it assigns a strength score, ranging from 0 to 100, to the top 500 assets by market capitalization on CoinMarketCap, focusing on both trend direction and the intensity of price movements.
0 to 24: Assets exhibit significant weakness, showing signs of sustained downtrend behavior.
25 to 35: The price tends to move within stable bounds with minimal volatility.
36 to 49: Assets begin a stable uptrend but without strong surges.
50 to 59: Consistent growth with moderate price advances, building momentum.
60+: Sharp price movements and high demand indicate stronger volatility and trend shifts.
The index dynamically adapts to rapid changes. For example, an asset experiencing a 100% increase within a short timeframe would see a sharp jump in its score to reflect the intensity of the rise.
However, should that asset stabilize at this new price level, the score will gradually taper down and align with the dampened momentum as the movement normalizes. The same principle applies to rapid declines: a sudden drop will spike the score downward, but the score will slowly adjust back up as volatility decreases.
We looked at the Uniswap price history and found the lowest prices on certain days, months, quarters, and even weeks in the year, suggesting the best times to buy UNI.
Day of the Week
Sunday
Week
8
Month
January
Quarter
First
Uniswap Price History
Period
Uniswap price
Last week (Oct. 21, 2025)
$6.27
Last month (Sept. 28, 2025)
$7.62
Three months ago (July 28, 2025)
$10.45
Last year (Oct. 28, 2024)
$7.43
Launch price (Sept. 18, 2020)
$0.42
All-time high (May 3, 2021)
$44.97
All-time low (Sept. 17, 2020)
$0.42
Who Owns the Most Uniswap (UNI) Coins?
As of this writing, one wallet holds almost 40% of the total UNI supply.
0x1a9c8182c09f50c8318d769245bea52c32be35bc. This wallet held 371,311,163 UNI, representing 37.13% of the total supply.
0x5a52e96bacdabb82fd05763e25335261b270efcb. This wallet held 28,944,013 UNI, representing 2.89% of the total supply.
0x47173b170c64d16393a52e6c480b3ad8c302ba1e. This wallet held 23,047,480 UNI, representing 2.30% of the total supply.
0xf977814e90da44bfa03b6295a0616a897441acec. This wallet held 17,086,502 UNI, representing 1.71% of the total supply.
0x5069a64bc6616dec1584ee0500b7813a9b680f7e. This wallet also held 15,320,414 UNI, representing 1.53% of the total supply.
Uniswap Supply and Distribution
Supply and Distribution
Figures
Total supply
1,000,000,000
Circulating supply (as of Oct. 28, 2025)
600,483,073 (60.05% of total supply)
Holder distribution
The top 10 holders owned nearly 50% of the total supply as of Oct. 28, 2025
From the Uniswap Whitepaper
In its technical documentation or whitepaper, Uniswap describes itself as a “noncustodial automated market maker.” In other words, it is a decentralized exchange.
It says it offers customers flexible fees, an easy way to check on price changes, and more efficient liquidity.
Uniswap (UNI) Explained
The crypto exchange is a crucial part of the blockchain. Crypto would have no value if there were no place to buy or sell it. However, traditional, centralized exchanges can suffer because a central authority decides which coins and tokens can be sold and exchanged.
Uniswap, which was founded in 2018 by former Siemens engineer Hayden Adams, is an example of a decentralized exchange (DEX). It allows people to list whichever cryptos they want for their desired price.
Uniswap, which is on the Ethereum (ETH) blockchain, is supported by its native cryptocurrency, known by the ticker handle of UNI.
How Uniswap Works
Uniswap uses liquidity pools to supply people with cryptocurrencies and ensure the price is right.
They are supported by liquidity providers, whose job is to ensure that they are deposited in equal amounts.
In other words, the platform is an automated market maker.
It has a permissionless design structure, meaning anyone can use it.
UNI is a governance token, which means that people who hold it can vote on changes to Uniswap.
Because Uniswap is based on Ethereum, it is a token, not a coin. You might see references to a Uniswap coin price prediction, but these are wrong.
Is Uniswap a Good Investment?
It is hard to say. At the same time, the recent launch of Uniswap v4 should have given the token a boost, but that hasn’t happened. Investors must hope that Unichain will make a difference and that the market will perform better.
As with crypto, you must do your research before deciding whether or not to invest in UNI.
Will Uniswap go up or down?
No one can tell right now. While the Uniswap crypto price predictions are largely optimistic, price predictions have a well-earned reputation for being wrong. Keep in mind that prices can and do go down and up.
Should I invest in Uniswap?
Before deciding whether to invest in Uniswap, you will have to research UNI and other related coins and tokens, such as SushiSwap (SUSHI). Either way, you must also ensure you never invest more money than you can afford to lose.
As of Oct. 28, 2025, 600 million UNI were in circulation out of a total supply of one billion.
Will Uniswap reach $100?
It could do but, if it does, it will not be for quite some time. Price predictions based on technical analysis say it won’t happen until at least the 2030s.
Keep in mind that UNI’s all-time high, which it reached at the start of May 2021, is less than half of that, coming in at $42.44.
What is Uniswap used for?
The UNI token is used to give people the right to vote on changes to the Uniswap decentralized exchange. UNI can also be bought, sold and traded on exchanges.
Victor Olanrewaju is a crypto analyst and reporter at CCN with deep roots in on-chain research and technical analysis. His crypto journey began in 2017, but it was the 2020 Uniswap airdrop that sparked a full-time pivot into the space.
With a foundation in copywriting, Victor honed his craft creating high-converting content for leading crypto brokers — most notably an XRP price prediction that ranked #1 on Google during the 2021 bull run.
He later joined AMBCrypto in 2022, where he combined storytelling with technical and on-chain analysis to cover key market narratives.
In 2024, he expanded his expertise at BeInCrypto, collaborating with analysts and using tools like Glassnode, Santiment, and IntoTheBlock to break down Bitcoin and altcoin trends.
At CCN, Victor covers the top cryptocurrencies, memecoins, macro shifts, blending real-time insights with deep-dive metrics.
He holds a Bachelor’s degree in Physics from the University of Ibadan, equipping him to simplify complex data for a wide audience. Follow his work or connect on LinkedIn or X.