Home / Analysis / Crypto / Technical Analysis / Toncoin Price Rockets To Six-Month High Following Telegram’s TON Takeover: 3 On-Chain Signals Predict $4 Could Be Next
We sometimes use affiliate links in our content, when clicking on those we might receive a commission at no extra cost to you. By using this website you agree to our terms and conditions and privacy policy.
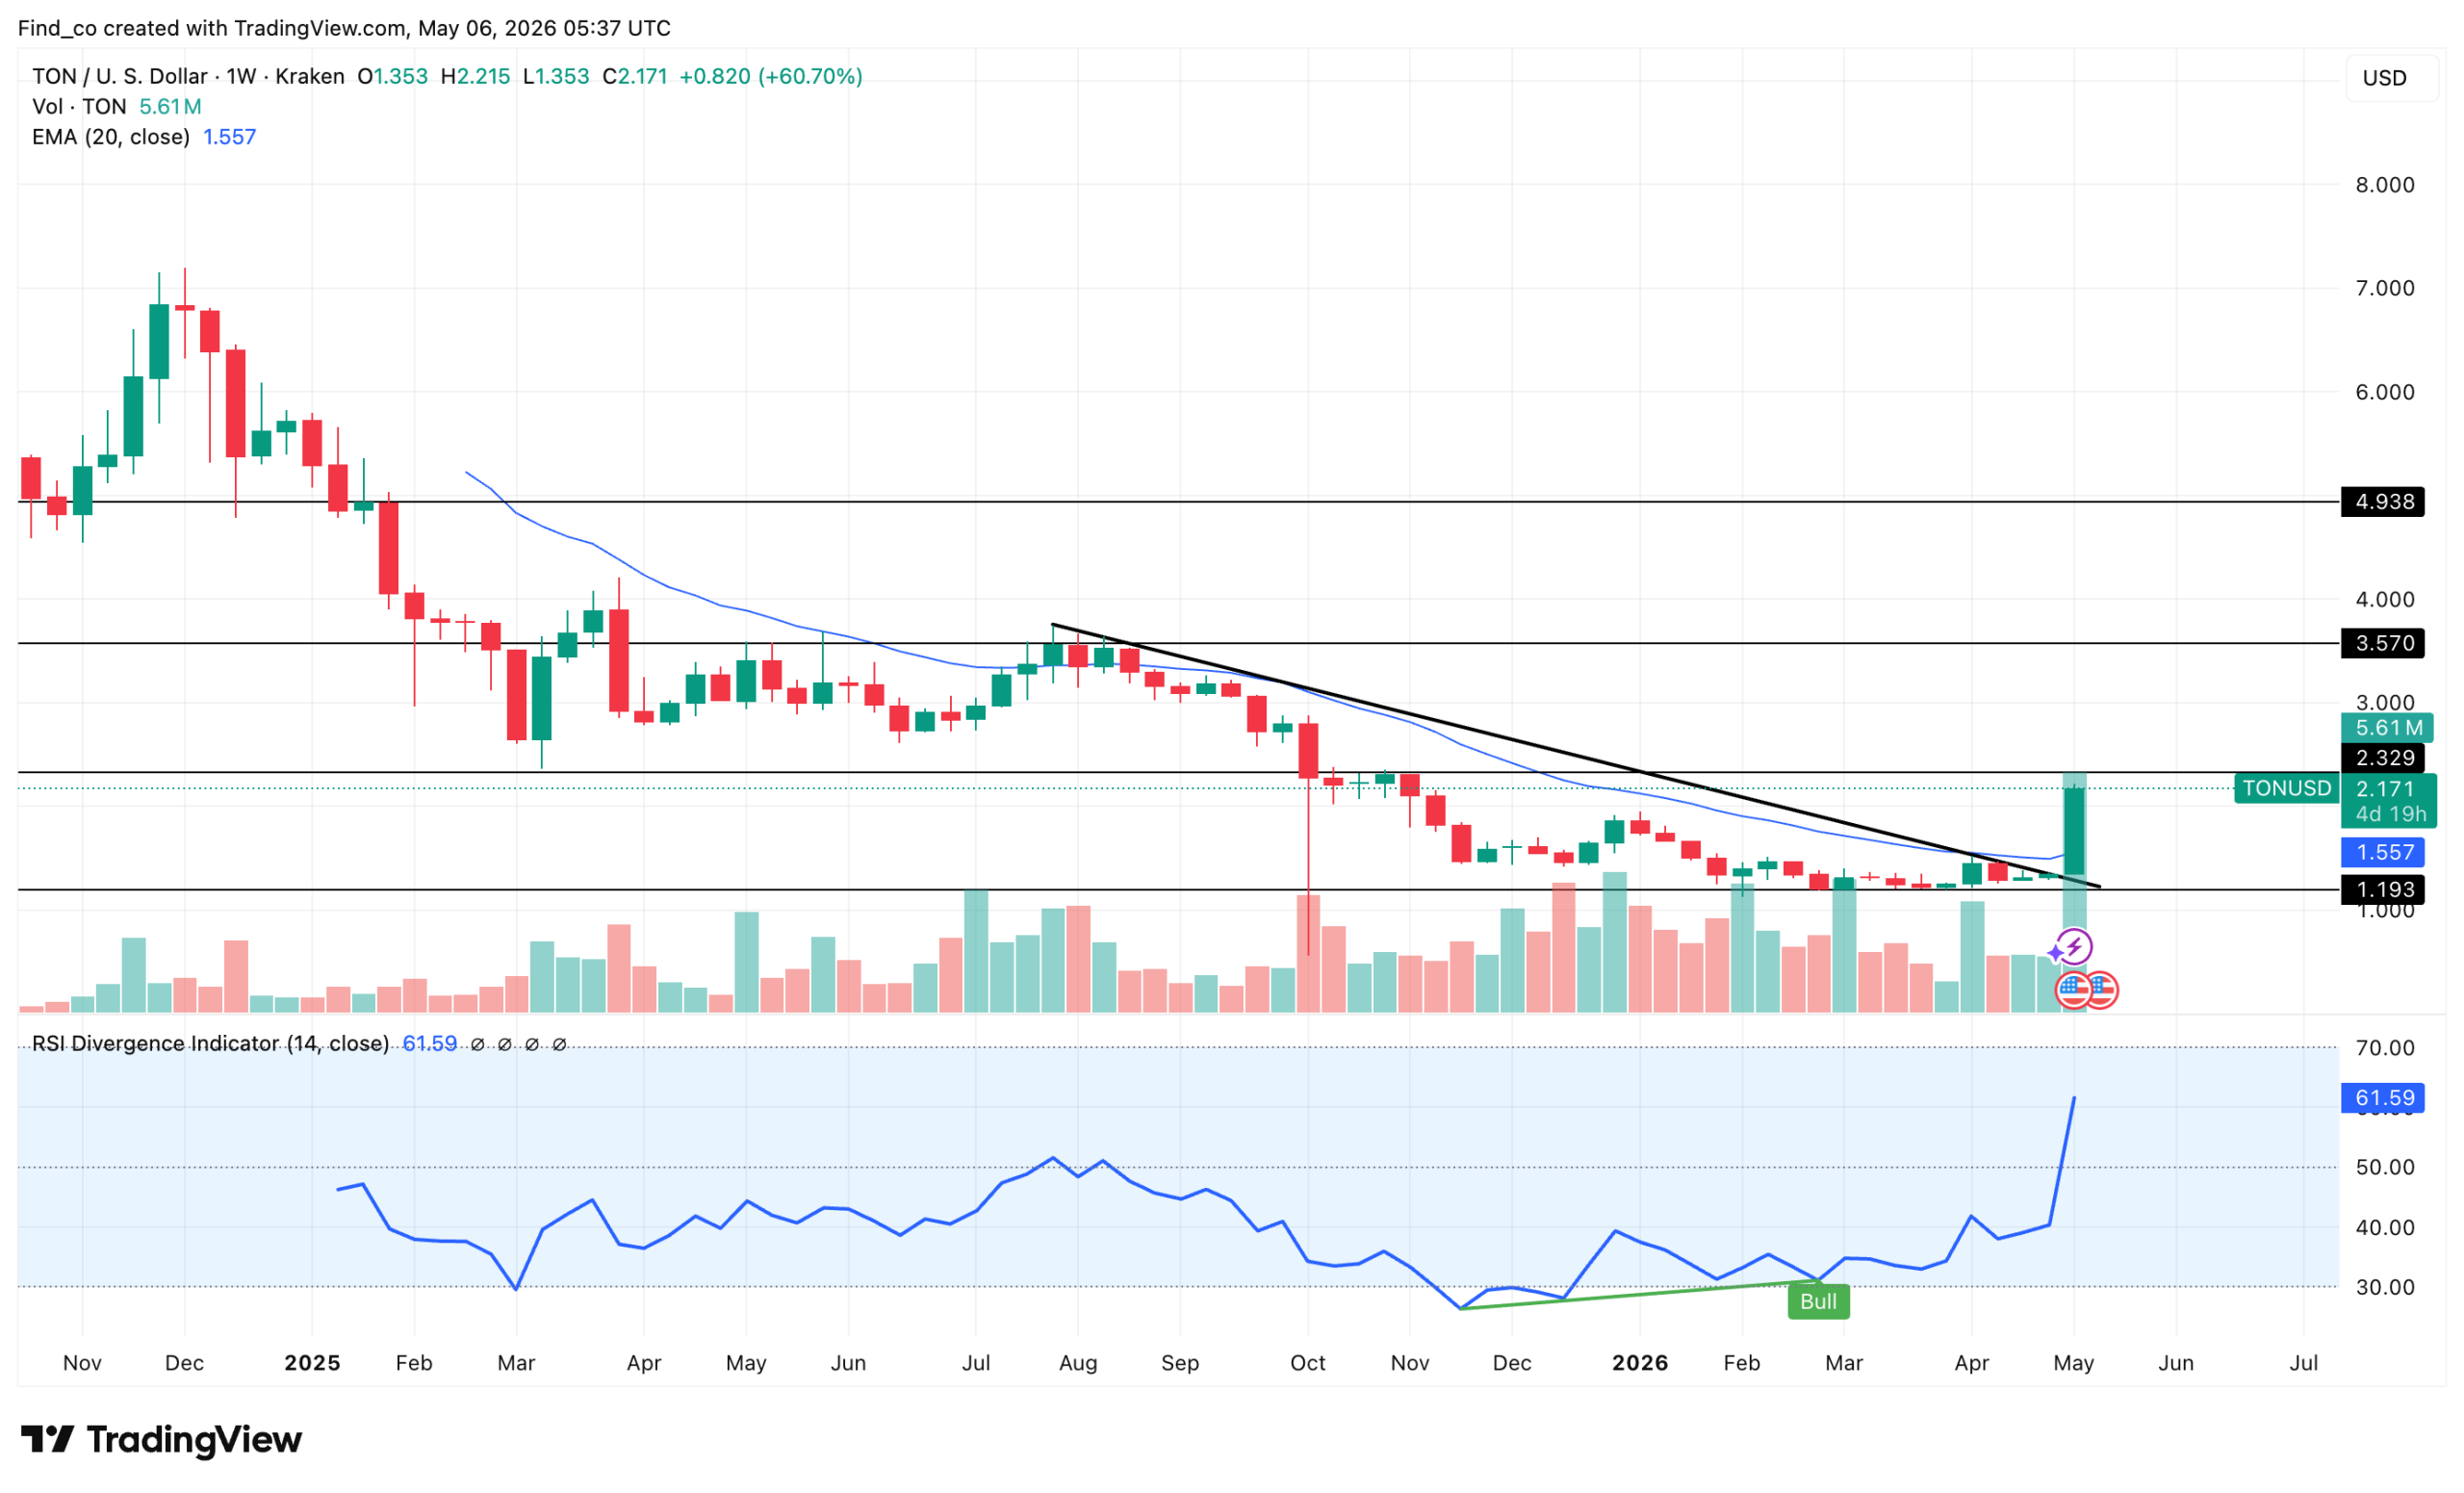
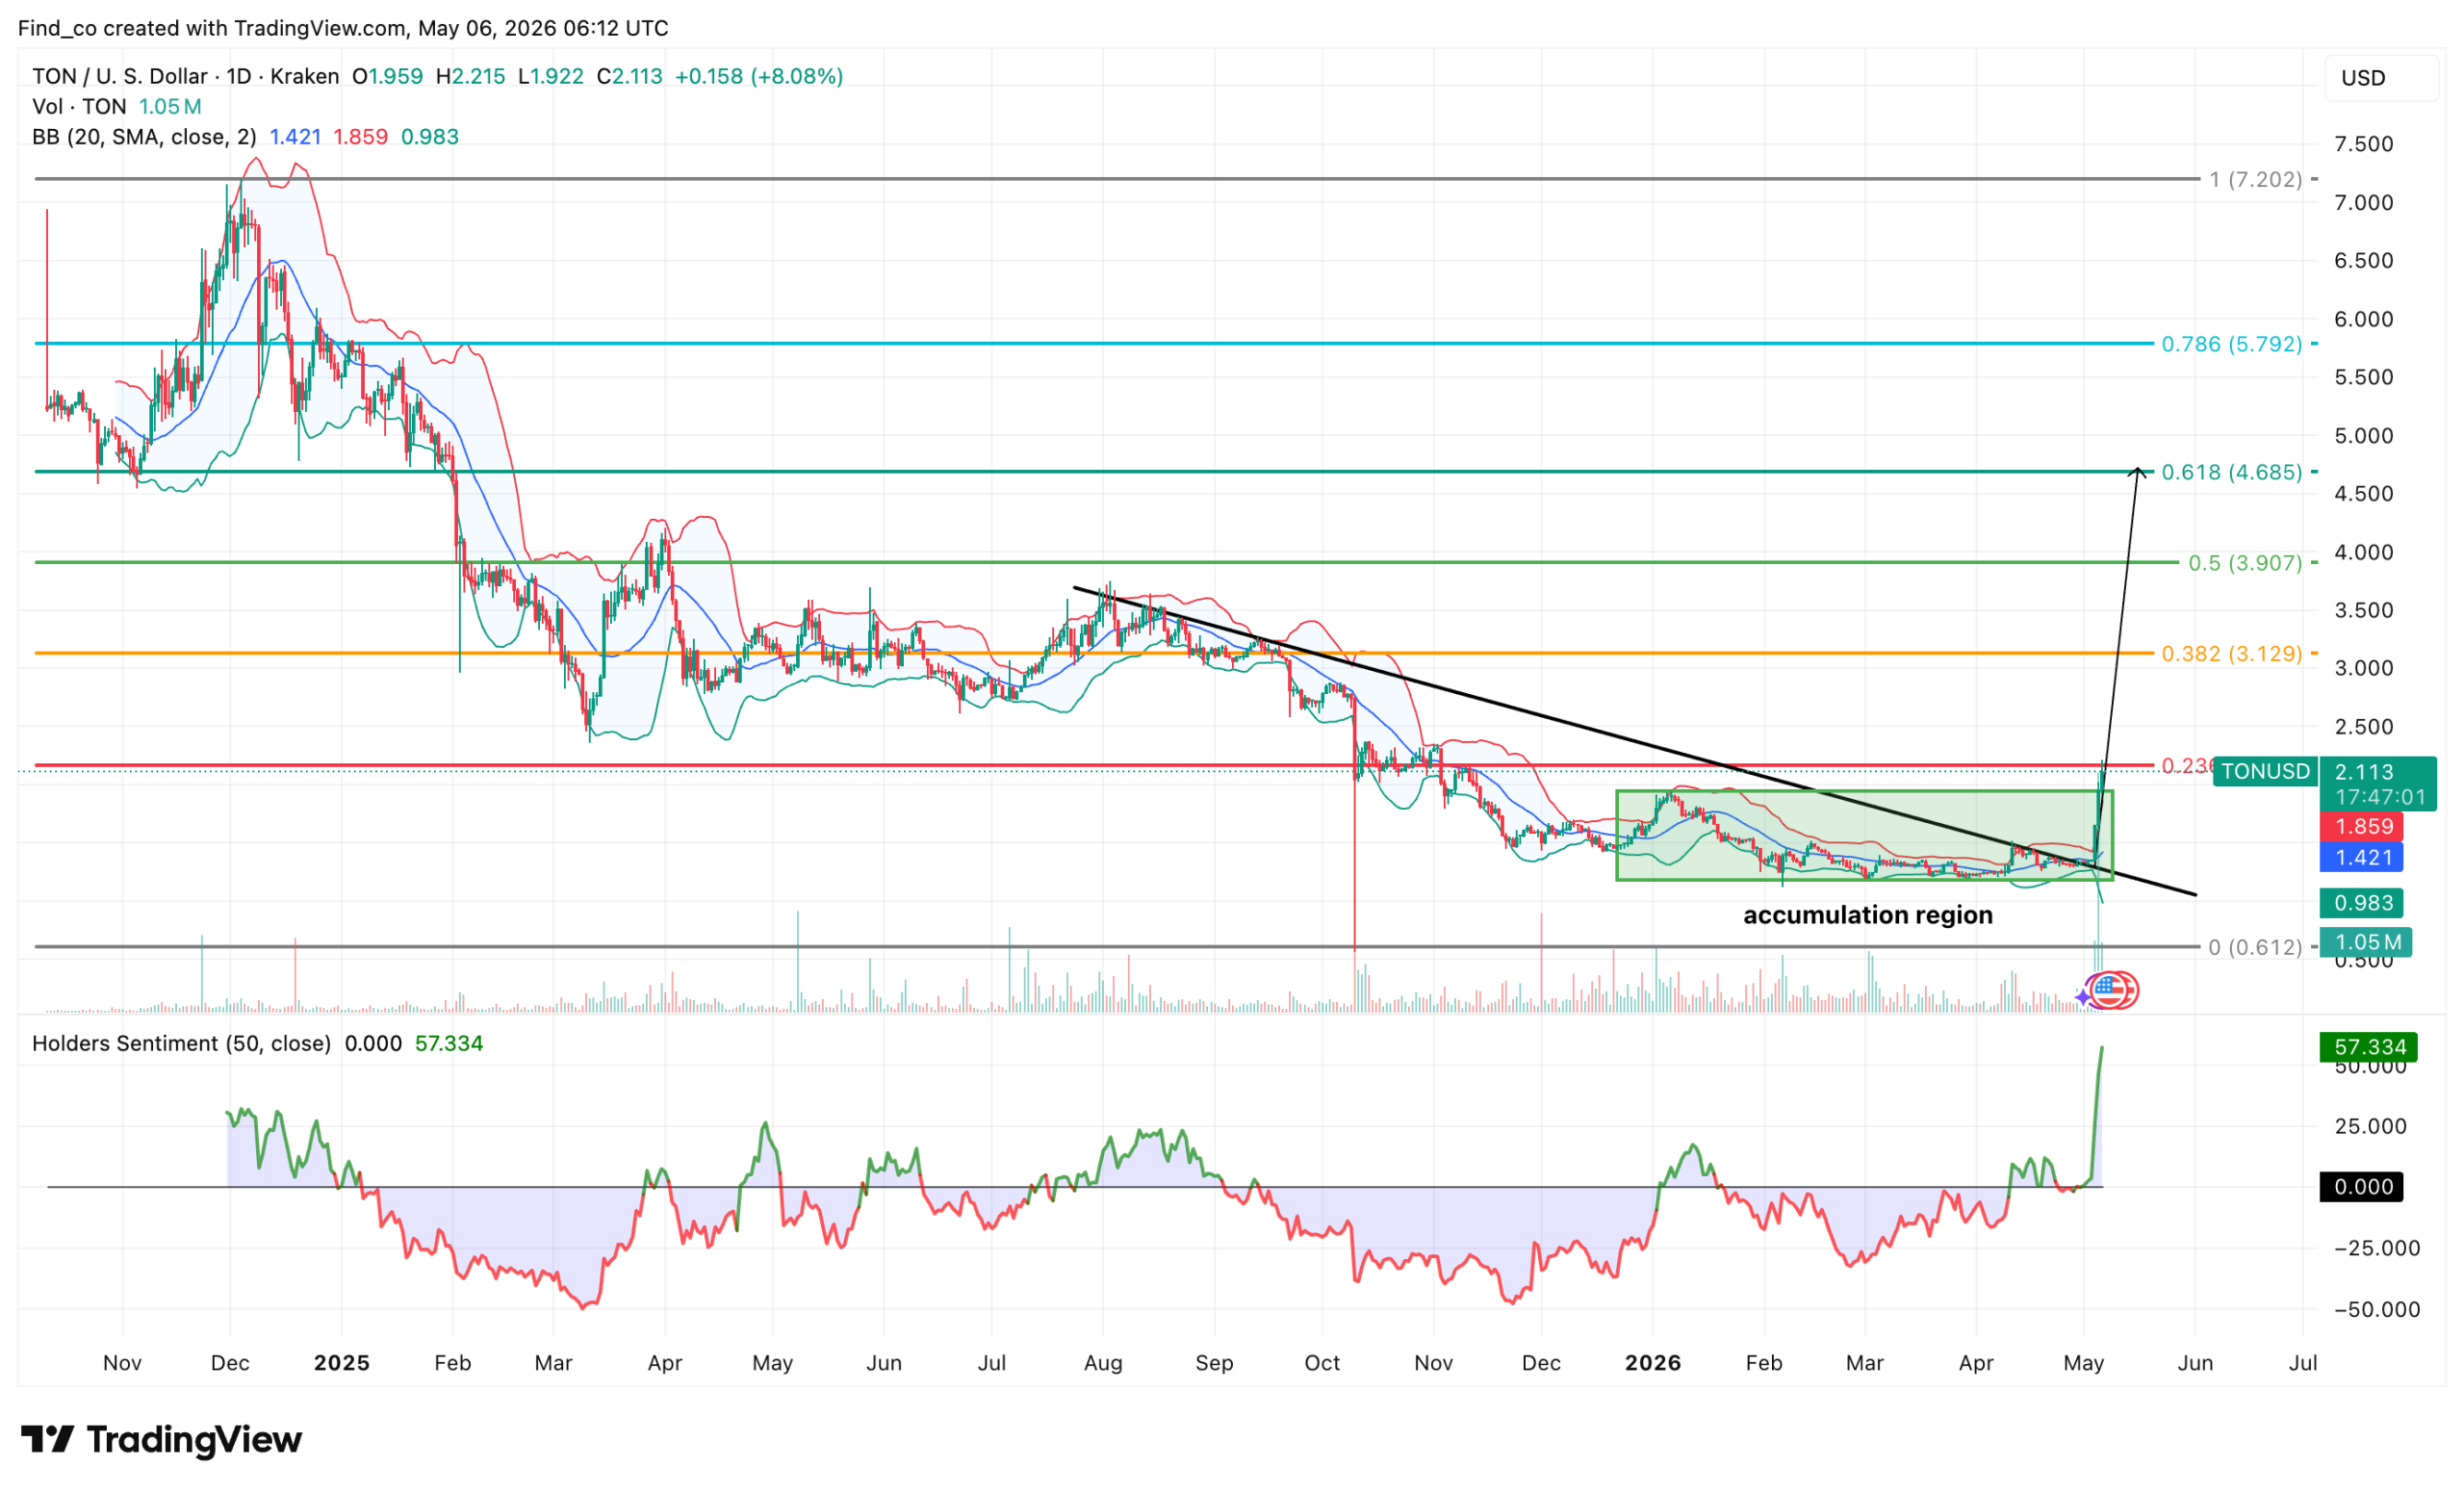
For months, Toncoin’s price had been compressing under a clear descending resistance while consistently making lower highs, reflecting sustained selling pressure.
That structure kept momentum suppressed, with price trading below the 20 EMA.
What changed this week is the push through that trendline, accompanied by a large bullish candle and a clear increase in volume.
The move up also ensured that TON flipped $2, which previously acted as a key support and resistance zone.
Breaking back above it suggests a shift in market perception from accumulation to the early bullish phase.
At the same time, RSI has surged after spending a long period in weaker ranges, reinforcing that momentum is no longer neutral or bearish but actively turning bullish.
What makes this surge important is not just the size of the candle, but where it’s happening: at the end of a long compression under resistance.
However, the sustainability of this move now depends on whether Toncoin’s price can hold above the broken trendline.
If that happens, then the altcoin will likely test the overhead resistance near $3.58.
Rising Gains, Not Overvalued
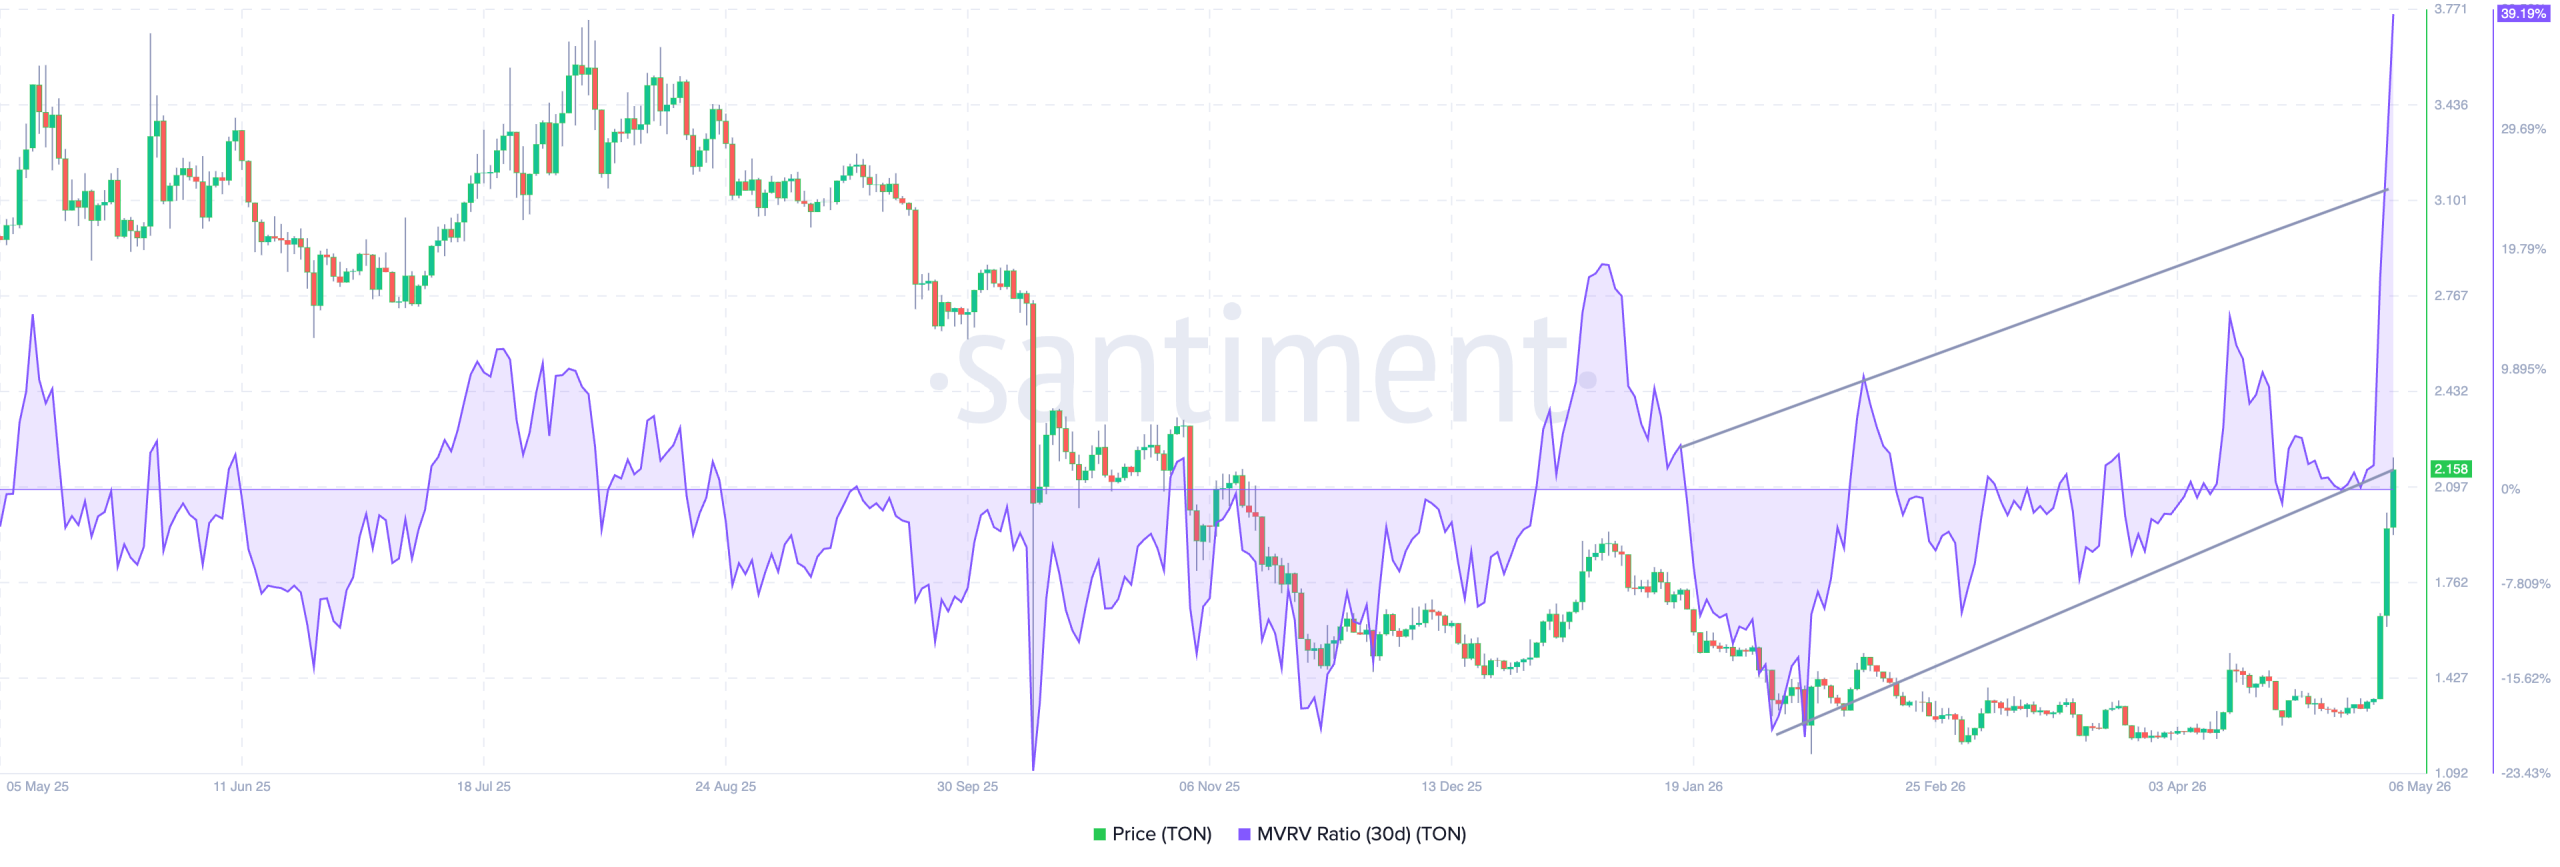
From an on-chain perspective, CCN also noticed some bullish signals.
For instance, Santiment data shows a spike in TON’s 30-day Market Value to Realized Value (MVRV) ratio.
This means that a large portion of short-term holders are now in profit.
This typically happens when strong demand quickly reprices the asset, which aligns with the breakout we’re seeing in Toncoin’s price.
In the short term, this supports continuation.
As long as momentum holds, TON can push toward the next key resistance around $3.58, with a stronger extension toward $4.9 if buying pressure persists.
However, because MVRV has risen so quickly, it also increases the likelihood of profit-taking.
If momentum slows, TON’s price could pull back or consolidate around $2, which now acts as support.
So the spike is bullish for continuation.
But it also signals that volatility will increase as continuation depends on sustained inflows.
Besides that, the positive is that TON is still 74% down from its all-time high, meaning it cannot be tagged as overvalued yet.
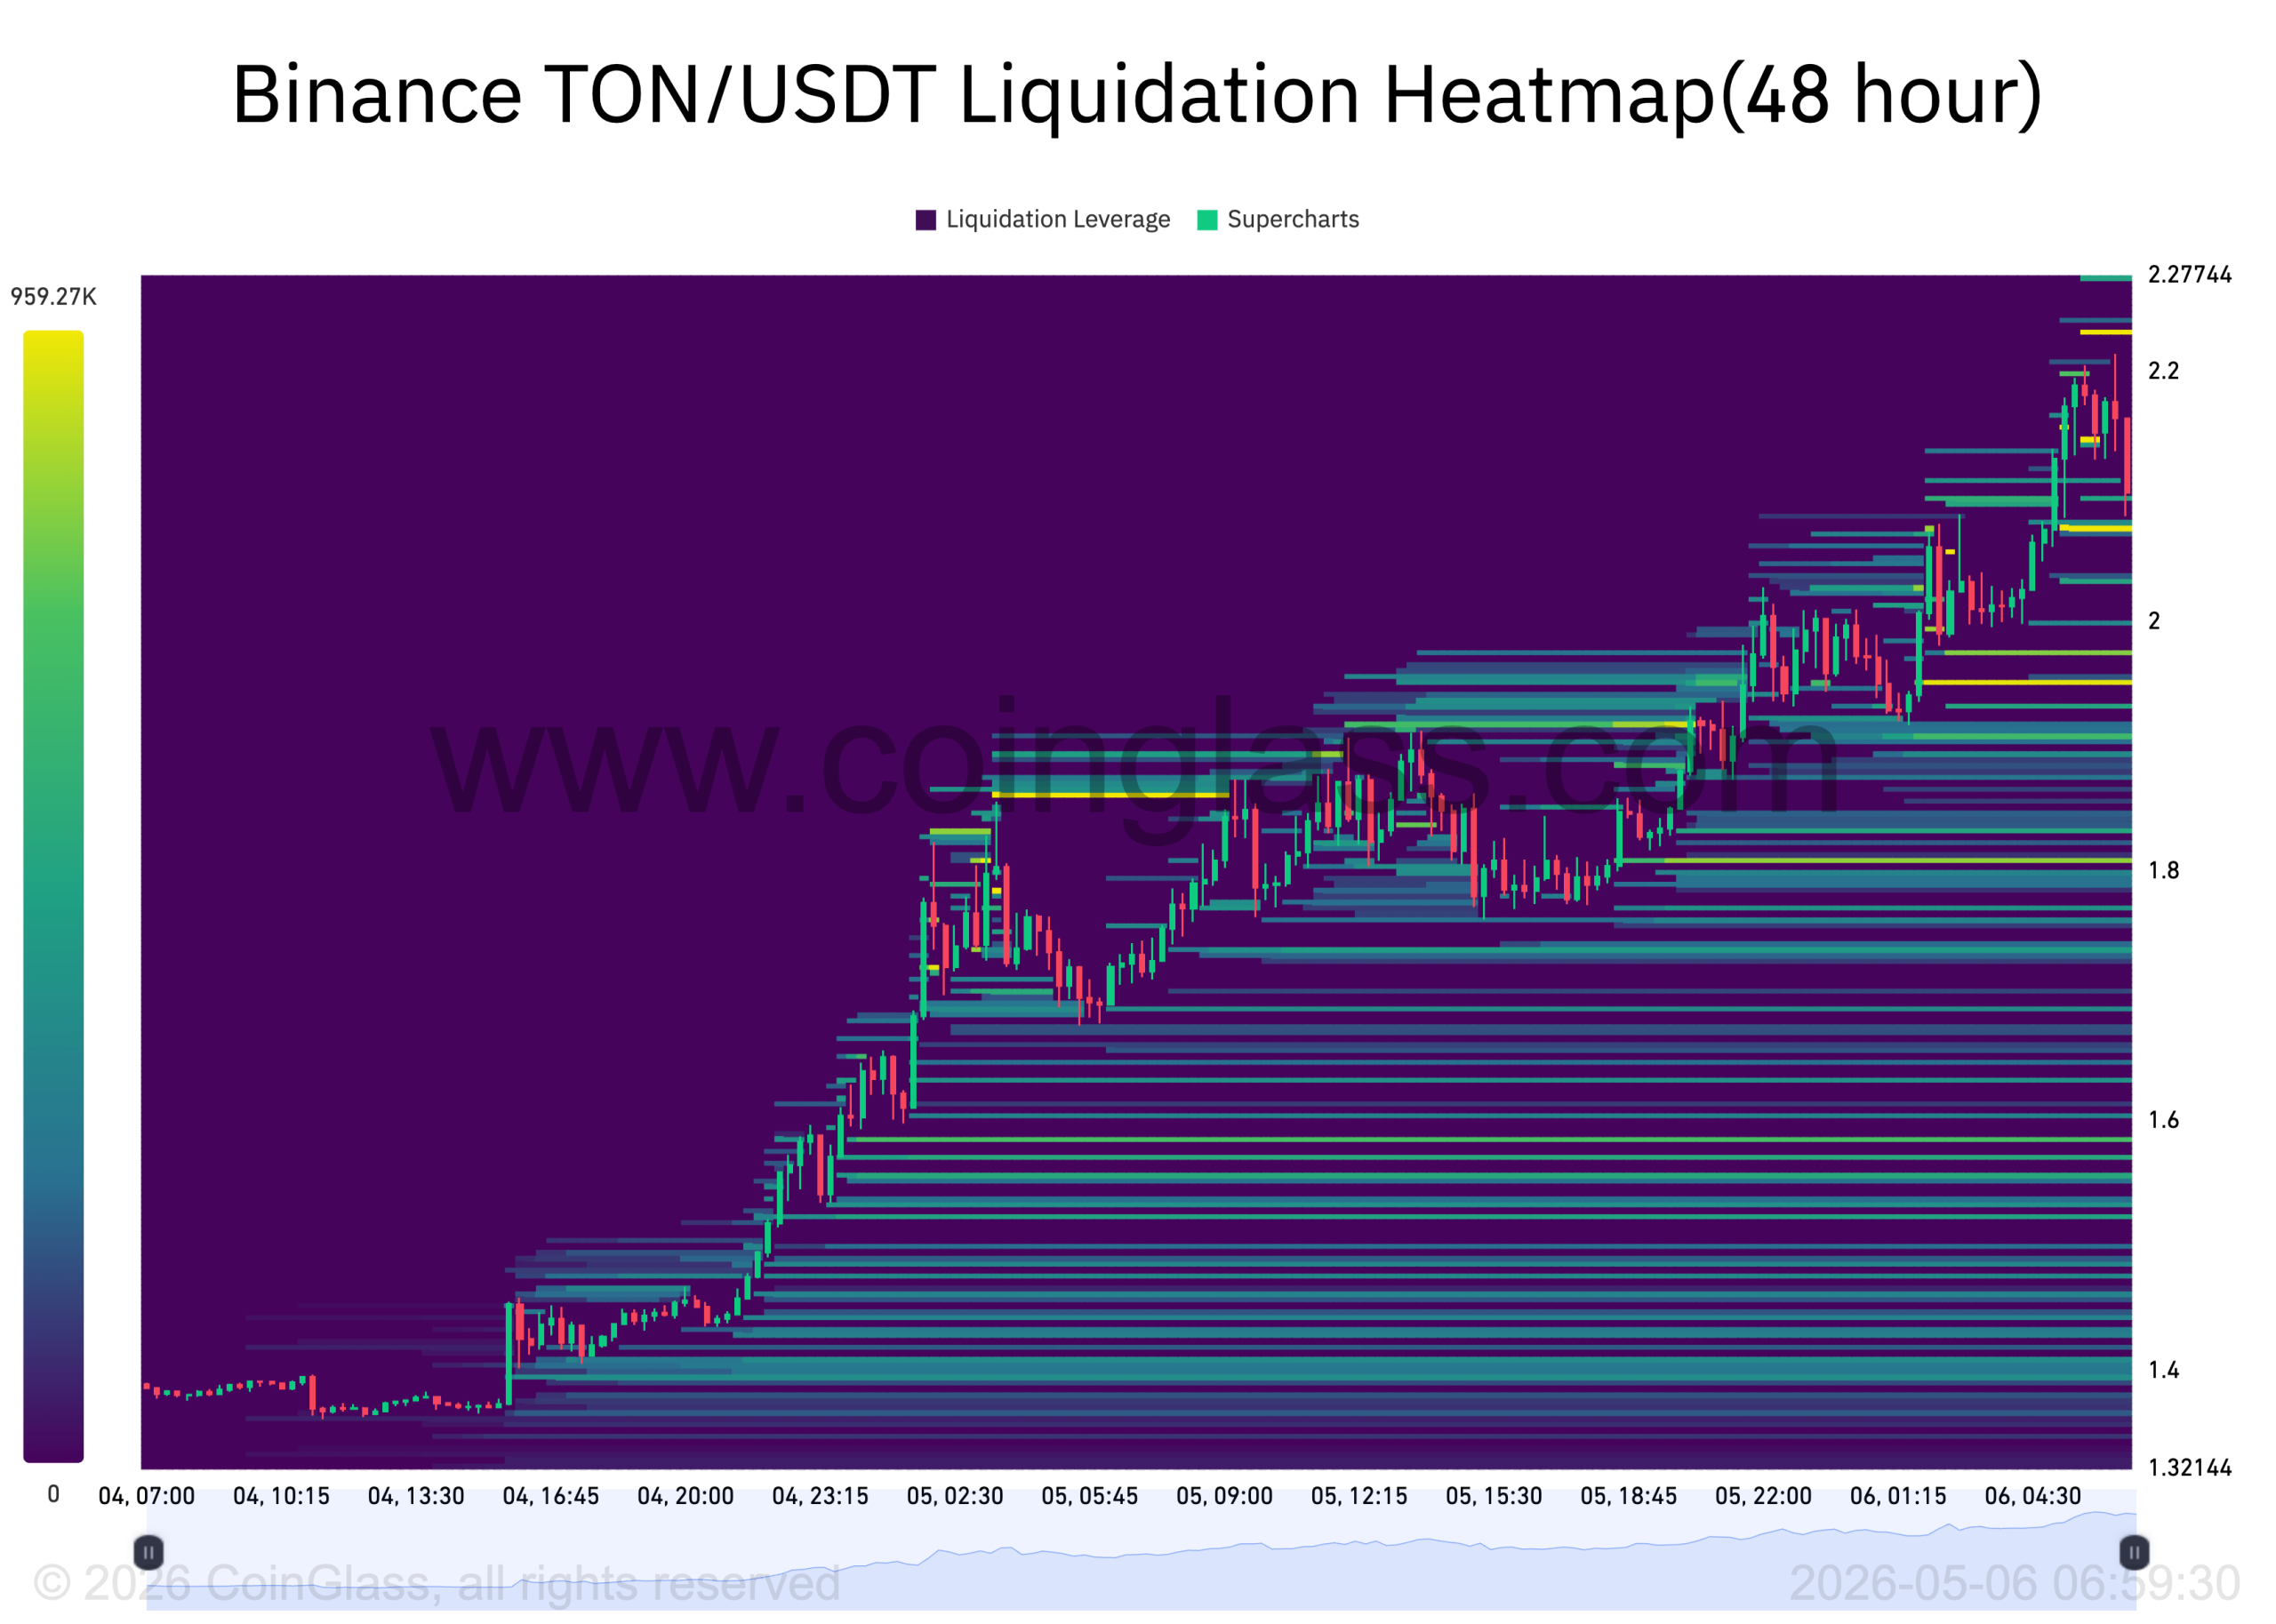
TON Liquidation Heatmap Provides More Context
Furthermore, the heatmap shows liquidity clearly stacked above and below TON’s current price.
But the key takeaway is how the token has been grinding upward into clusters of short liquidations.
As prices move up, it’s consistently tapping into these liquidity pockets (the brighter horizontal bands), which likely represent leveraged shorts being liquidated.
Interestingly, this could help drive the move higher through a potential short squeeze, as the price gets pulled toward liquidity sitting above.
Right now, there’s still a noticeable concentration of liquidity slightly above the $2.25 area, suggesting TON may continue to push higher to clear those levels.
At the same time, there’s heavy liquidity resting below, which acts as a magnet if momentum weakens — meaning any pullback could be sharp as price hunts those liquidation zones.
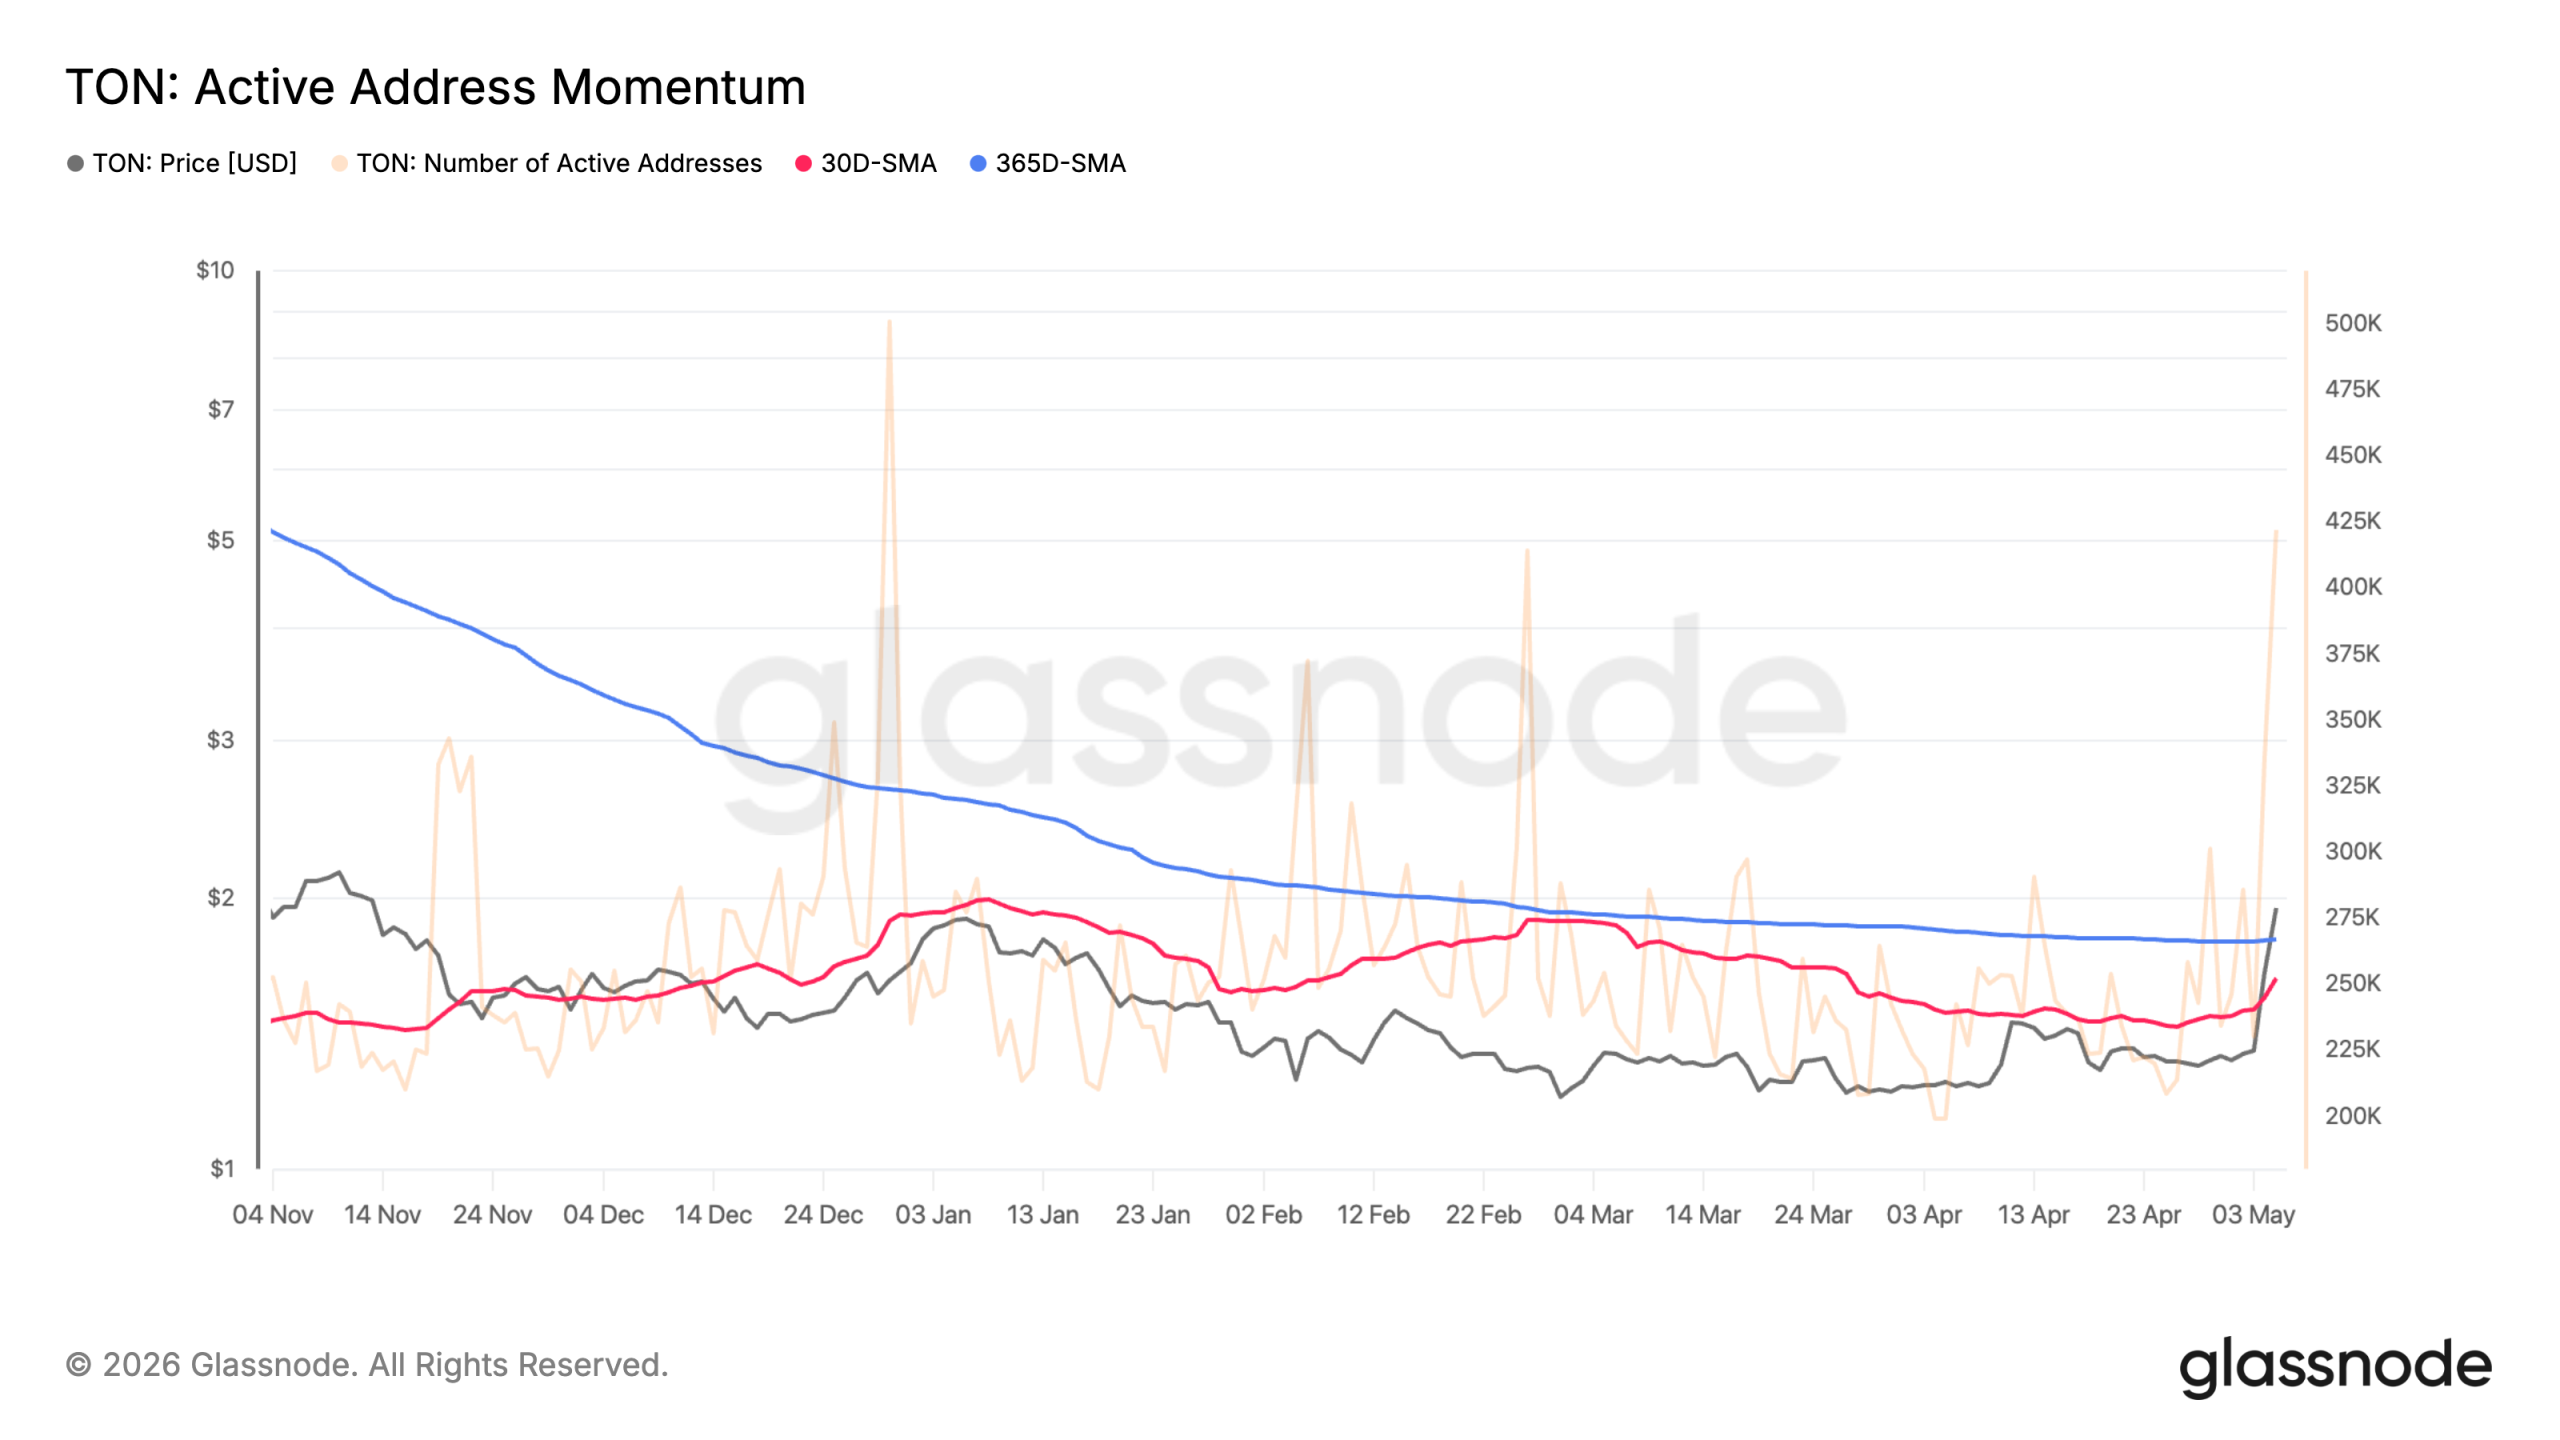
Network Activity Heats Up
In the meantime, Glassnode data shows that TON’s recent price surge is now being supported by a clear pickup in network activity, which strengthens the bullish case.
Active addresses (orange) have surged, climbing to one of their highest levels in months.
This indicates real user growth and increased on-chain usage, not just speculative trading.
At the same time, the short-term trend (30D SMA, red) is starting to turn back up after a period of decline, suggesting momentum is shifting back to positive.
What’s important is that this comes after a long period in which activity was relatively flat while prices were weak.
Historically, this kind of divergence often precedes a breakout, and now we’re seeing Toncoin’s price and activity rise together, which is a healthier trend structure.
What changed is the recent breakout as TON pushed above both the range and the trendline, signaling that buyers have finally taken control.
Furthermore, the Bollinger Bands (BB) are now widening after a long squeeze, which typically marks the start of a volatility expansion phase.
This aligns with the breakout, suggesting this move isn’t just a short-term spike but the beginning of a larger trend.
At the same time, holder sentiment has flipped strongly positive, confirming that positioning has shifted from distribution to accumulation and now into early bullish momentum.
If this breakout holds above $2, the next major upside targets are around $3.13 (0.382 Fib), followed by $4.69 near 0.618 Fib.
Victor Olanrewaju is a crypto analyst and reporter at CCN with deep roots in on-chain research and technical analysis. His crypto journey began in 2017, but it was the 2020 Uniswap airdrop that sparked a full-time pivot into the space.
With a foundation in copywriting, Victor honed his craft creating high-converting content for leading crypto brokers — most notably an XRP price prediction that ranked #1 on Google during the 2021 bull run.
He later joined AMBCrypto in 2022, where he combined storytelling with technical and on-chain analysis to cover key market narratives.
In 2024, he expanded his expertise at BeInCrypto, collaborating with analysts and using tools like Glassnode, Santiment, and IntoTheBlock to break down Bitcoin and altcoin trends.
At CCN, Victor covers the top cryptocurrencies, memecoins, macro shifts, blending real-time insights with deep-dive metrics.
He holds a Bachelor’s degree in Physics from the University of Ibadan, equipping him to simplify complex data for a wide audience. Follow his work or connect on LinkedIn or X.