Going public is expected to improve institutional visibility, provide shareholder liquidity, and fuel growth for its Solana-focused investments.
Despite the milestone, Solana’s price has shown little reaction. After looking into the details, it seems the community has met the announcement with skepticism.
Here’s a closer look at the Solana DAT — and why the market isn’t impressed.
Solana DAT
At first glance, a Solana DAT is a bullish catalyst for the SOL price.
After all, one of the primary catalysts of the Ethereum bull run and period of outperformance was the numerous treasuries conducting massive buys.
Kyle Samani from Multicoin Capital will chair the Solana DAT, aiming to raise $1 billion in funding.
However, the community has not received the news of a Solana DAT as well for numerous reasons.
Get These Top Crypto Casino Offers Now!
Sponsored
Disclosure
We sometimes use affiliate links in our content, when clicking on those we might receive a commission at no extra cost to you. By using this website you agree to our terms and conditions and privacy policy.
Several large accounts believe the Solana DAT will act as exit liquidity for insiders, leaving retail to hold the bag.
The main reason is that the company is allegedly buying locked tokens at full price, not at a discount, as is usually true.
The locked tokens cannot drive up the SOL price, but cannot be sold immediately to create selling pressure.
Because of this, the company’s Net Asset Value (NAV) may look inflated on paper, but the market may discount it.
Hence, the usual flywheel of selling stock to raise more cash and buy SOL is weaker, mainly if the market discounts the NAV, hurting shareholder value.
This is unlike other spot ETFs, which buy liquid and tradeable cryptos and base their NAV on the value of these tokens.
The entire thing sounds like financial engineering, where SOL Strategies may be acting as a liquidity provider for early investors or projects stuck with locked tokens, creating doubt about its intentions.
Solana Price Analysis
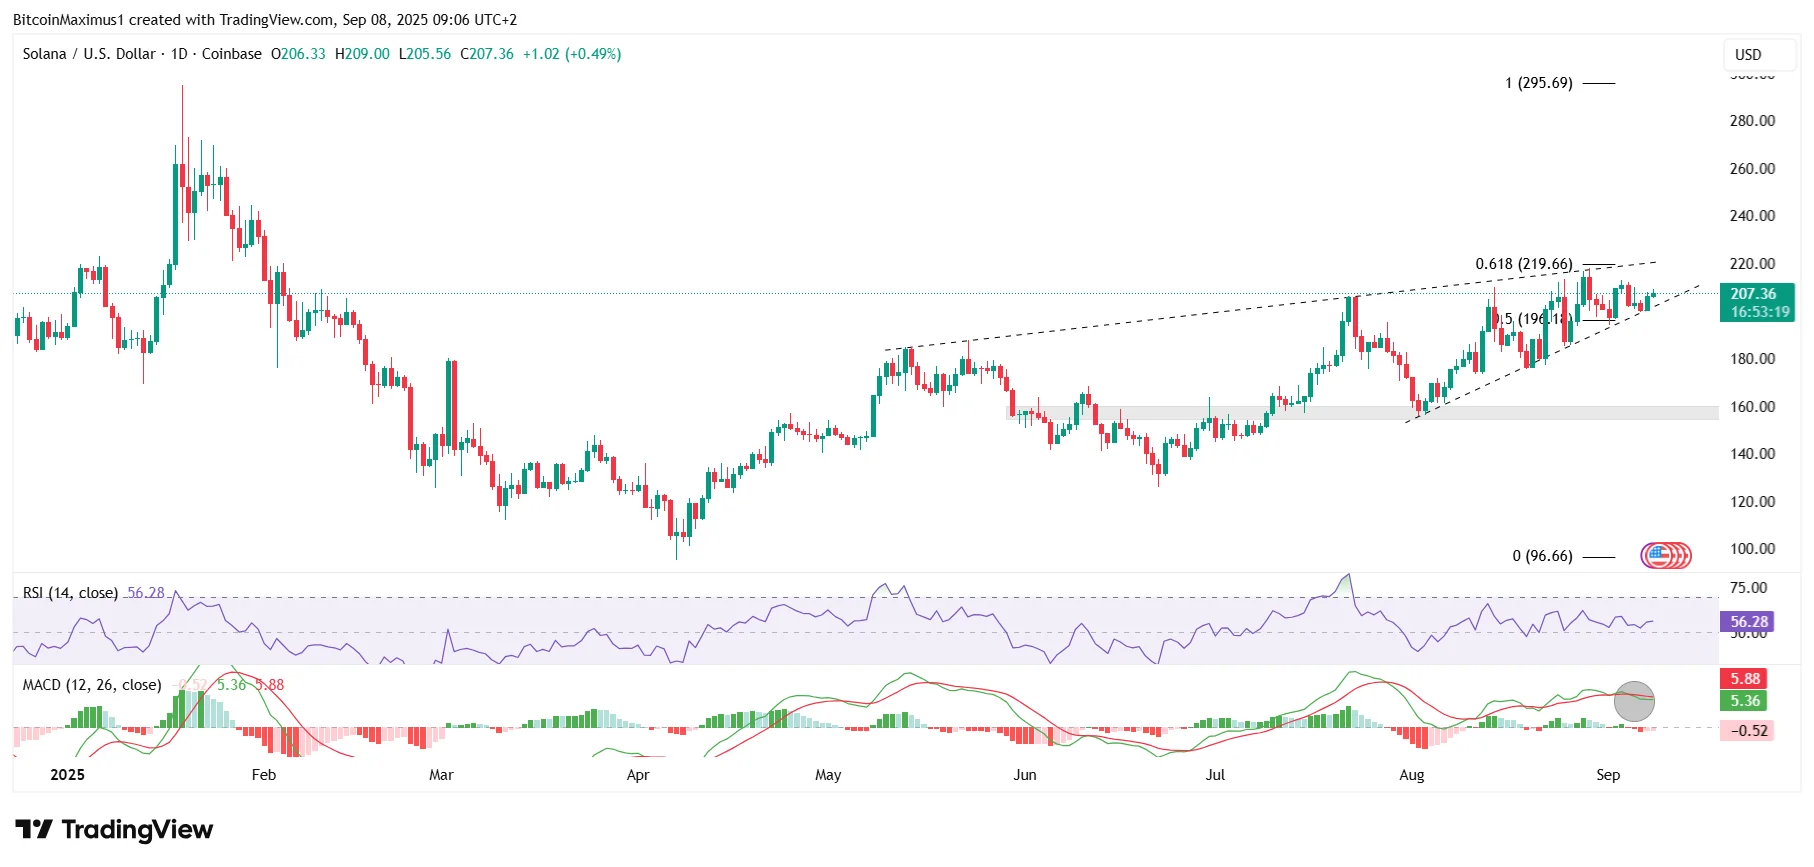
SOL’s price has more than doubled since its $95.16 low on April 7, hitting a high of $217.95 on Aug. 25.
While the rally is significant, the SOL price trades well below its all-time high, and inside a critical resistance area between the 0.5-0.618 Fibonacci retracement resistance levels.
Additionally, the movement since June has slowed considerably, casting doubt on whether the increase is just a correction.
Solana trades near the end of an ascending wedge, a bearish pattern from which a breakdown is likely.
Based on the price movement and Solana’s position relative to resistance, a breakdown from the wedge is more likely than a breakout and close above $220.
Momentum indicators also reflect this weakness. The Relative Strength Index (RSI) is almost below 50, while the Moving Average Convergence/Divergence (MACD) made a bearish cross.
What’s Next for SOL?
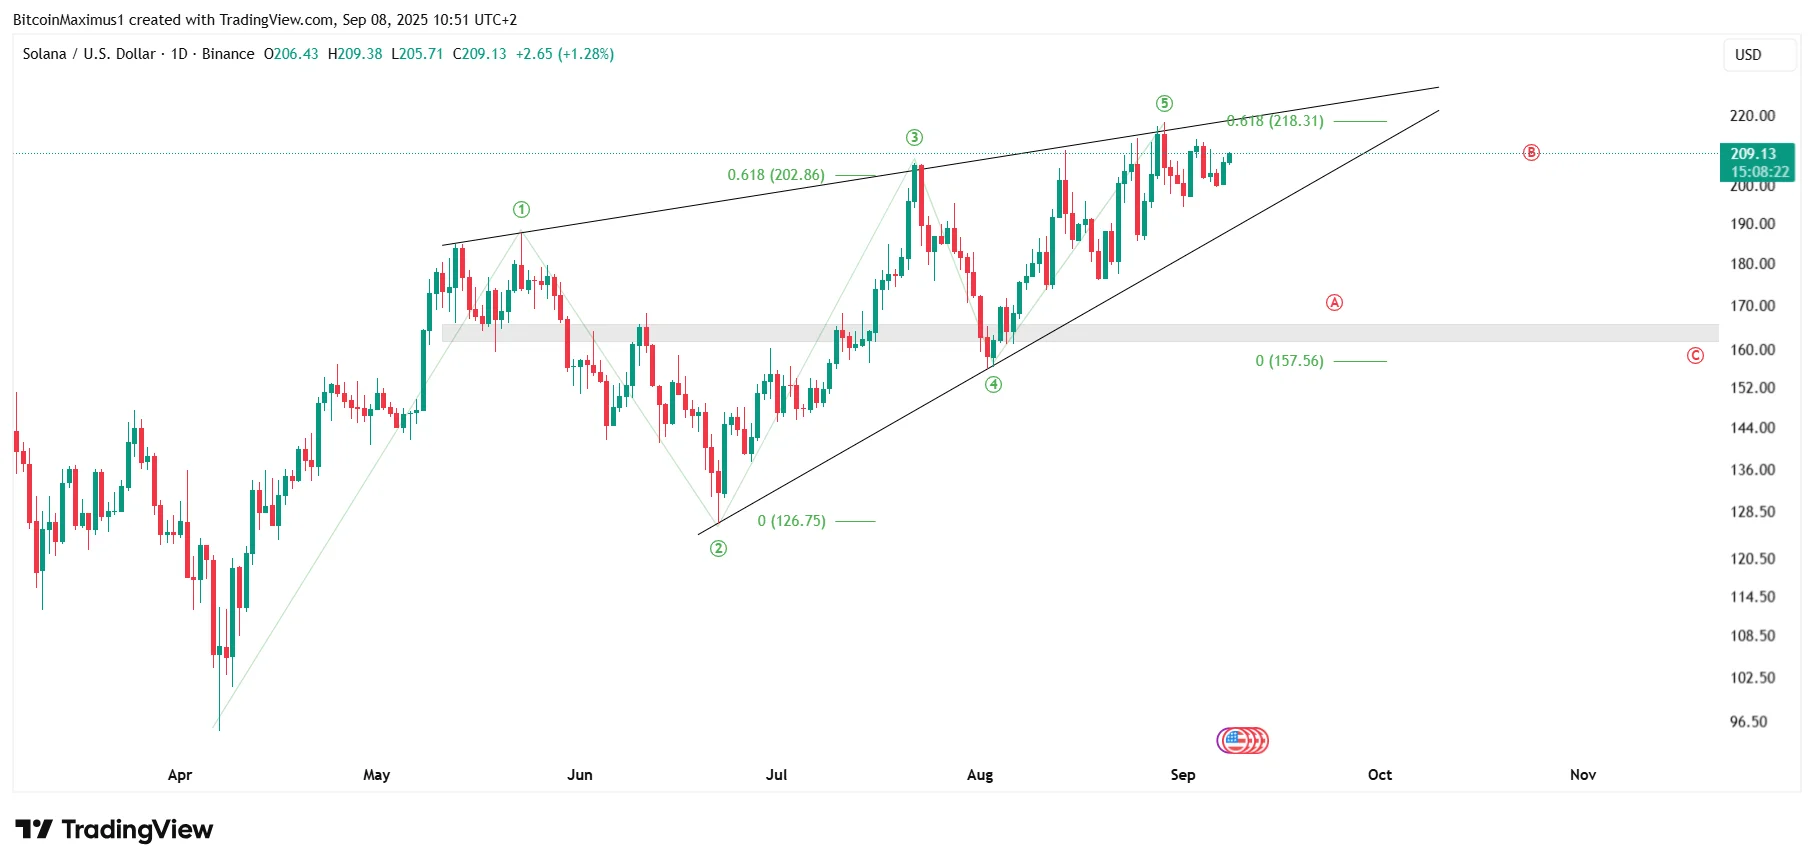
Solana’s wave count also points to a breakdown from the wedge as the most likely possibility.
According to the count, the price has completed a five-wave increase shaped as a leading diagonal.
In it, wave three was 0.618 times the length of wave one, while wave five was 0.618 times wave three.
This is the most common proportion for a diagonal, and adds to the bearish readings from the daily time frame, pointing to an impending breakdown.
The wave count allows sub-wave five to extend a little higher, possibly reaching $220, but it states that a significant correction is due soon.
If the correction transpires, the SOL price could complete an A-B-C decline toward $165 throughout September.
Final Thoughts
In conclusion, while the launch of the Solana DAT on Nasdaq initially looked bullish, market skepticism stems from concerns about inflated NAV and insider exit liquidity.
The Solana technical analysis reinforces this caution. SOL is trading inside a bearish ascending wedge and showing weakening momentum.
Unless SOL can break convincingly above $220, a corrective move toward $165 in September appears the more likely outcome.
Disclaimer:
The information provided in this article is for informational purposes only. It is not intended to be, nor should it be construed as, financial advice. We do not make any warranties regarding the completeness, reliability, or accuracy of this information. All investments involve risk, and past performance does not guarantee future results. We recommend consulting a financial advisor before making any investment decisions.
Valdrin Tahiri is a cryptocurrency analyst and reporter at CCN, specializing in technical analysis with a focus on Elliott Wave theory, on-chain metrics, and fundamental research. He brings over seven years of experience in the crypto space as both a trader and writer.
He discovered cryptocurrencies in 2017 while earning his MSc in Financial Markets at the Barcelona School of Economics, which sparked a deep interest in blockchain and market dynamics. Since then, he’s contributed to top crypto outlets like BeInCrypto and CoinGape.
Valdrin also served as Community Manager of BeInCrypto’s Telegram group for three years, helping grow it into one of the largest crypto communities worldwide. His expertise in market structure and price patterns allows him to break down complex trends into clear, actionable insights.
He’s published thousands of articles covering altcoins, Bitcoin cycles, and macro trends.