Solana’s bullish run hits a wall as momentum shifts bearish.
Share
Key Takeaways
Solana has failed to sustain momentum above $200 and has broken below the neckline at $182.89.
On-chain data shows a surge of SOL inflows into centralized exchanges, signaling selling pressure.
Indicators, including a bearish AO flip and a MACD bearish crossover, point to continued downside.
After weeks of posting higher highs, the bullish narrative around Solana (SOL) has hit a setback.
In the past 24 hours, Solana’s price has fallen by 5.41%. As a result, the altcoin has failed to extend its rally beyond the $200 psychological mark.
The rejection has left the altcoin sliding toward its last major support, with bulls scrambling to defend against deeper losses.
For now, though, the outlook doesn’t point to a swift bullish reversal. Here’s why.
Solana’s Rally Cut Short
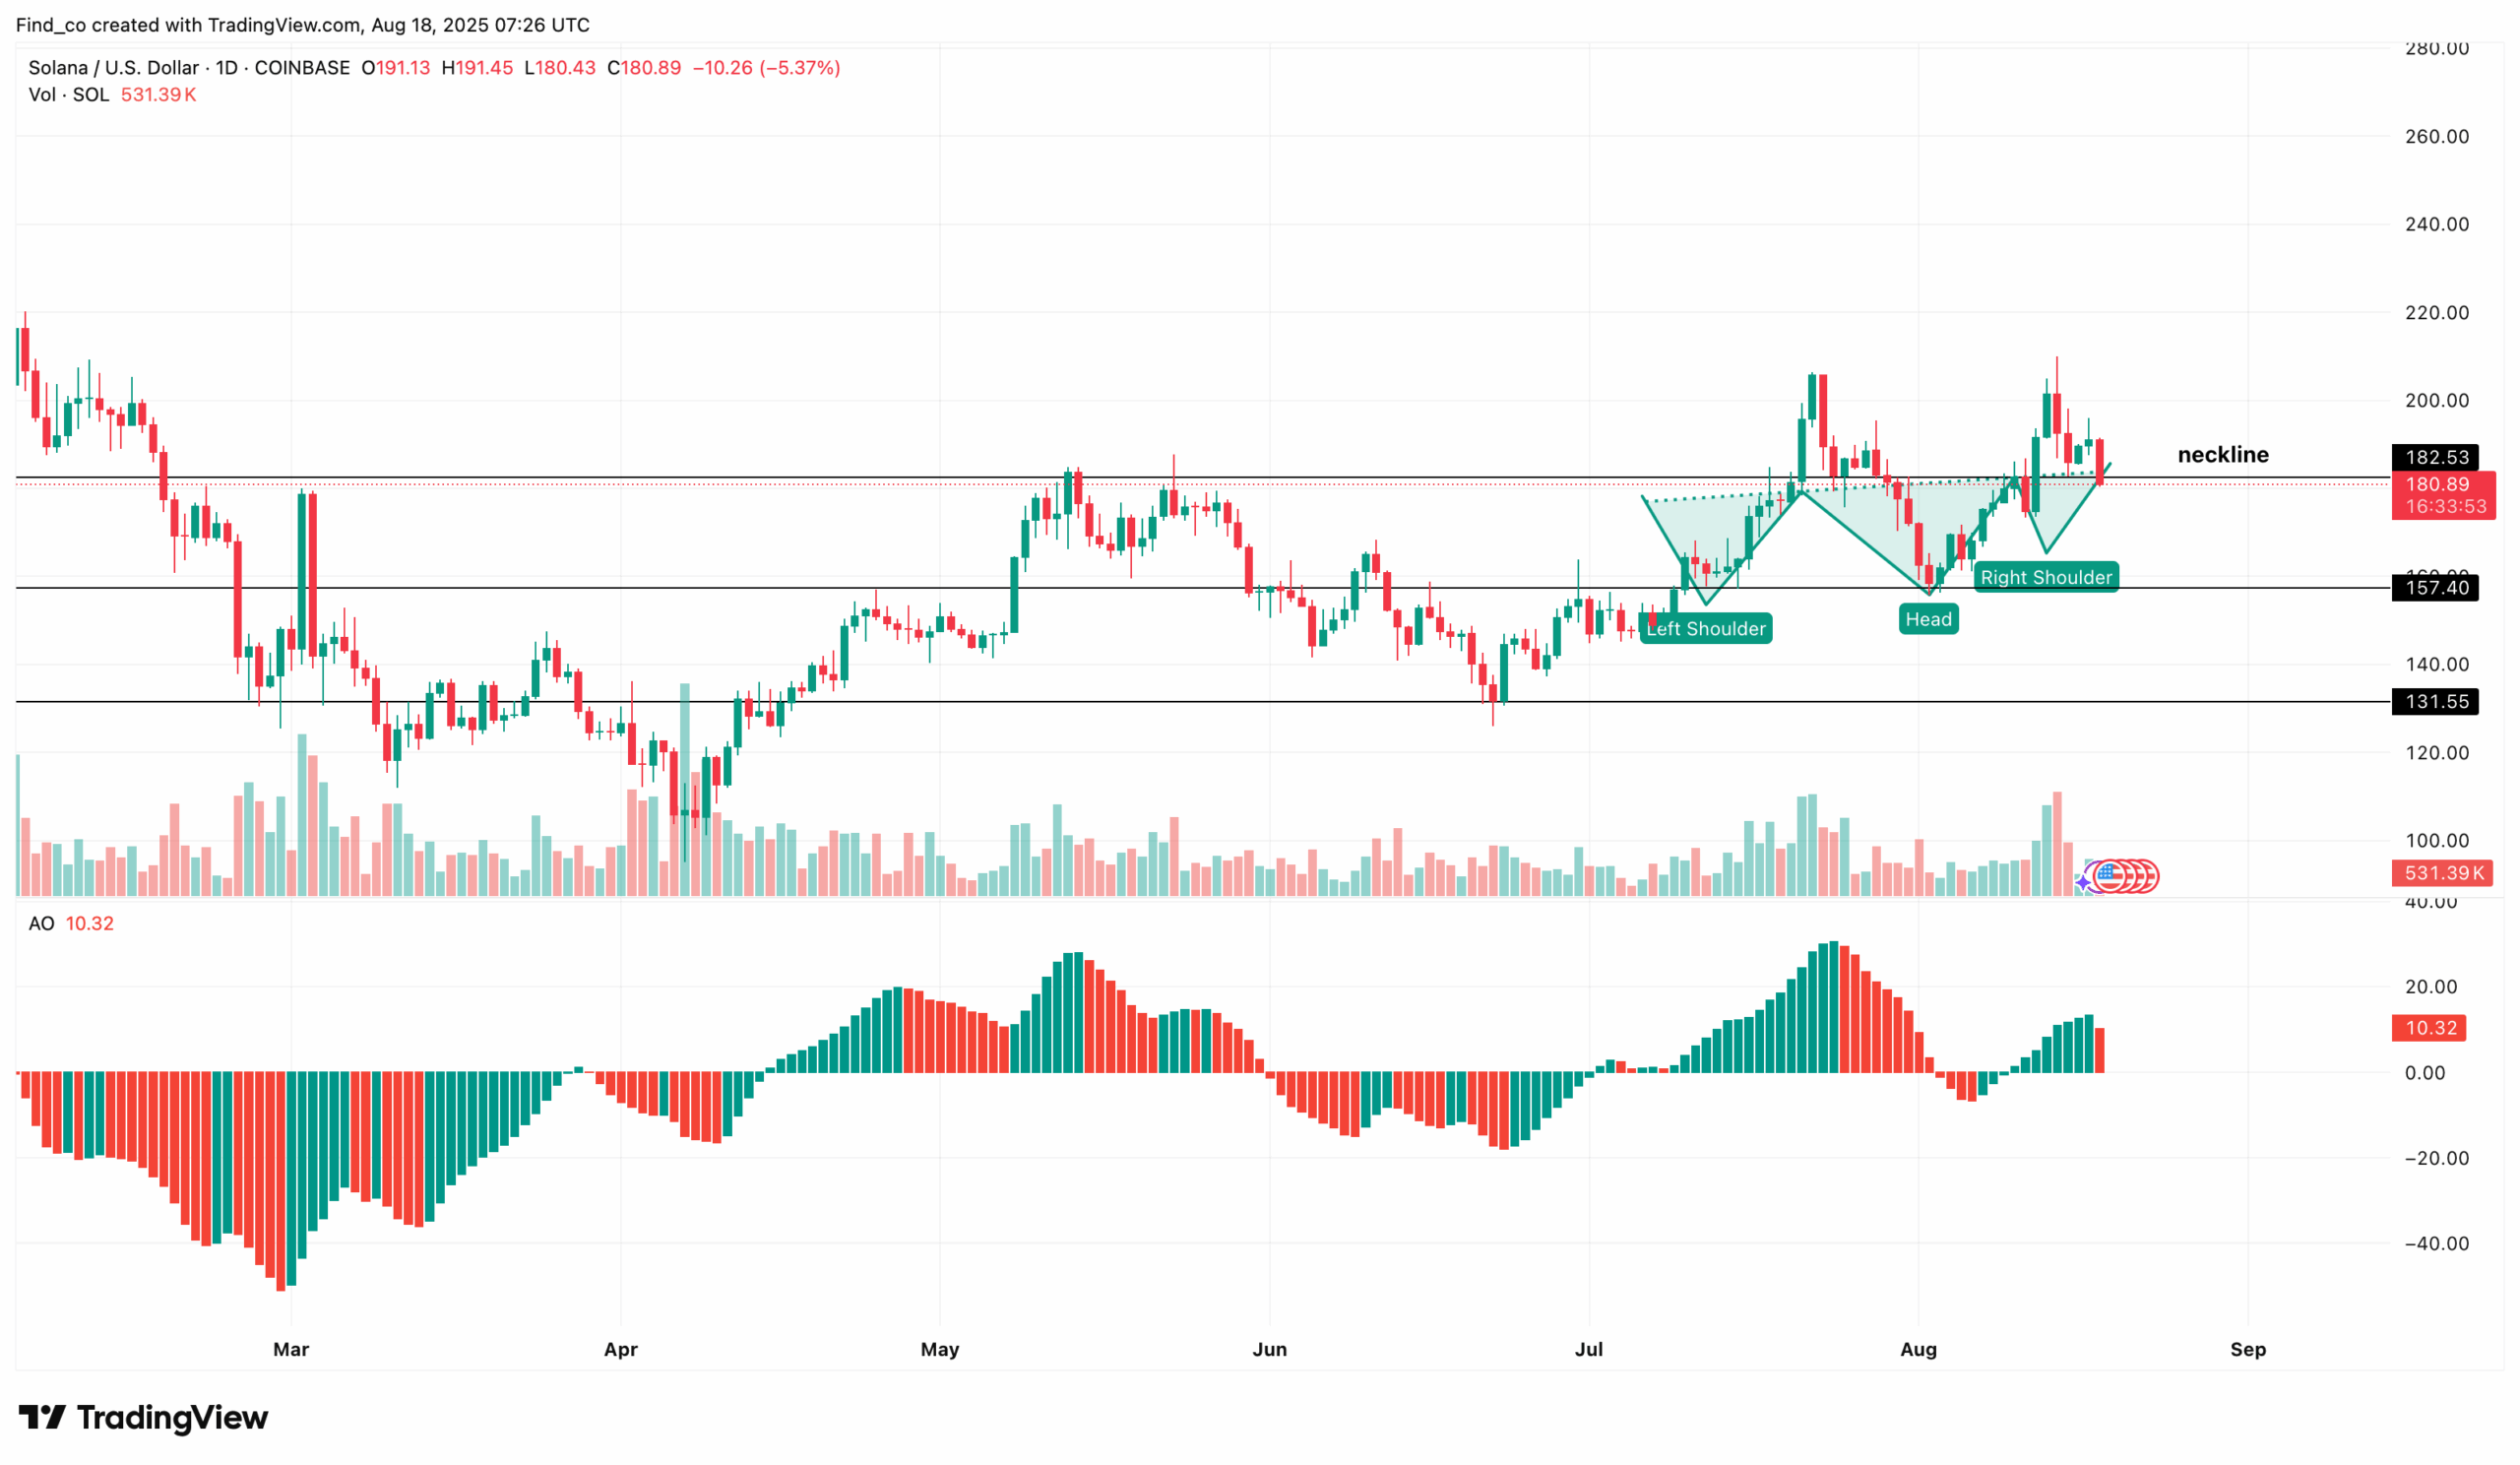
Last week, SOL bulls brushed off unfavorable macro headwinds as the price formed an inverse head-and-shoulders pattern — a bullish setup that hinted at a possible rally toward Solana’s all-time high.
But the picture has changed. Solana’s price has broken below the neckline at $182.89, a critical support level. This move has left the altcoin dangerously exposed to an extended correction.
Try Our Recommended Crypto Exchanges
Sponsored
Disclosure
We sometimes use affiliate links in our content, when clicking on those we might receive a commission at no extra cost to you. By using this website you agree to our terms and conditions and privacy policy.
The Awesome Oscillator (AO) echoes this bearish sentiment. At press time, the AO had flipped from a green histogram bar to red, indicating that market momentum is tilting away from buyers and firmly into bearish territory.
Should this technical setup remain the same, SOL risks falling below the underlying support at $157.40. A decline below this level could also drive the cryptocurrency below the $150 psychological zone, with $131.55 as a potential target.
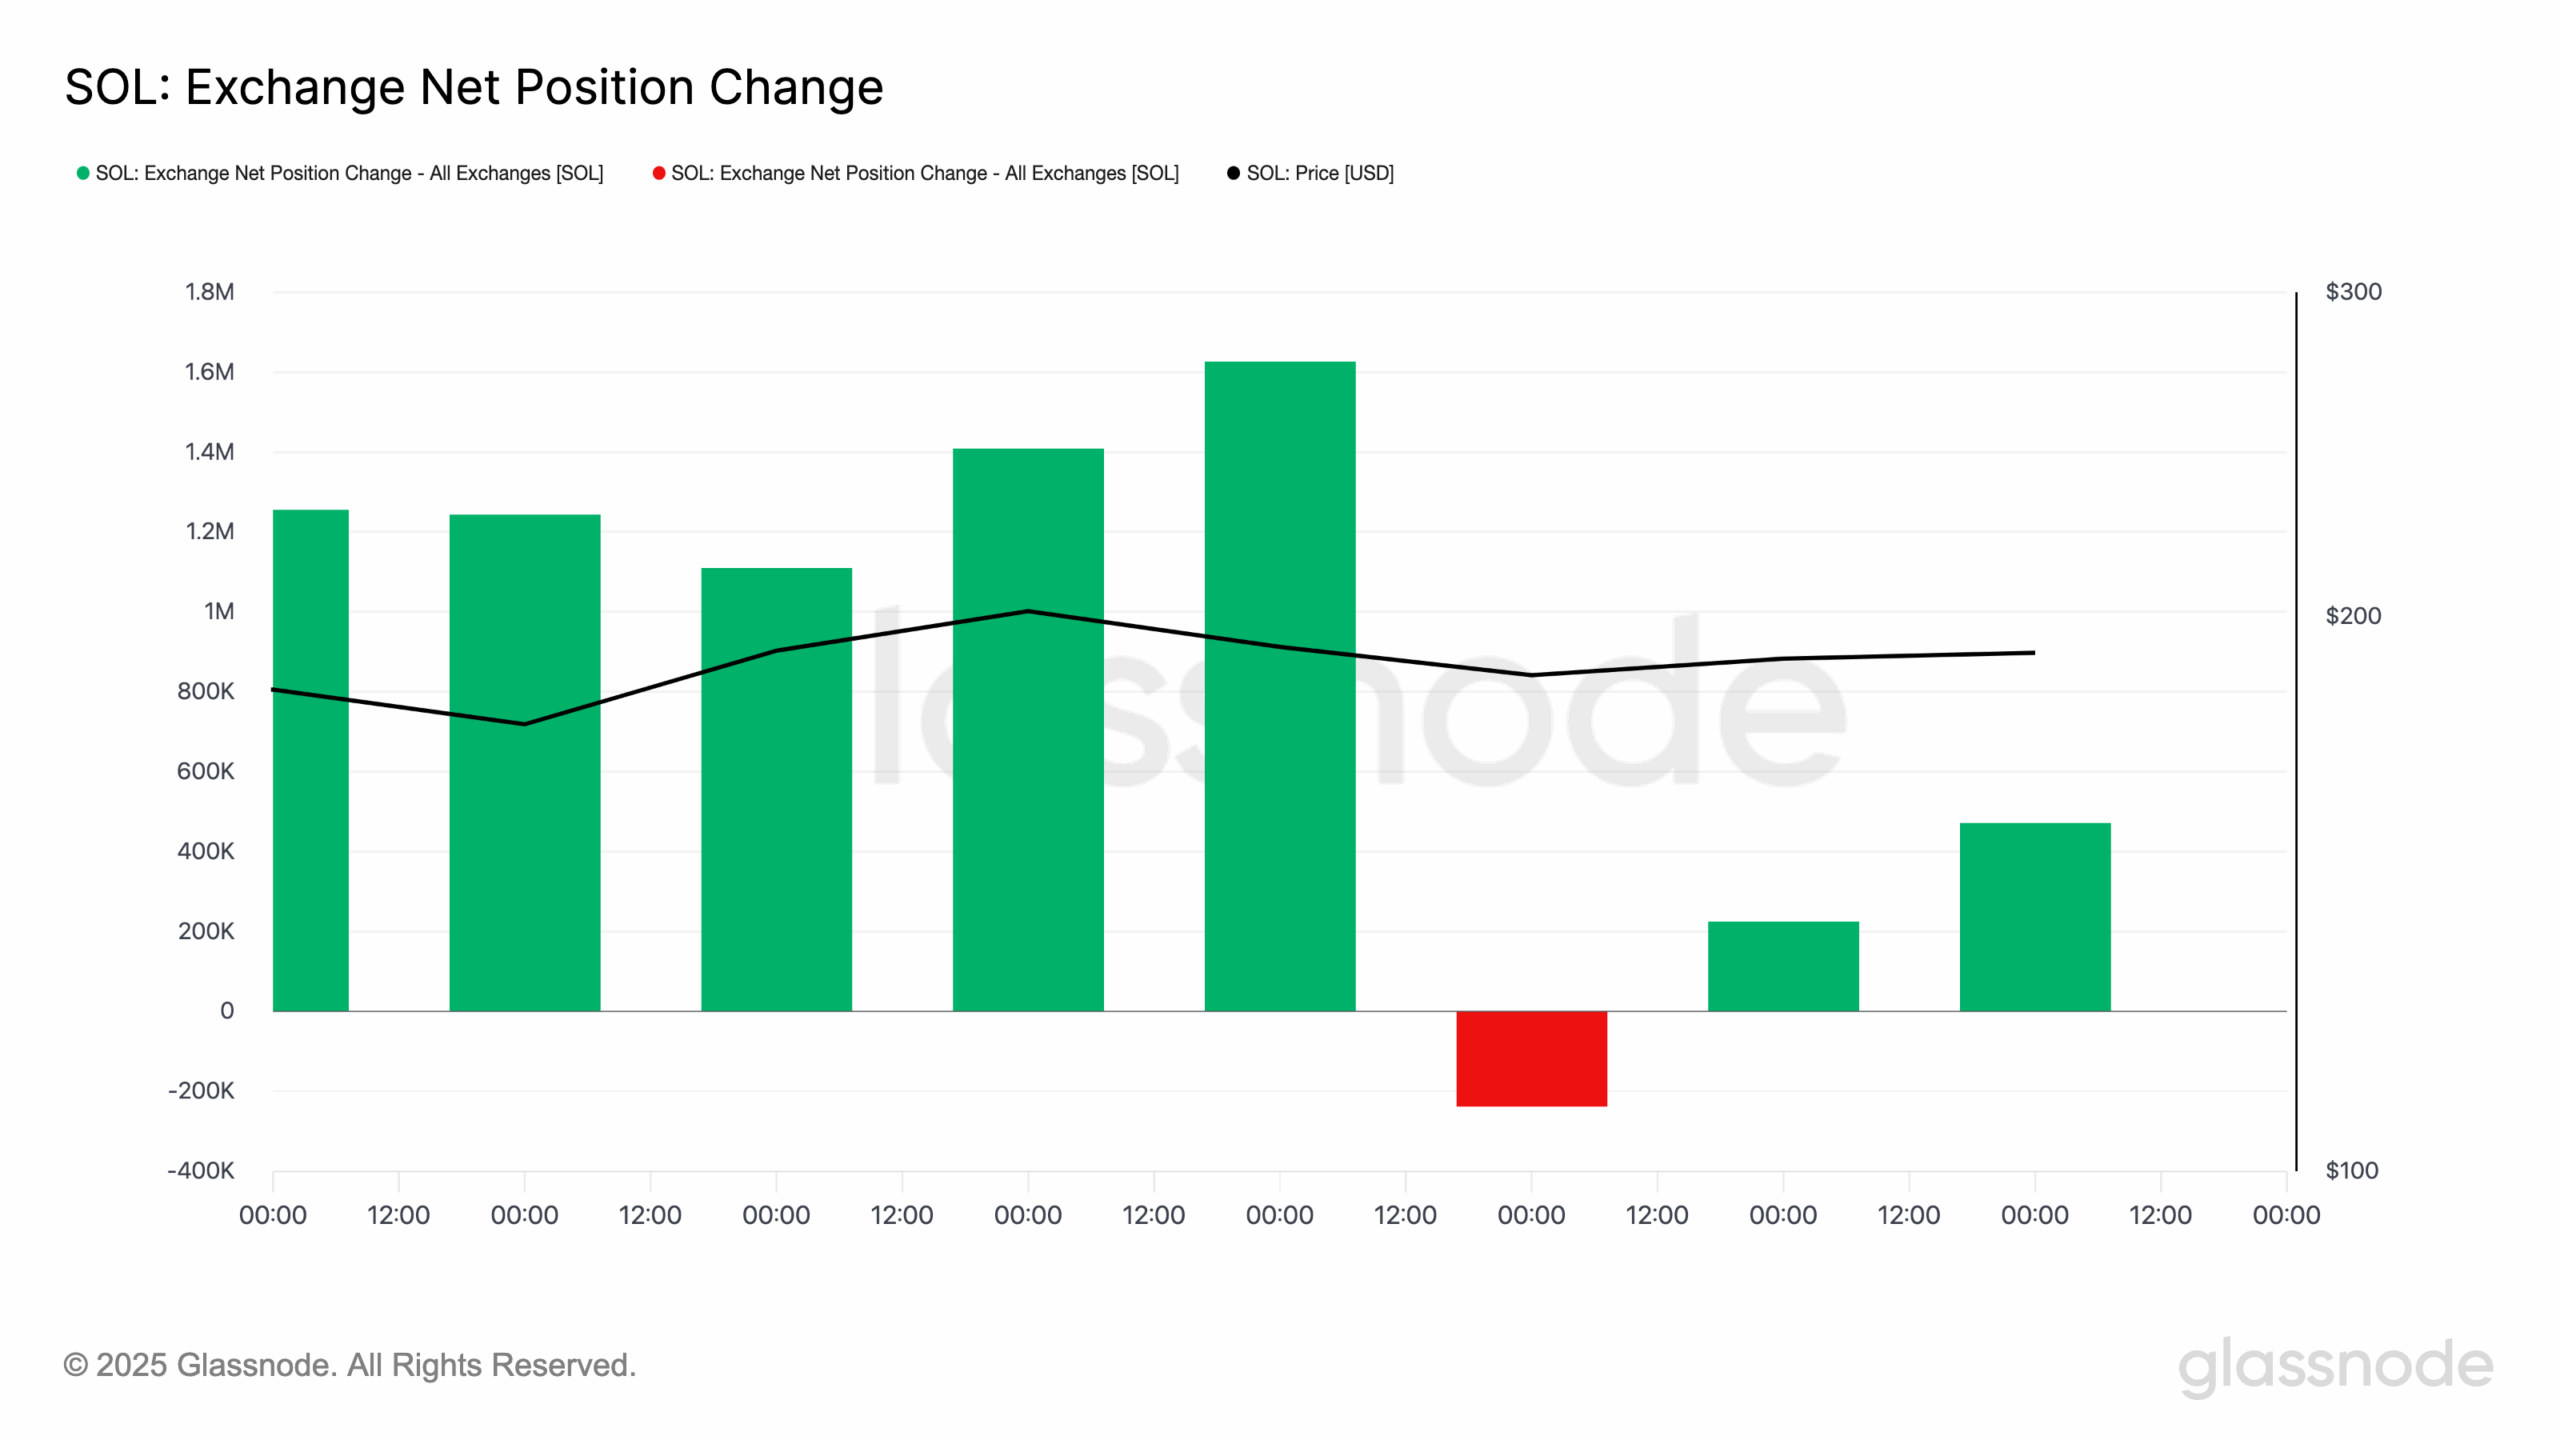
The on-chain data backs up the bearish thesis. According to Glassnode, the supply of SOL in exchange wallets spiked over the weekend.
On Friday, the exchange net position change showed 237,877 SOL leaving exchanges — typically a bullish sign as holders move coins into cold storage. But sentiment shifted quickly.
By Saturday, Aug. 16, inflows had jumped to 224,244 SOL; by Sunday, they had surged to 471,653 SOL.
Rising inflows signal that holders are preparing to sell, creating additional selling pressure in the market.
If this trend continues, Solana’s price could struggle to find strong buy-side support, increasing the likelihood of further downside as stated earlier.
SOL Exchange Net Position Change | Credit: Glassnode
SOL Price Prediction: Further Breakdown Looms
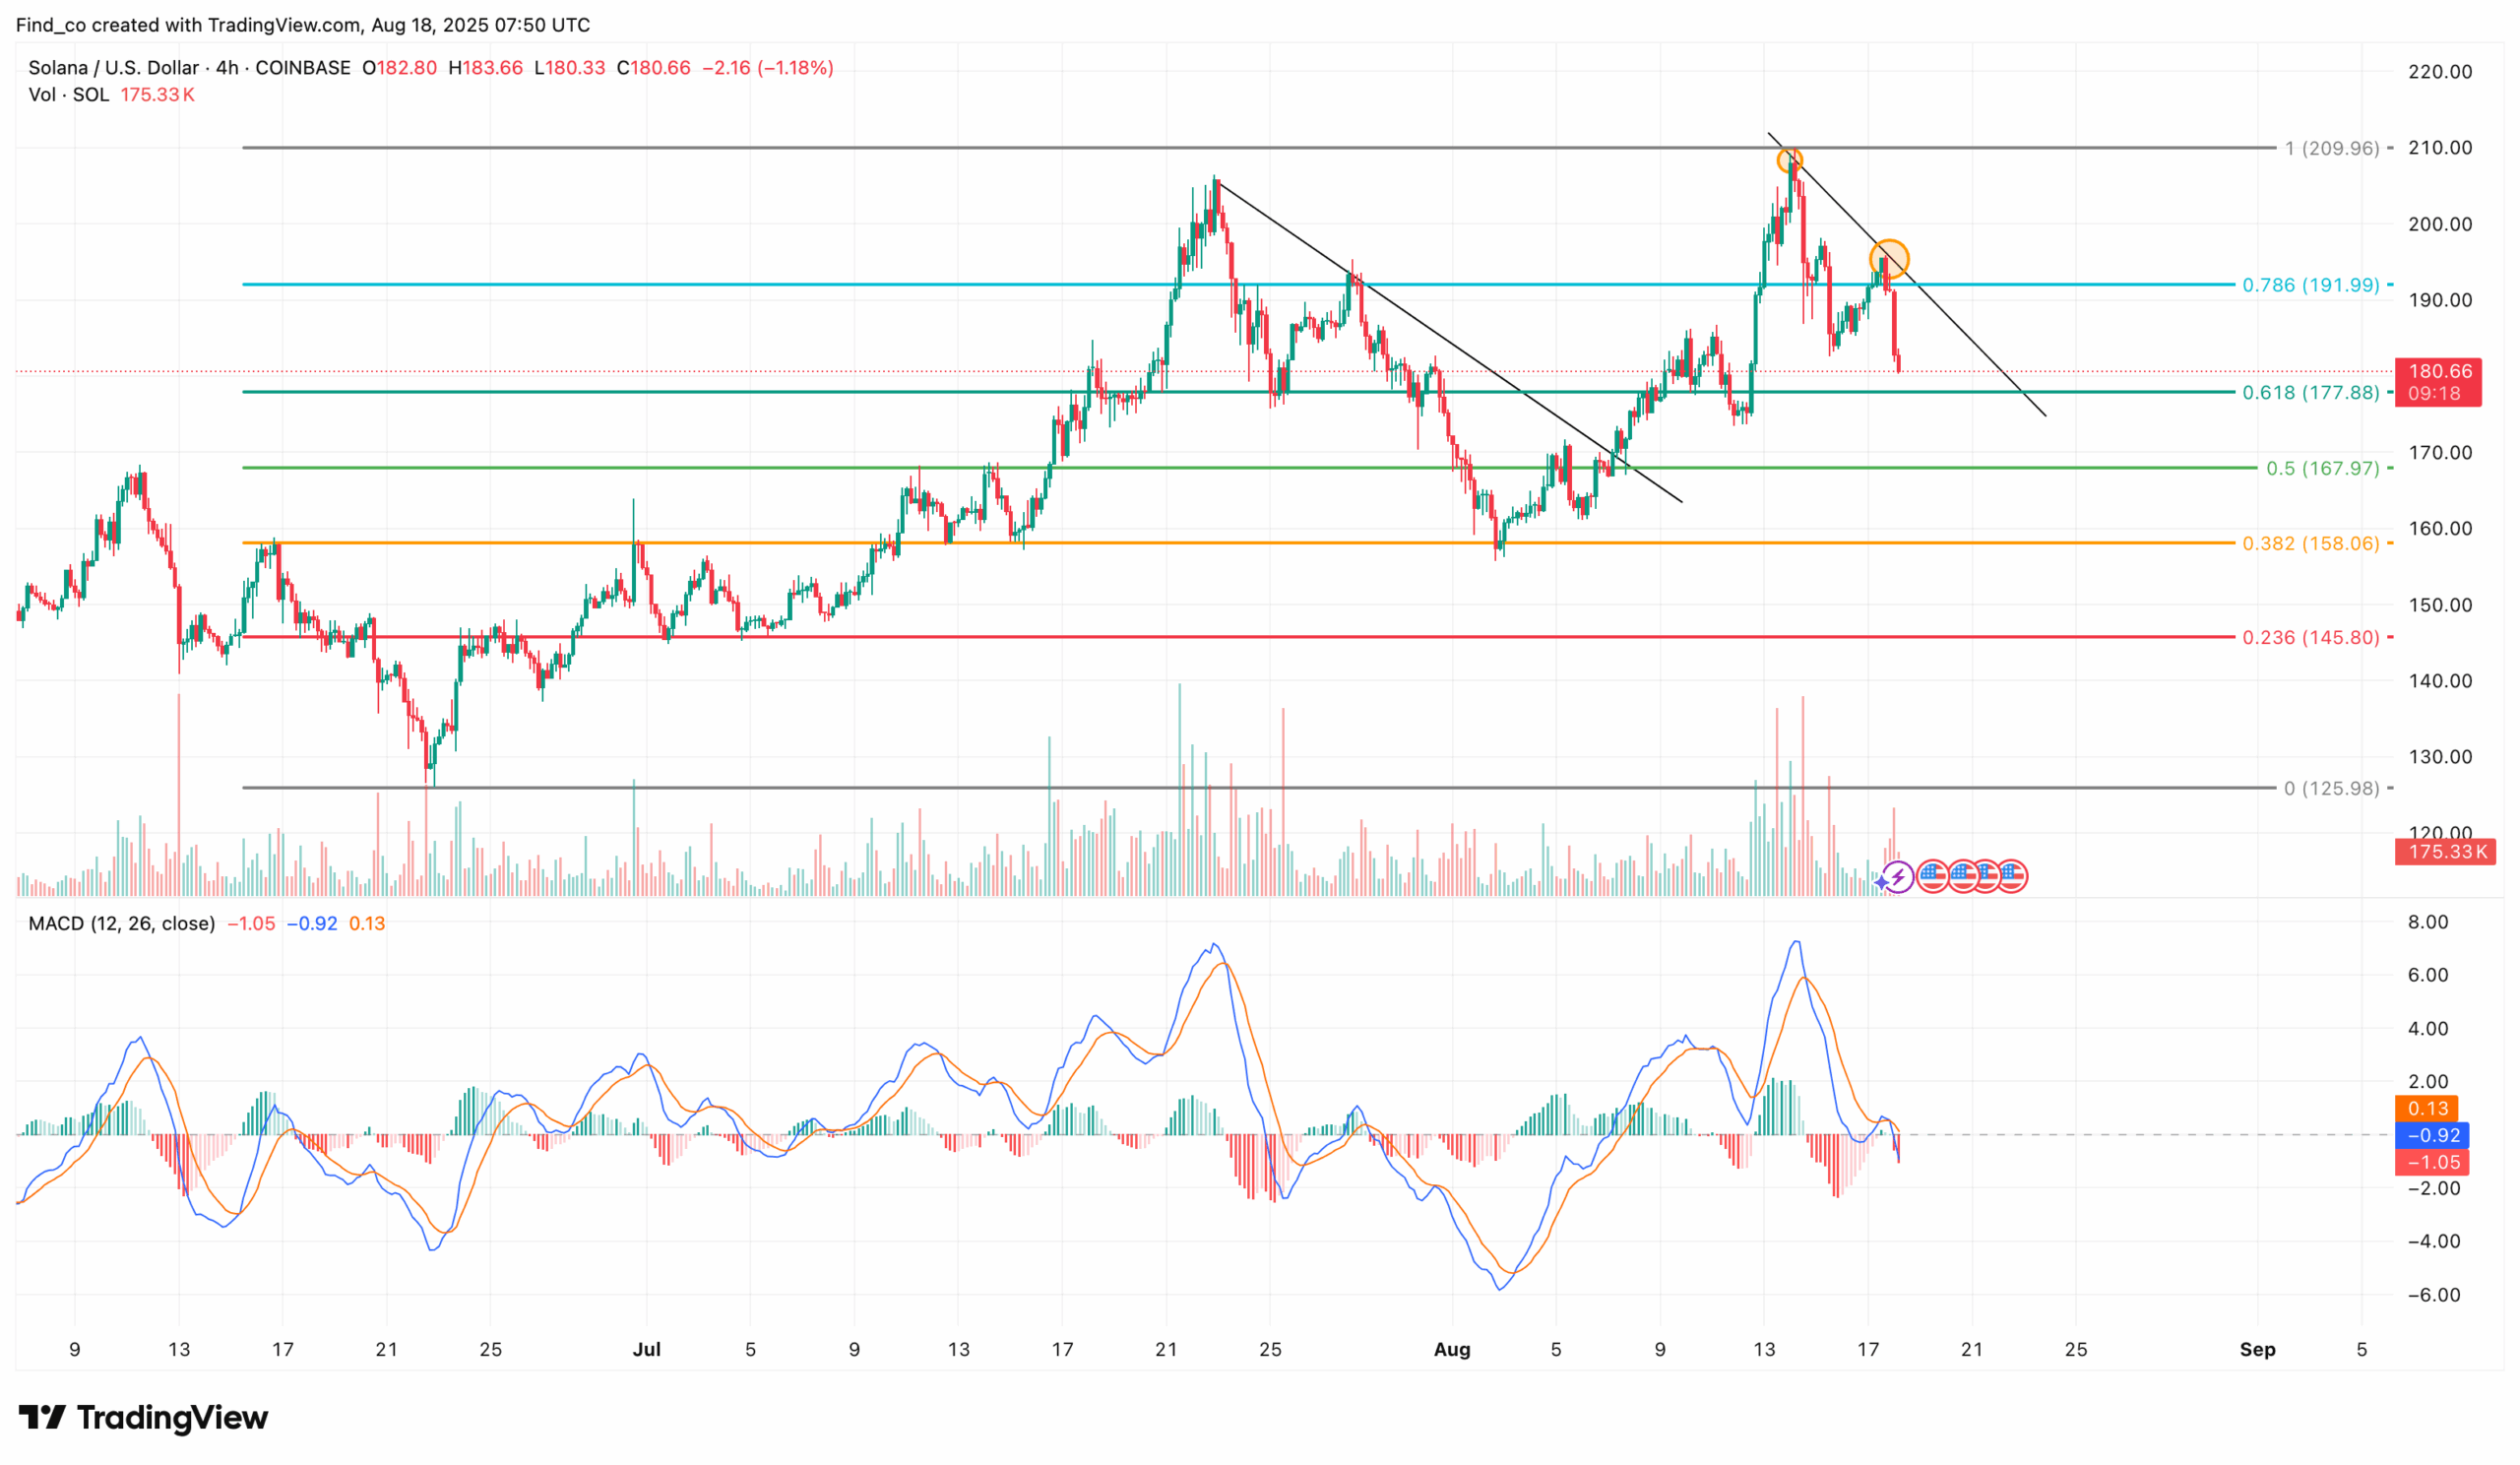
Looking at the 4-hour chart, Solana’s price seems to follow the same path that saw it fail to break $205 in July. The cryptocurrency faced several rejections during that period, eventually declining below $155.
In addition, the Moving Average Convergece Divergence (MACD) has formed a bearish crossover, suggesting that momentum is no longer positive.
Should this trend remain the same, Solana’s price might decline below the 0.382 Fibonacci level at $158.06. Once validated, that could open the door to an extended decline to $145.80.
On the other hand, if buying pressure increases, Solana’s price might break the resistance at $191.99. In such a scenario, the cryptocurrency’s market value could jump to $209.96, potentially resuming its bullish phase.
Disclaimer:
The information provided in this article is for informational purposes only. It is not intended to be, nor should it be construed as, financial advice. We do not make any warranties regarding the completeness, reliability, or accuracy of this information. All investments involve risk, and past performance does not guarantee future results. We recommend consulting a financial advisor before making any investment decisions.
Victor Olanrewaju is a crypto analyst and reporter at CCN with deep roots in on-chain research and technical analysis. His crypto journey began in 2017, but it was the 2020 Uniswap airdrop that sparked a full-time pivot into the space.
With a foundation in copywriting, Victor honed his craft creating high-converting content for leading crypto brokers — most notably an XRP price prediction that ranked #1 on Google during the 2021 bull run.
He later joined AMBCrypto in 2022, where he combined storytelling with technical and on-chain analysis to cover key market narratives.
In 2024, he expanded his expertise at BeInCrypto, collaborating with analysts and using tools like Glassnode, Santiment, and IntoTheBlock to break down Bitcoin and altcoin trends.
At CCN, Victor covers the top cryptocurrencies, memecoins, macro shifts, blending real-time insights with deep-dive metrics.
He holds a Bachelor’s degree in Physics from the University of Ibadan, equipping him to simplify complex data for a wide audience. Follow his work or connect on LinkedIn or X.