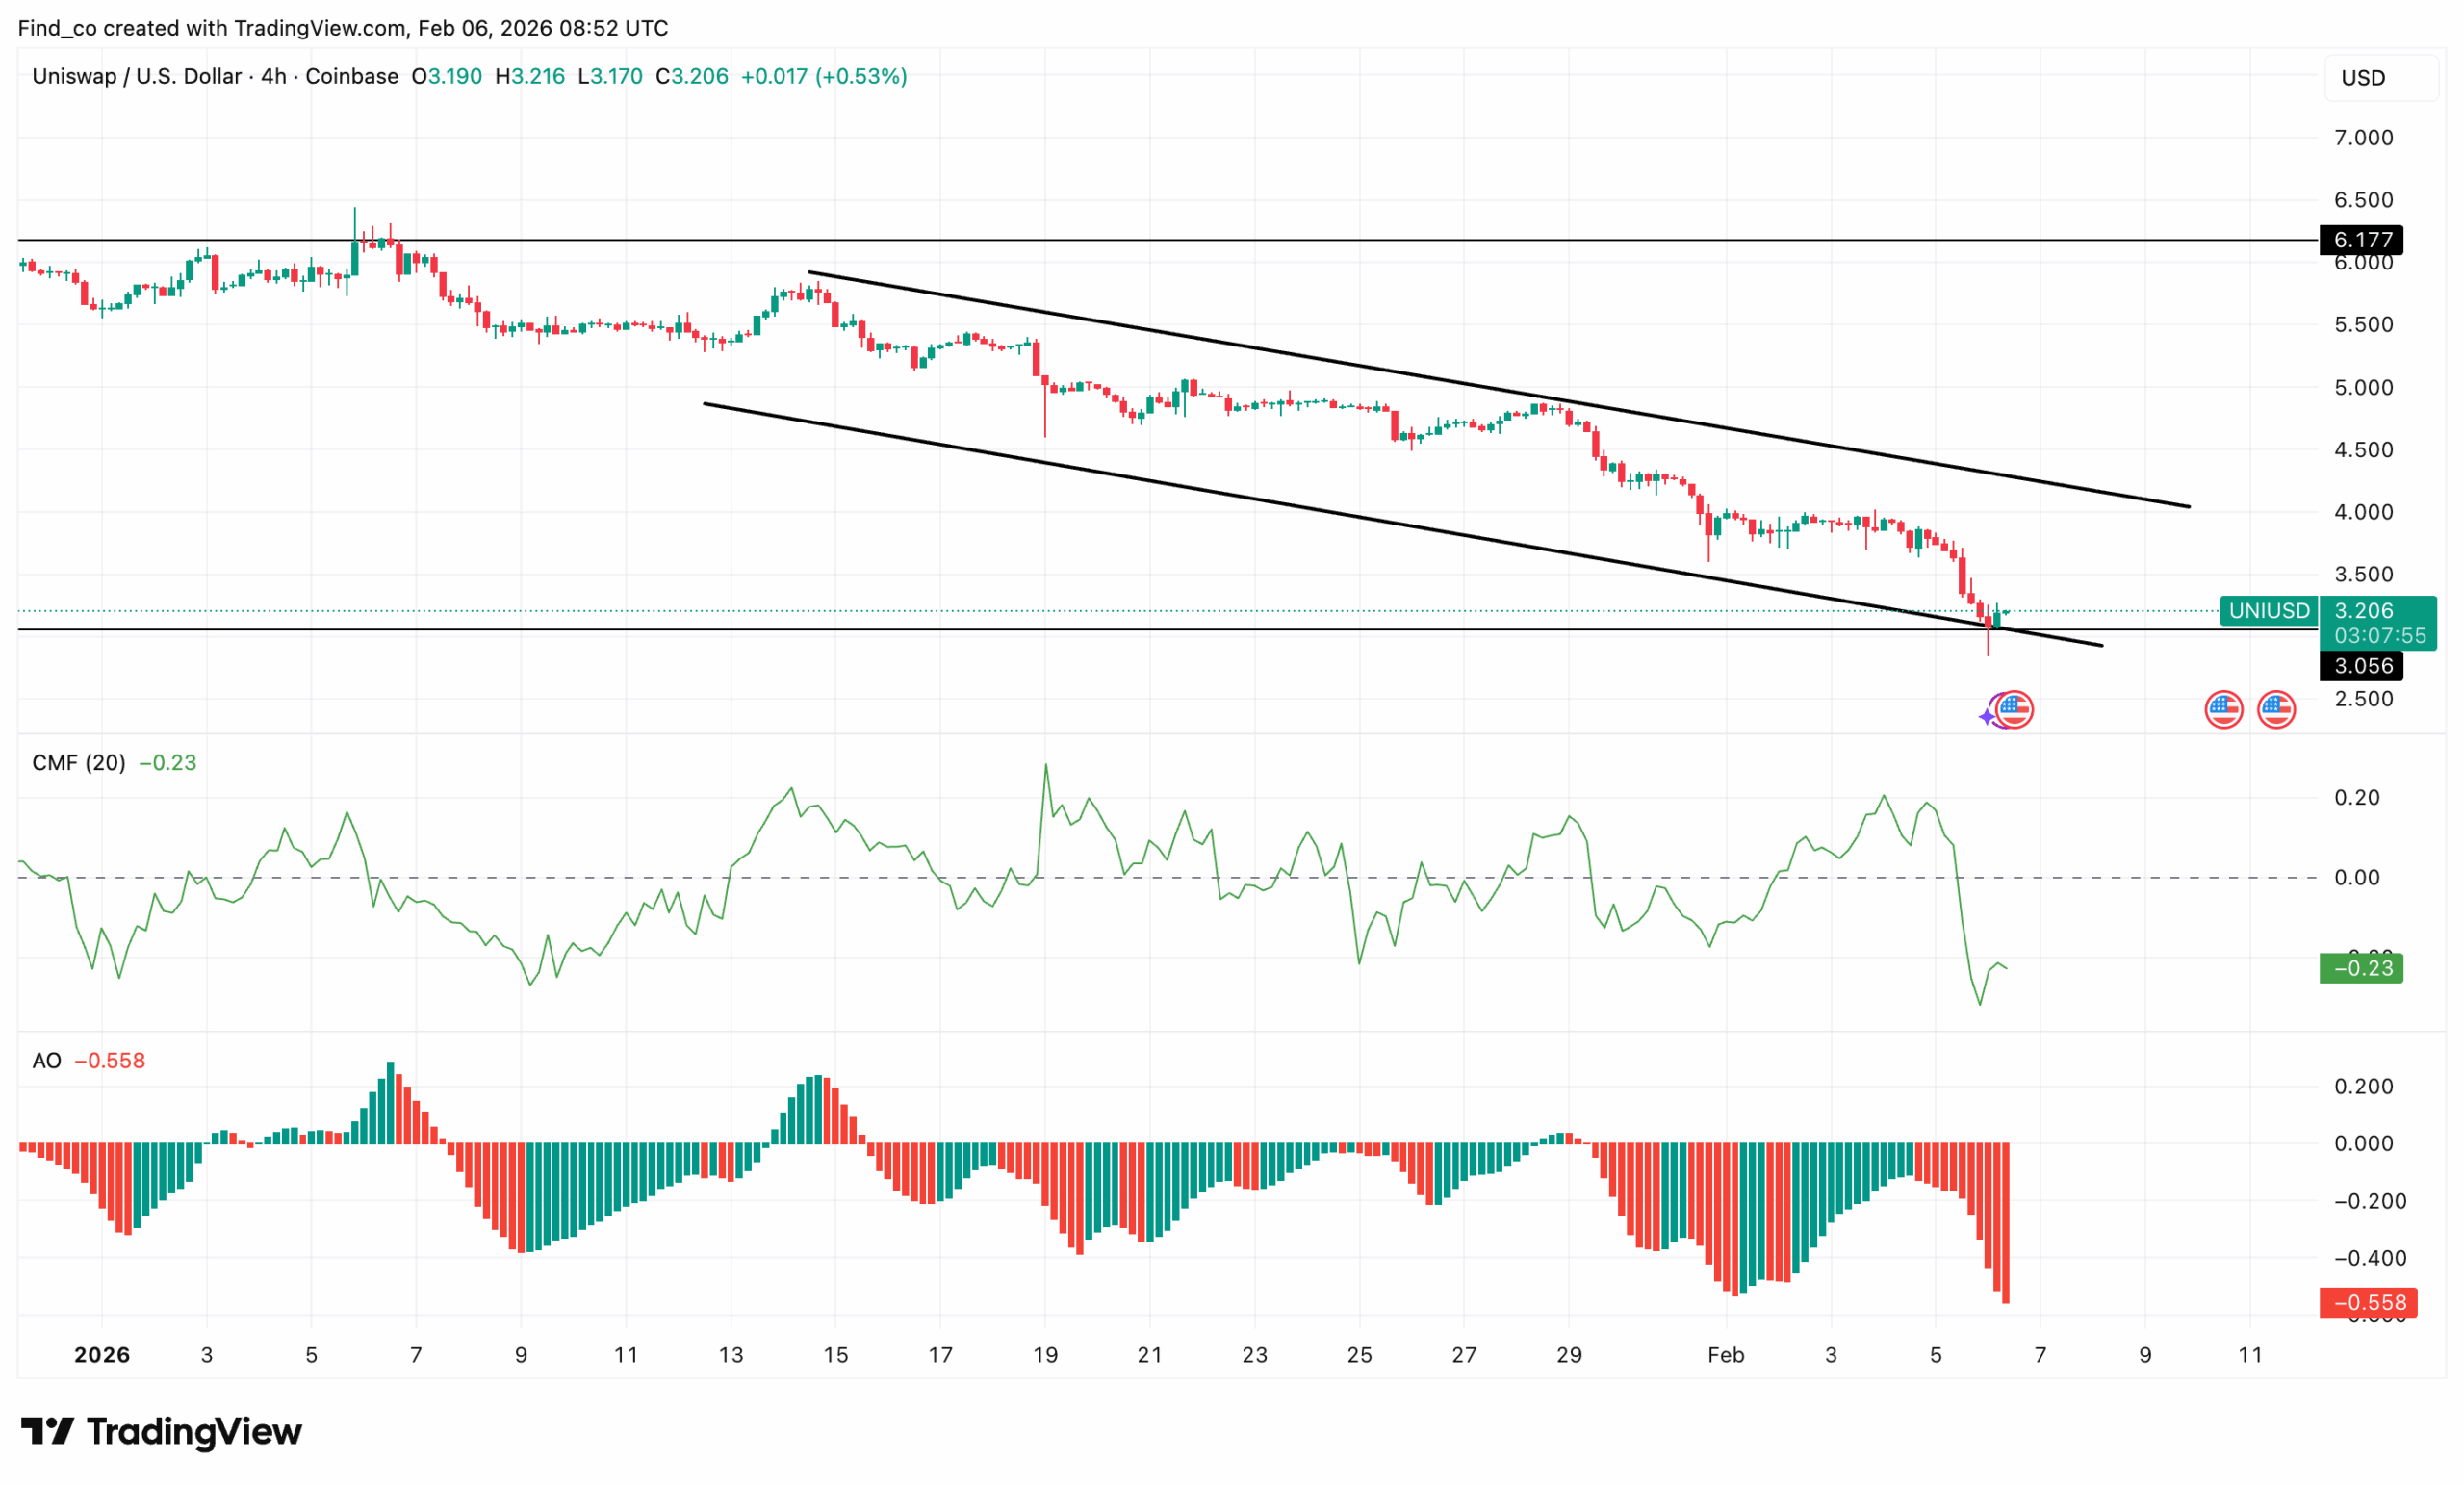
Furthermore, the Chaikin Money Flow (CMF) reflects weakening participation, signaling sustained capital outflows.
At press time, CMF remains in negative territory at -0.21, highlighting persistent distribution rather than accumulation.
Against a broader market downturn, a development such as Bitwise’s ETF filing would typically stabilize sentiment.
However, UNI’s failure to attract an immediate bid-side response suggests that macro headwinds and internal weakness are overpowering the headline catalyst.
Momentum indicators reinforce this bearish structure. The Awesome Oscillator (AO) stays deeply below the zero line, printing consecutive red histogram bars and reading -0.514, signaling accelerating selling pressure.
Price action shows UNI’s price respecting a clear descending pattern, with each relief bounce capped by former support that has turned into resistance.
Sellers continue to defend overhead zones aggressively, preventing any meaningful reclaim of broken levels. Should this remain the same, Uniswap’s price risks a notable drop below $2.
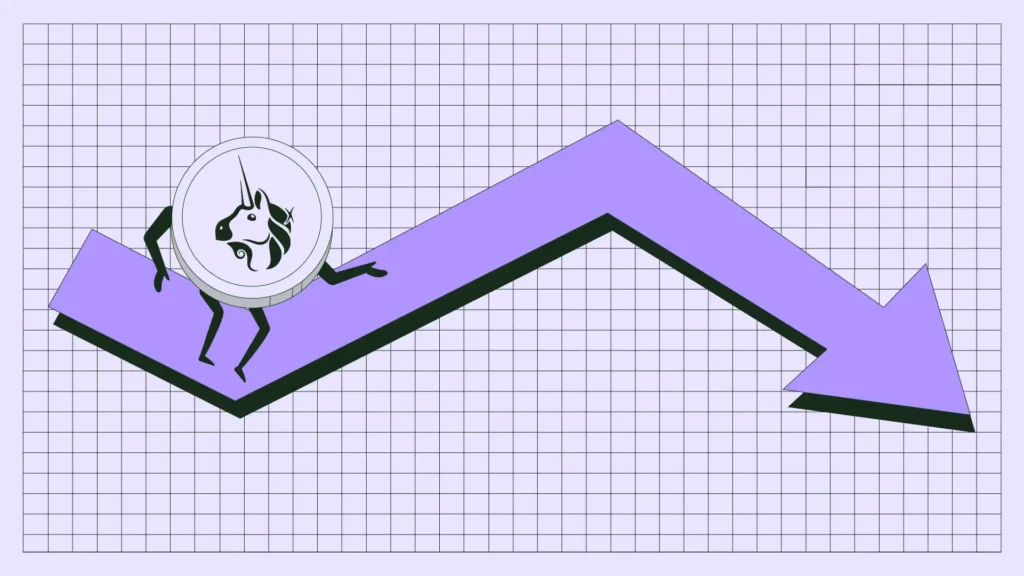
UNI Price Prediction: Downtrend Continues
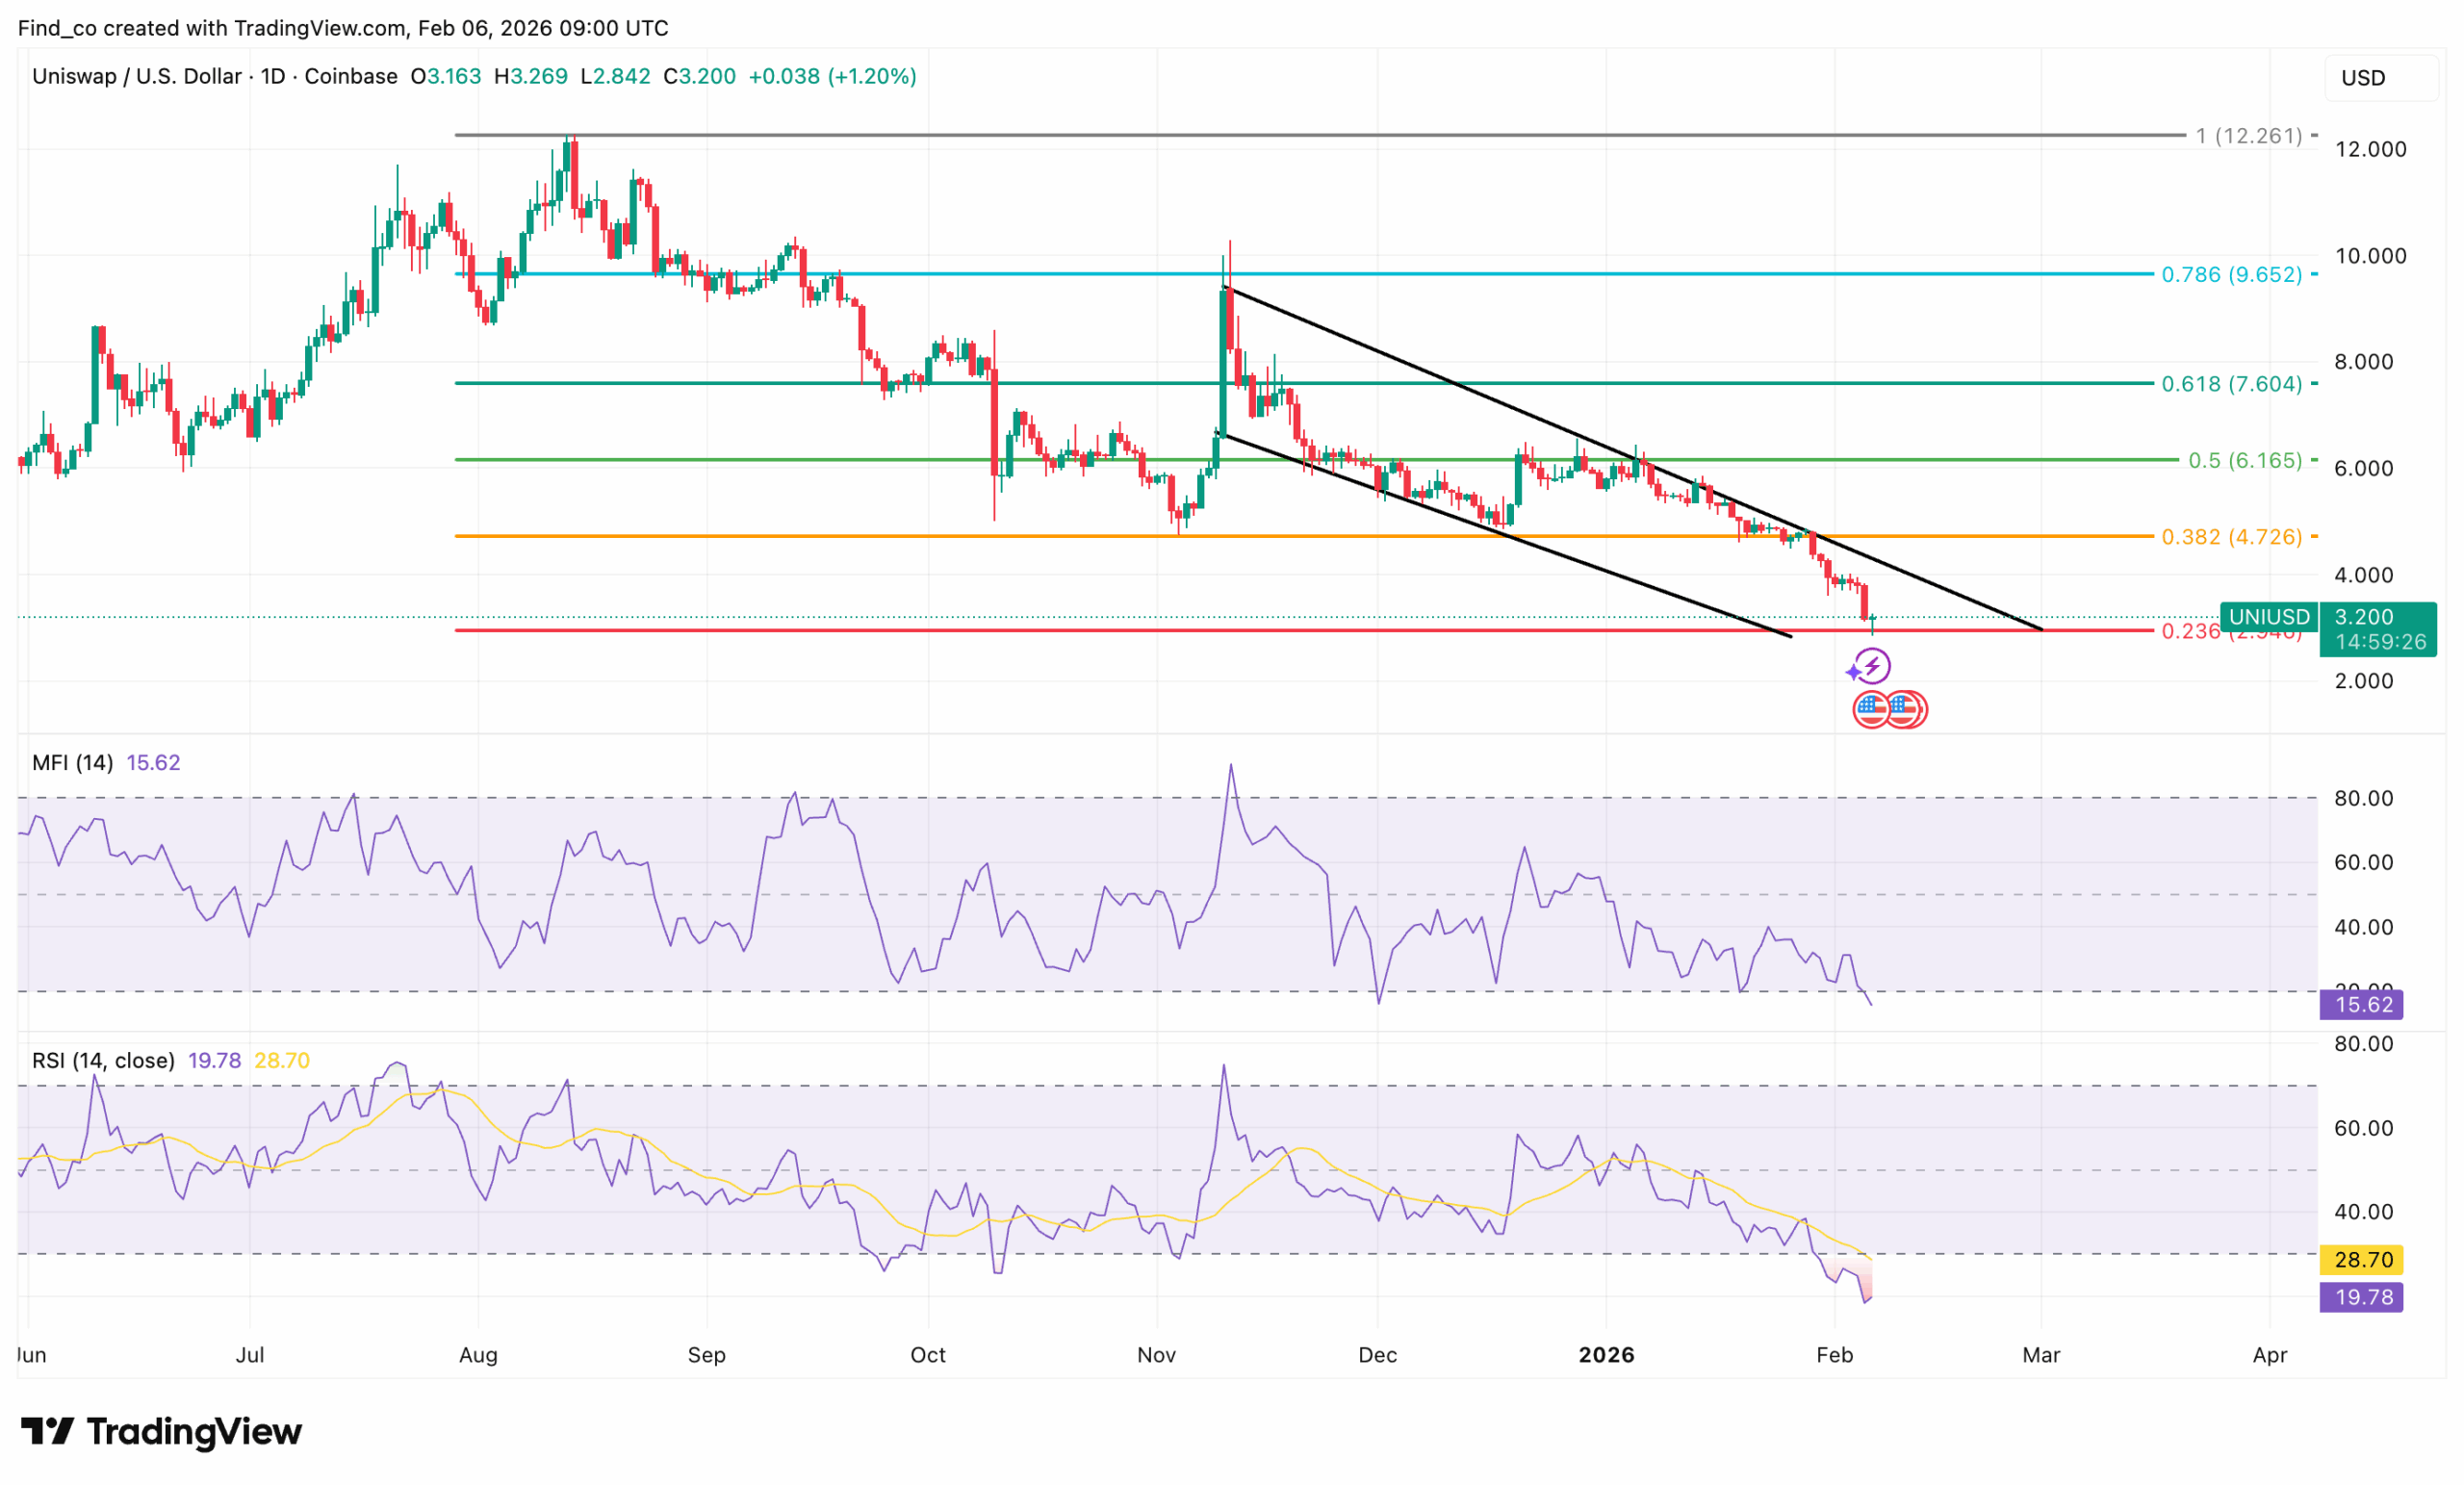
The daily chart offers little encouragement. UNI continues to record consecutive declines, showing that bearish momentum remains firmly in control despite Bitwise’s move to list a spot Uniswap ETF.
This is evident in the Relative Strength Index (RSI), which sits firmly in the oversold region, reflecting sustained selling pressure rather than a temporary shakeout.
An oversold RSI can hint at a bounce, but context matters. In UNI’s case, momentum has yet to flatten, let alone turn, suggesting that bears are still dictating the pace.
Similarly, the Money Flow Index (MFI) shows no meaningful improvement, remaining subdued and indicating that capital inflows remain weak.
This reinforces the view that the sell-off is not driven solely by price action, but by a lack of conviction among buyers at current levels.
Fibonacci retracement levels further underline UNI’s fragile setup. UNI’s price continues to trade well below key retracement zones, with former support levels now acting as overhead resistance.
At the time of writing, UNI’s price sits at $3.21, struggling to break away from the 0 Fib level.
While the candle has turned green, the move lacks follow-through and volume confirmation, raising questions about its durability.
Without a push above nearby resistance at $3.95, the recovery risks fading as quickly as it appeared.
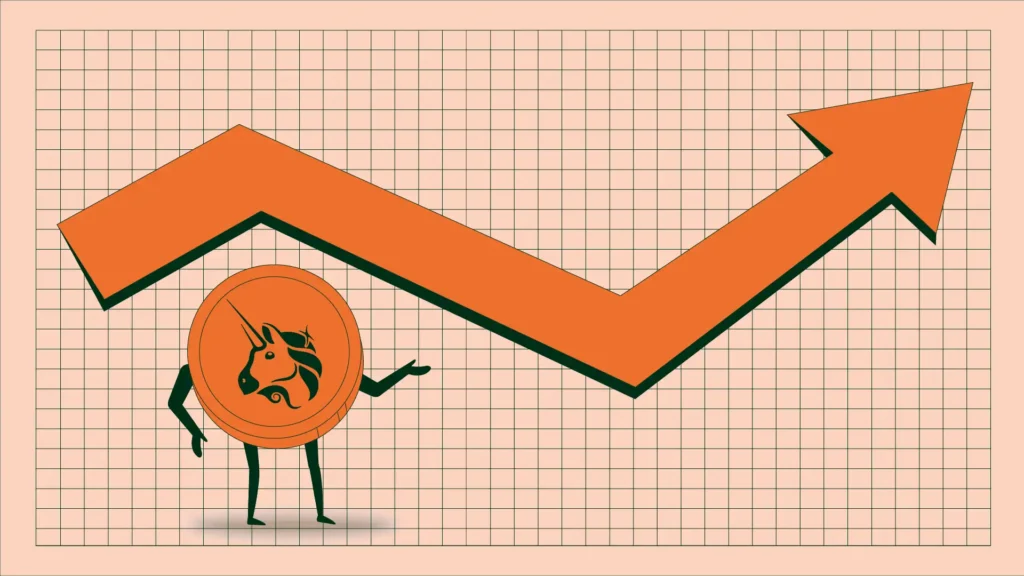
In a bullish scenario, if UNI manages to reclaim the $3.95 to $5.10 resistance with a strong daily close and accompanying volume, it could open the door for a move toward the next Fibonacci retracement levels.
Disclaimer:
The information provided in this article is for informational purposes only. It is not intended to be, nor should it be construed as, financial advice. We do not make any warranties regarding the completeness, reliability, or accuracy of this information. All investments involve risk, and past performance does not guarantee future results. We recommend consulting a financial advisor before making any investment decisions.
Victor Olanrewaju is a crypto analyst and reporter at CCN with deep roots in on-chain research and technical analysis. His crypto journey began in 2017, but it was the 2020 Uniswap airdrop that sparked a full-time pivot into the space.
With a foundation in copywriting, Victor honed his craft creating high-converting content for leading crypto brokers — most notably an XRP price prediction that ranked #1 on Google during the 2021 bull run.
He later joined AMBCrypto in 2022, where he combined storytelling with technical and on-chain analysis to cover key market narratives.
In 2024, he expanded his expertise at BeInCrypto, collaborating with analysts and using tools like Glassnode, Santiment, and IntoTheBlock to break down Bitcoin and altcoin trends.
At CCN, Victor covers the top cryptocurrencies, memecoins, macro shifts, blending real-time insights with deep-dive metrics.
He holds a Bachelor’s degree in Physics from the University of Ibadan, equipping him to simplify complex data for a wide audience. Follow his work or connect on LinkedIn or X.