Home / Analysis / Crypto / Technical Analysis / Monero (XMR) Price Smashes All-Time High After 40% Spike — Legendary Trader Expects a ‘Silver-Like’ Run
Monero hits a new all-time high, but Peter Brandt says the rally isn't over | Credit: Hameem Sarwar
Share
Key Takeaways
Monero reached a new all-time high of over $596 as bullish momentum intensified.
Veteran trader Peter Brandt disclosed that XMR’s price could follow Silver’s pattern.
If momentum holds, XMR could extend toward $650, with pullbacks likely around $515.
Monero (XMR) price didn’t knock. Instead, it broke through the resistance door as it spiked to a new all-time high earlier today.
This development occurred after XMR’s price rallied by 40% over the past 30 days, amid bullish sentiment surrounding privacy coins.
Interestingly, Zcash (ZEC), the second-largest cryptocurrency by market cap, has recovered from its previous decline. At the time of writing, the cryptocurrency is up 7.38% over the past 24 hours.
Following the move, new predictions suggest that XMR’s price could trade higher in the short term.
But how high can the coin go? Let’s find out
Monero Blasts to New Record High
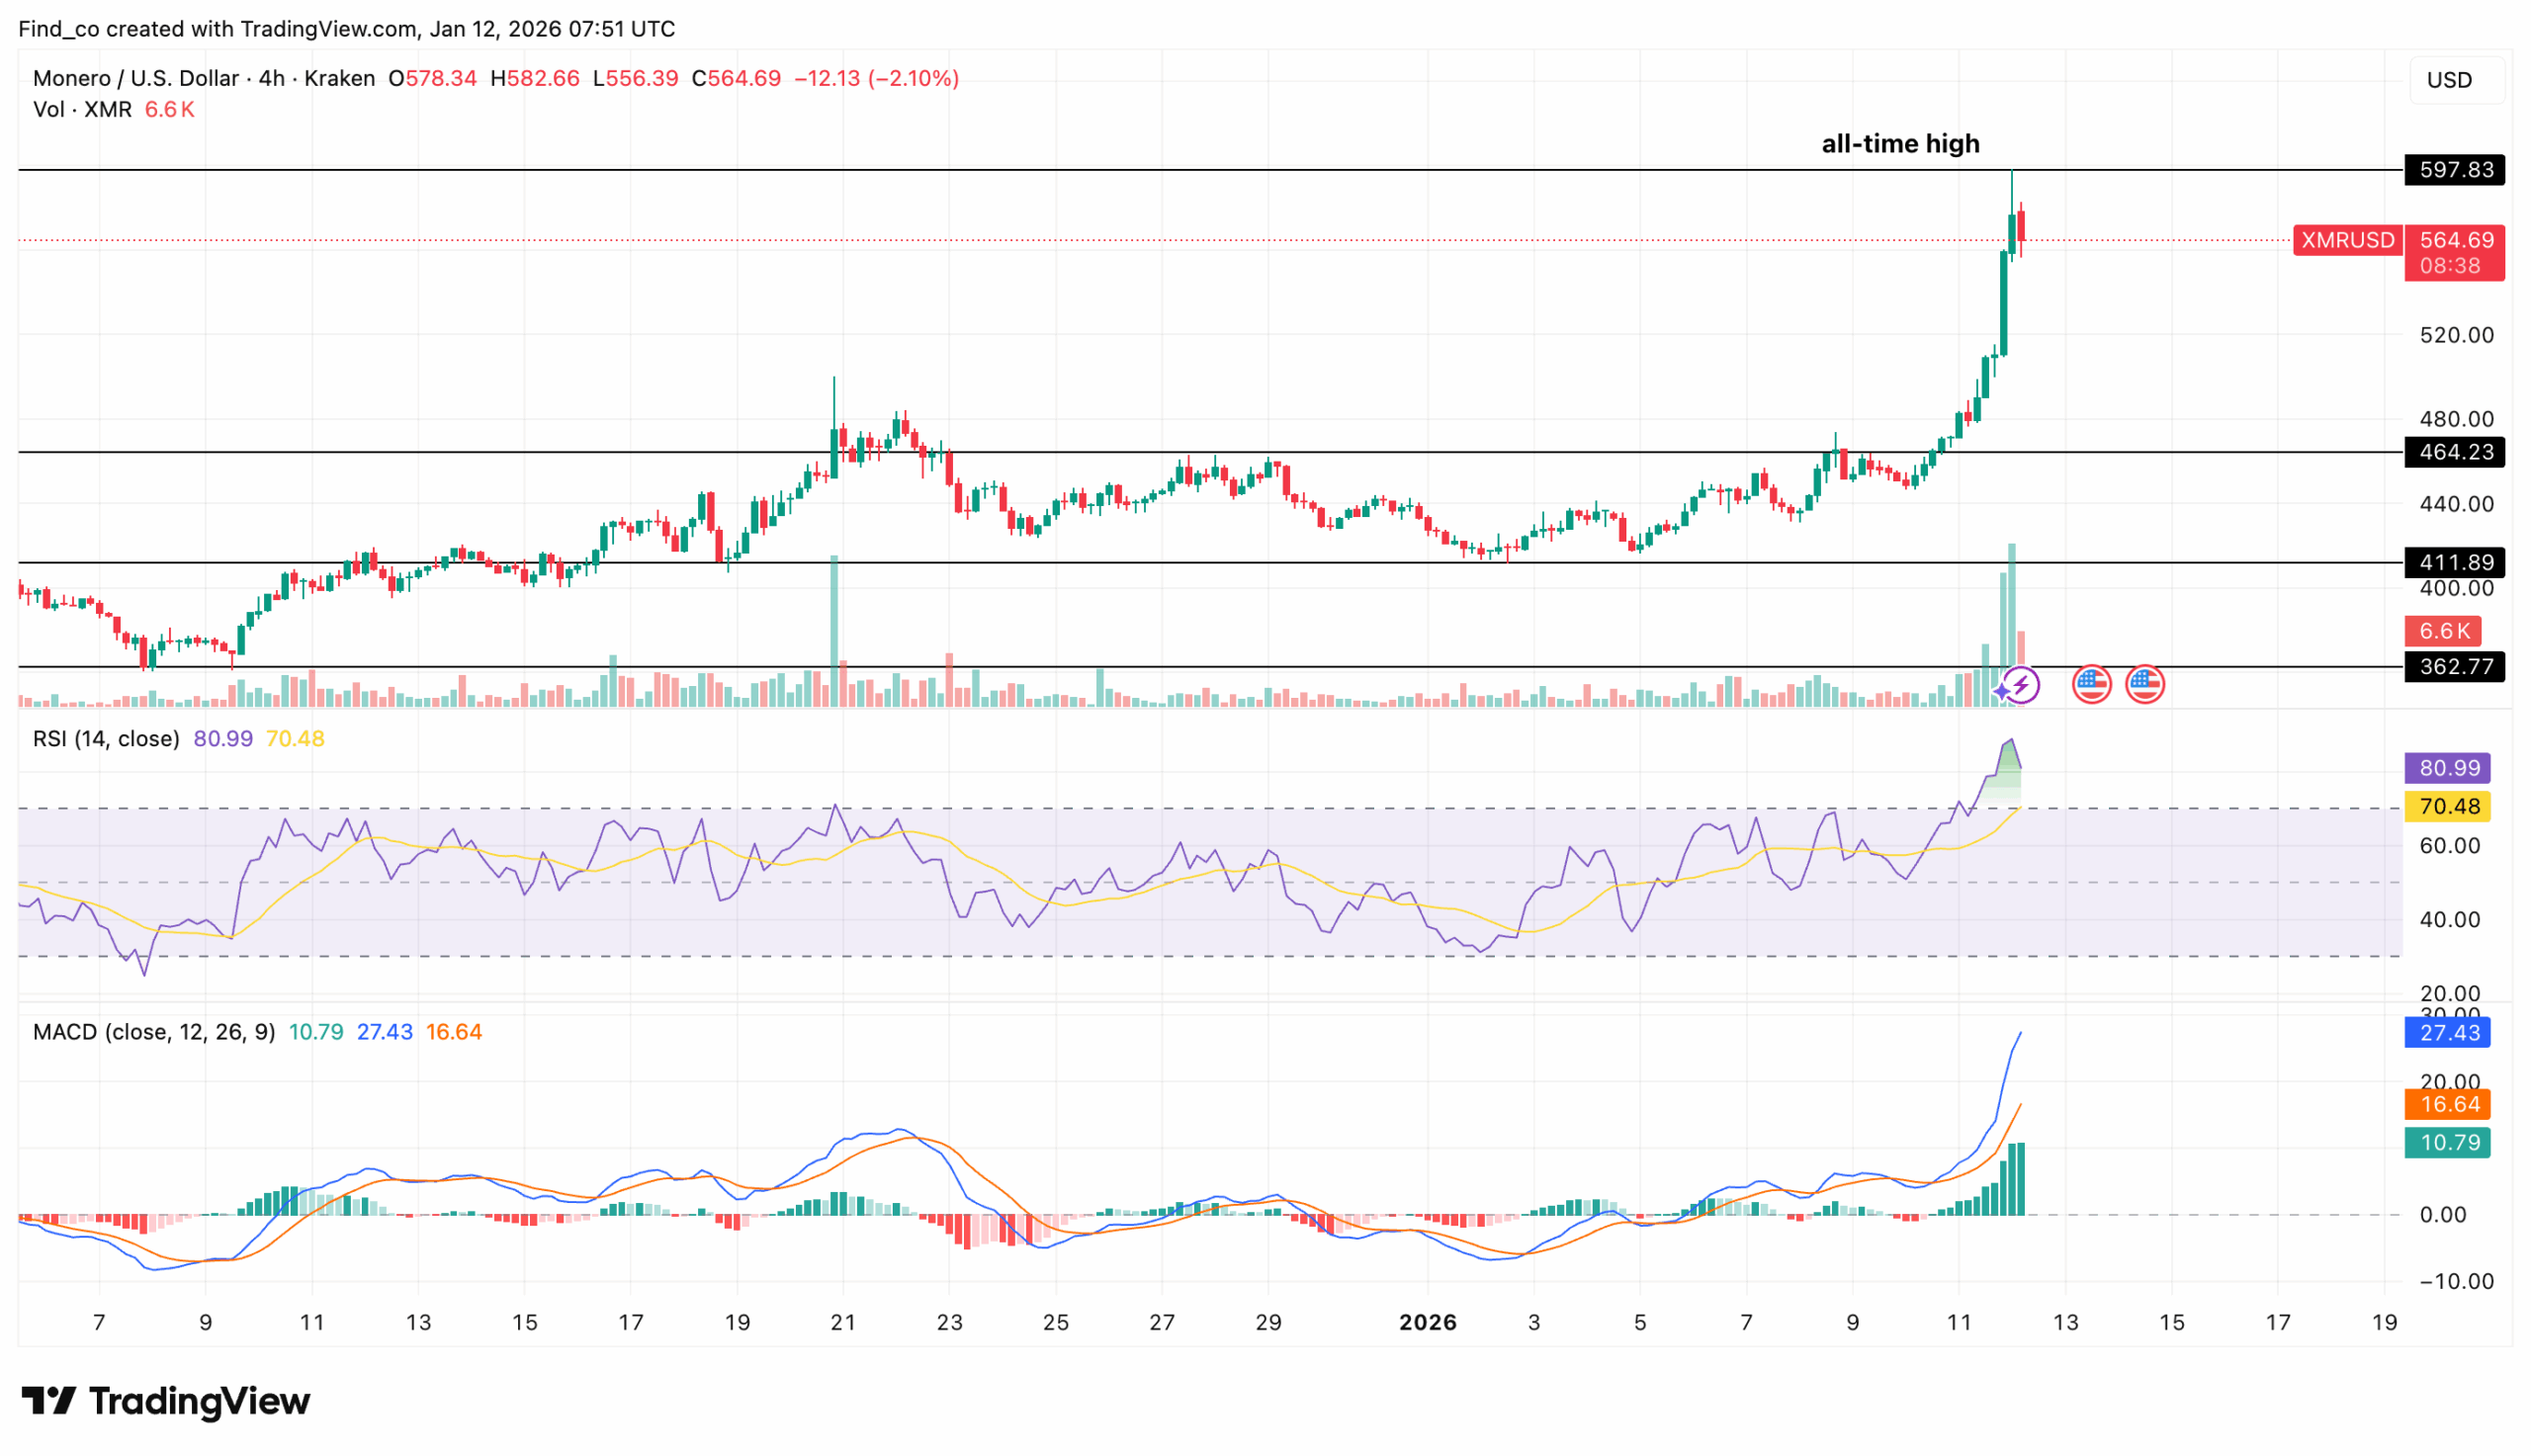
Earlier on, XMR’s price rallied to a new all-time high above $596. On the 4-hour chart, momentum remains constructive.
The Relative Strength Index (RSI) stands at 81.10, remaining in bullish territory and also seems to be overbought.
That setup reflects rising buying pressure and shows bulls still control the short-term trend.
Get These Top Crypto Casino Offers Now!
Sponsored
Disclosure
We sometimes use affiliate links in our content, when clicking on those we might receive a commission at no extra cost to you. By using this website you agree to our terms and conditions and privacy policy.
The MACD also supports the upside case. The 12-period EMA remains well above the 26-period EMA, while the histogram continues expanding in positive territory.
Together, those signals point to strengthening momentum and favor continuation over exhaustion.
Structurally, CCN observed that the XMR’s price hit a new record high after bulls reclaimed the $411.89 and $464.23 support zone.
As it stands, a breakout above that ceiling could validate the next leg higher and open a push toward $650.
Higher OI, Higher Volume
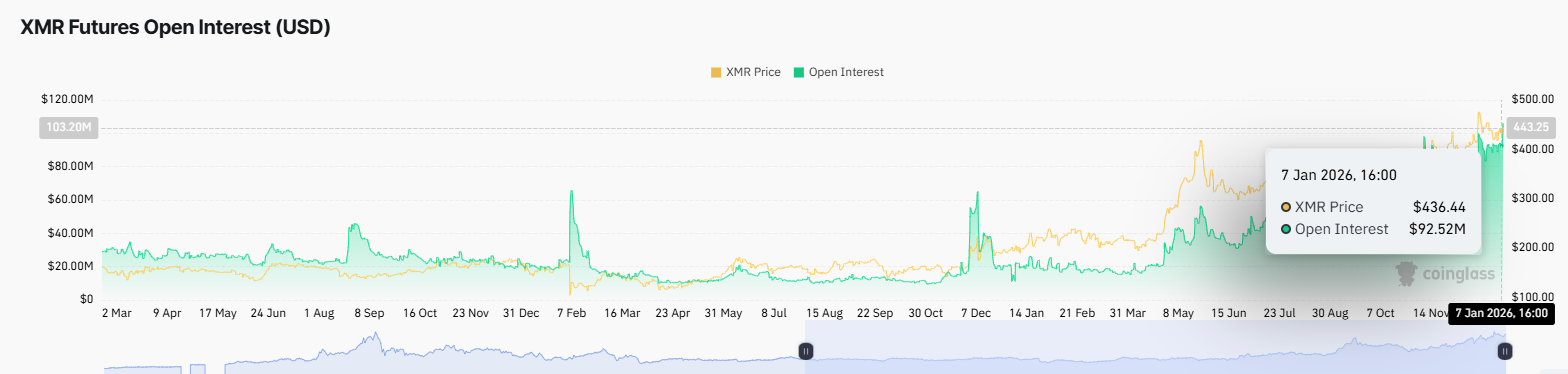
Derivatives activity adds another layer. Open interest in XMR coin futures has increased by 18%, indicating that more traders are entering the market, and speculative participation is on the rise.
Volume has also surged 86%, which suggests firm conviction behind the move.
In contrast, ZEC is losing traction as derivatives activity cools and confidence weakens. If this setup holds, XMR’s price could extend toward a resistance zone above $600.
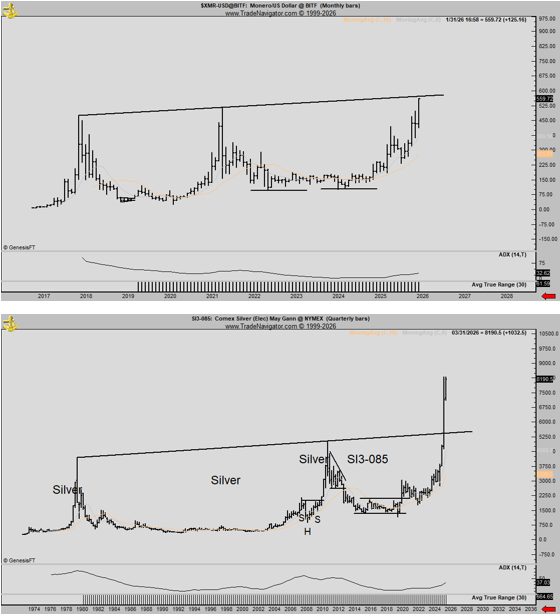
Amid this, veteran trader Peter Brandt posted a cryptic message on X. He compared the silver chart with the XMR coin, hinting that the two setups may be rhyming.
Based on that comparison, CCN observed that Brandt was pointing to a possible fractal. In simple terms, a fractal is when one asset’s price action mirrors another asset’s prior pattern.
XMR vs. Silver, According to Peter Brandt | Credit: X
“If you cannot figure out what I am telling you here then I could never be of any value to your thinking,” He added.
If XMR’s price follows silver’s path, it could rally well beyond its recent high and extend into a much larger upside move.
XMR Price Next Target: $800 and Beyond
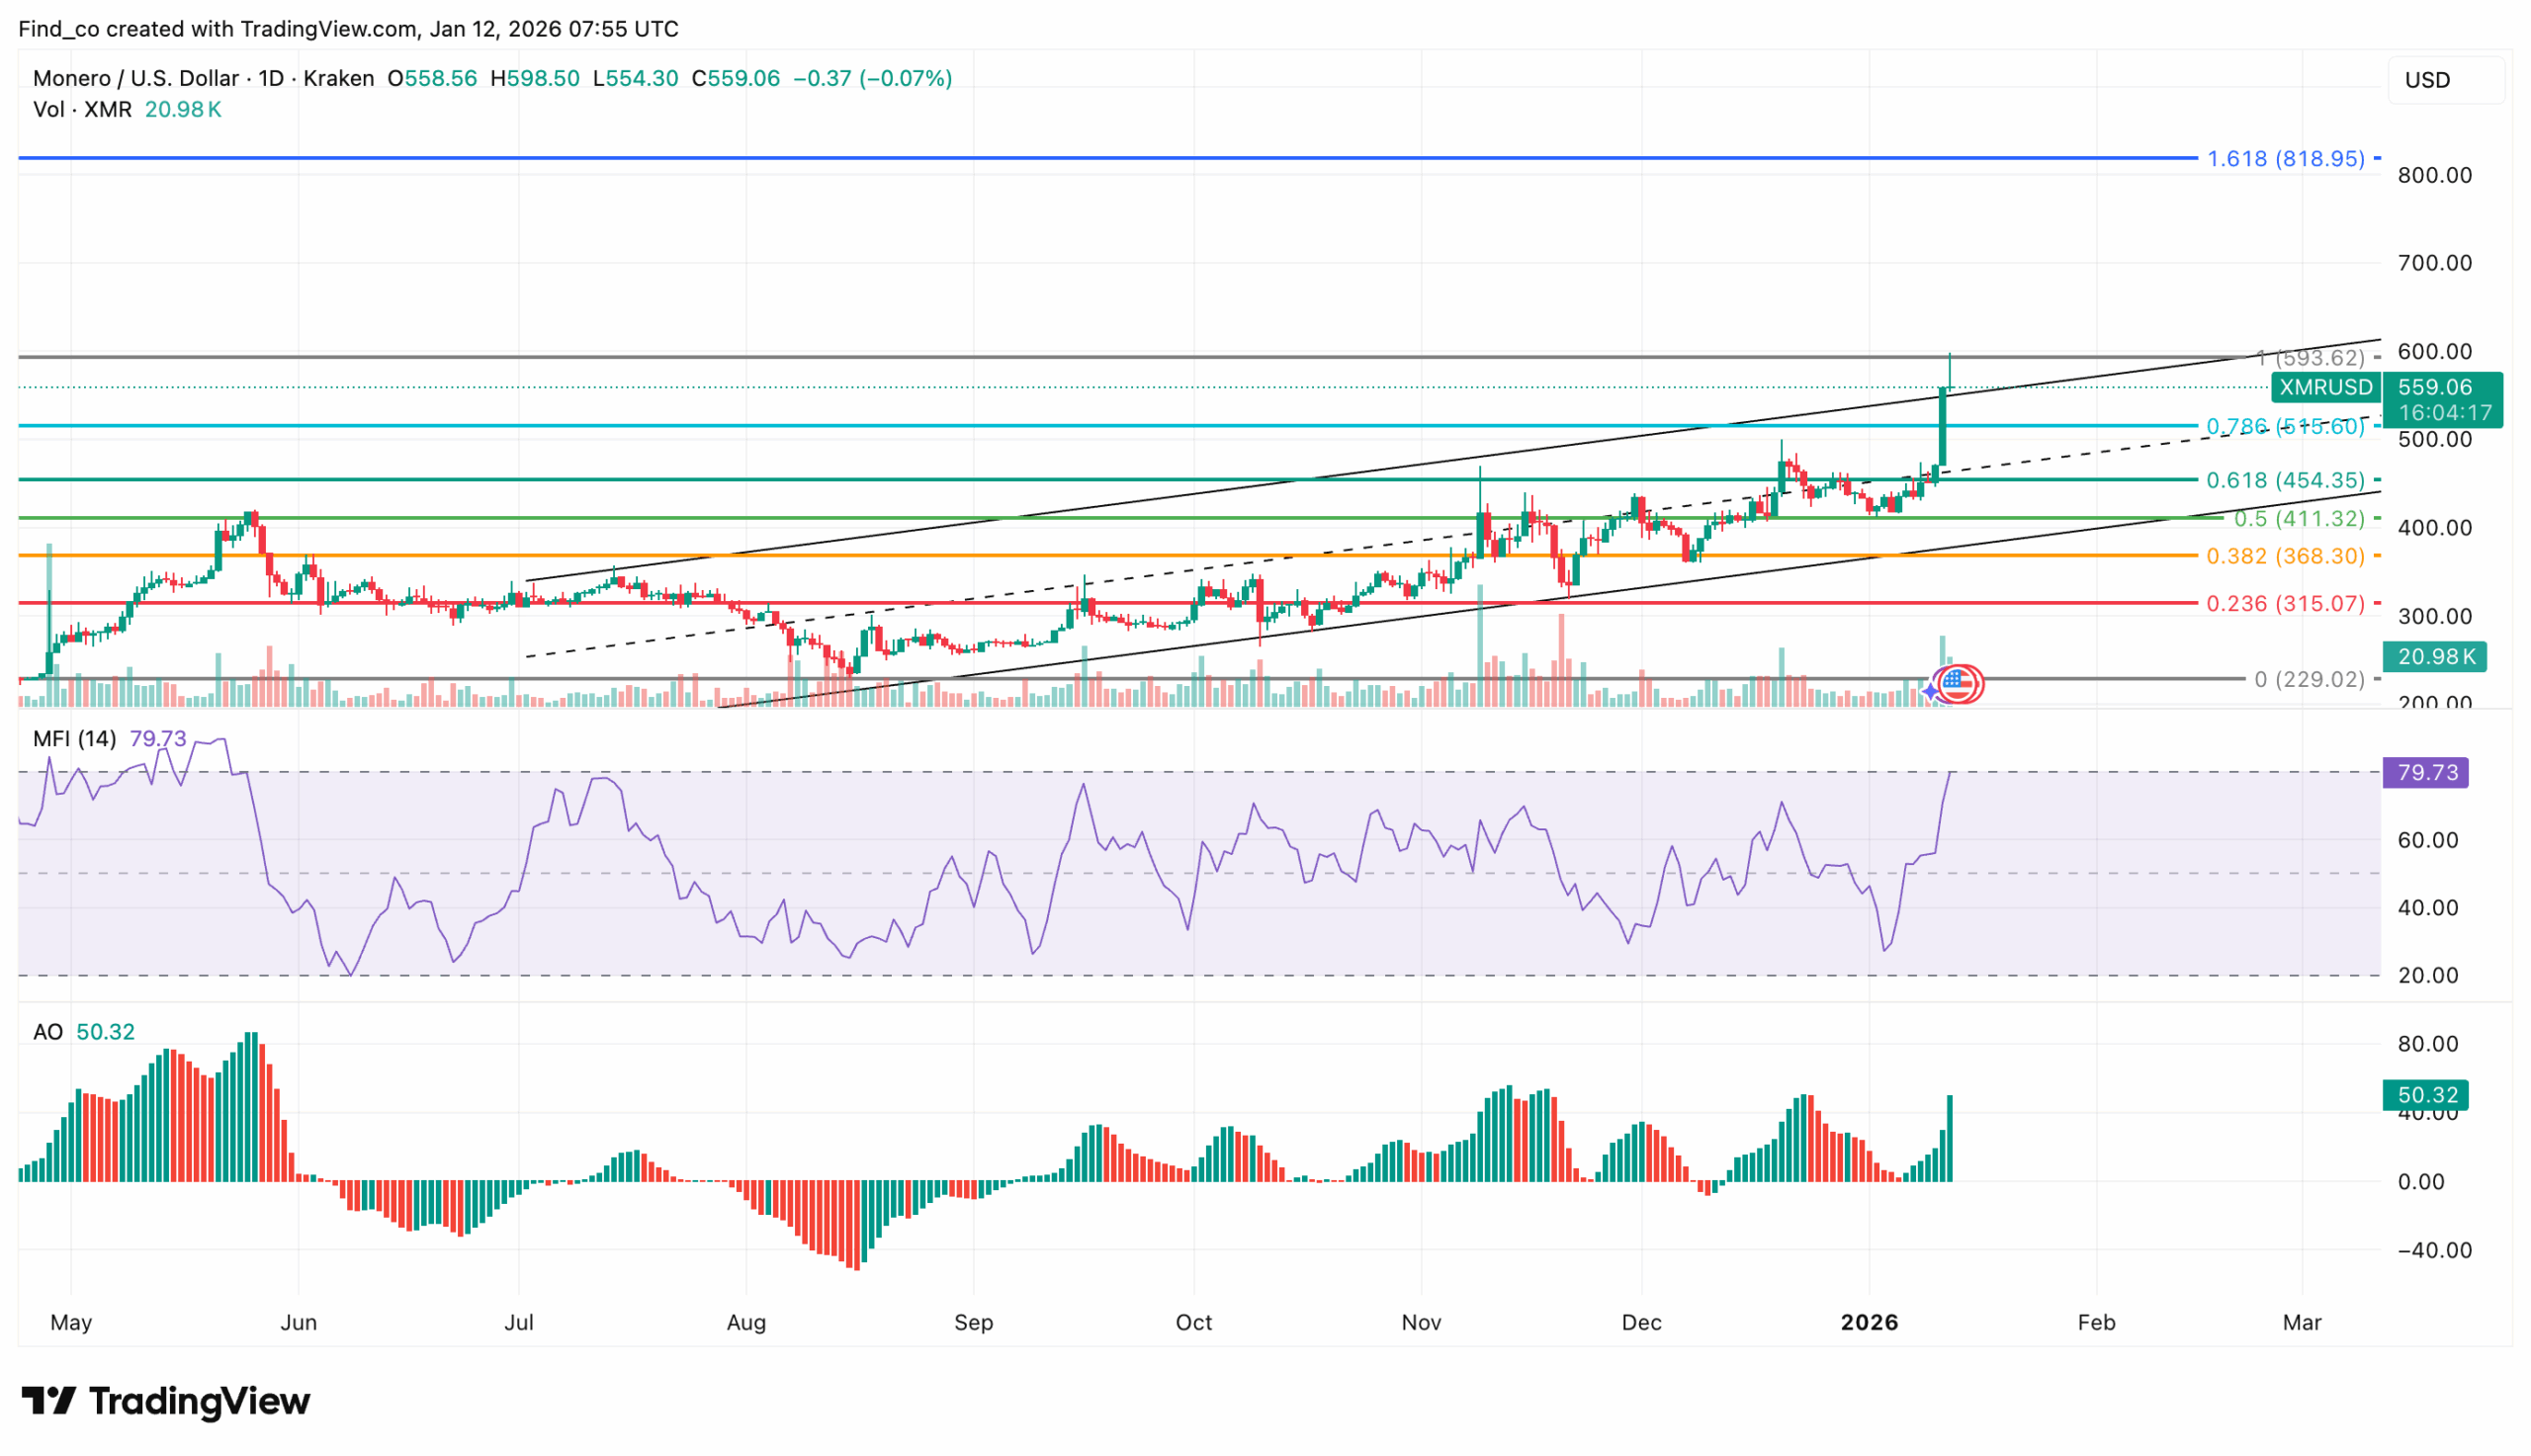
On the daily chart, XMR remains in an uptrend, trading around $565.51. The Money Flow Index (MFI) confirms growing strength. It has moved above neutral and now prints 79.76, which signals rising inflows and sustained demand.
The Awesome Oscillator also supports the trend. It has turned green while staying in positive territory, which reinforces buyer dominance. With MFI and AO aligned, the broader structure still leans bullish.
Fibonacci levels add clarity here. XMR continues to print green candles as it approaches the Fib area near $593.62
A firm close above that level would strengthen the continuation case and keep the path open toward the $88.95 mark before the end of this cycle.
XMR/USD Daily Chart | Credit: TradingView
However, the bullish outlook weakens if XMR’s price loses momentum and breaks below support near $515.60.
In that scenario, the next downside level is around $454.35, which is below the 0.618 Fib level.
Victor Olanrewaju is a crypto analyst and reporter at CCN with deep roots in on-chain research and technical analysis. His crypto journey began in 2017, but it was the 2020 Uniswap airdrop that sparked a full-time pivot into the space.
With a foundation in copywriting, Victor honed his craft creating high-converting content for leading crypto brokers — most notably an XRP price prediction that ranked #1 on Google during the 2021 bull run.
He later joined AMBCrypto in 2022, where he combined storytelling with technical and on-chain analysis to cover key market narratives.
In 2024, he expanded his expertise at BeInCrypto, collaborating with analysts and using tools like Glassnode, Santiment, and IntoTheBlock to break down Bitcoin and altcoin trends.
At CCN, Victor covers the top cryptocurrencies, memecoins, macro shifts, blending real-time insights with deep-dive metrics.
He holds a Bachelor’s degree in Physics from the University of Ibadan, equipping him to simplify complex data for a wide audience. Follow his work or connect on LinkedIn or X.