DOT is torn in between support and resistance | Credit: Hameem Sarwar
Share
Key Takeaways
DOT has rallied 16% over the past 30 days, and is now testing the key $1.40 resistance zone.
Momentum is weakening as open interest declines, and sellers continue defending higher levels.
A breakout above $1.40 could push DOT higher, while a break below $1.30 could trigger downside pressure.
Polkadot (DOT) is back in focus after posting a 18% rally on the monthly timeframe, pushing the altcoin toward a critical breakout zone.
Bulls have regained short-term control. However, indicators are beginning to flash warning signs.
As DOT approaches major resistance, here are the key levels to watch.
DOT Eyes Fresh Highs
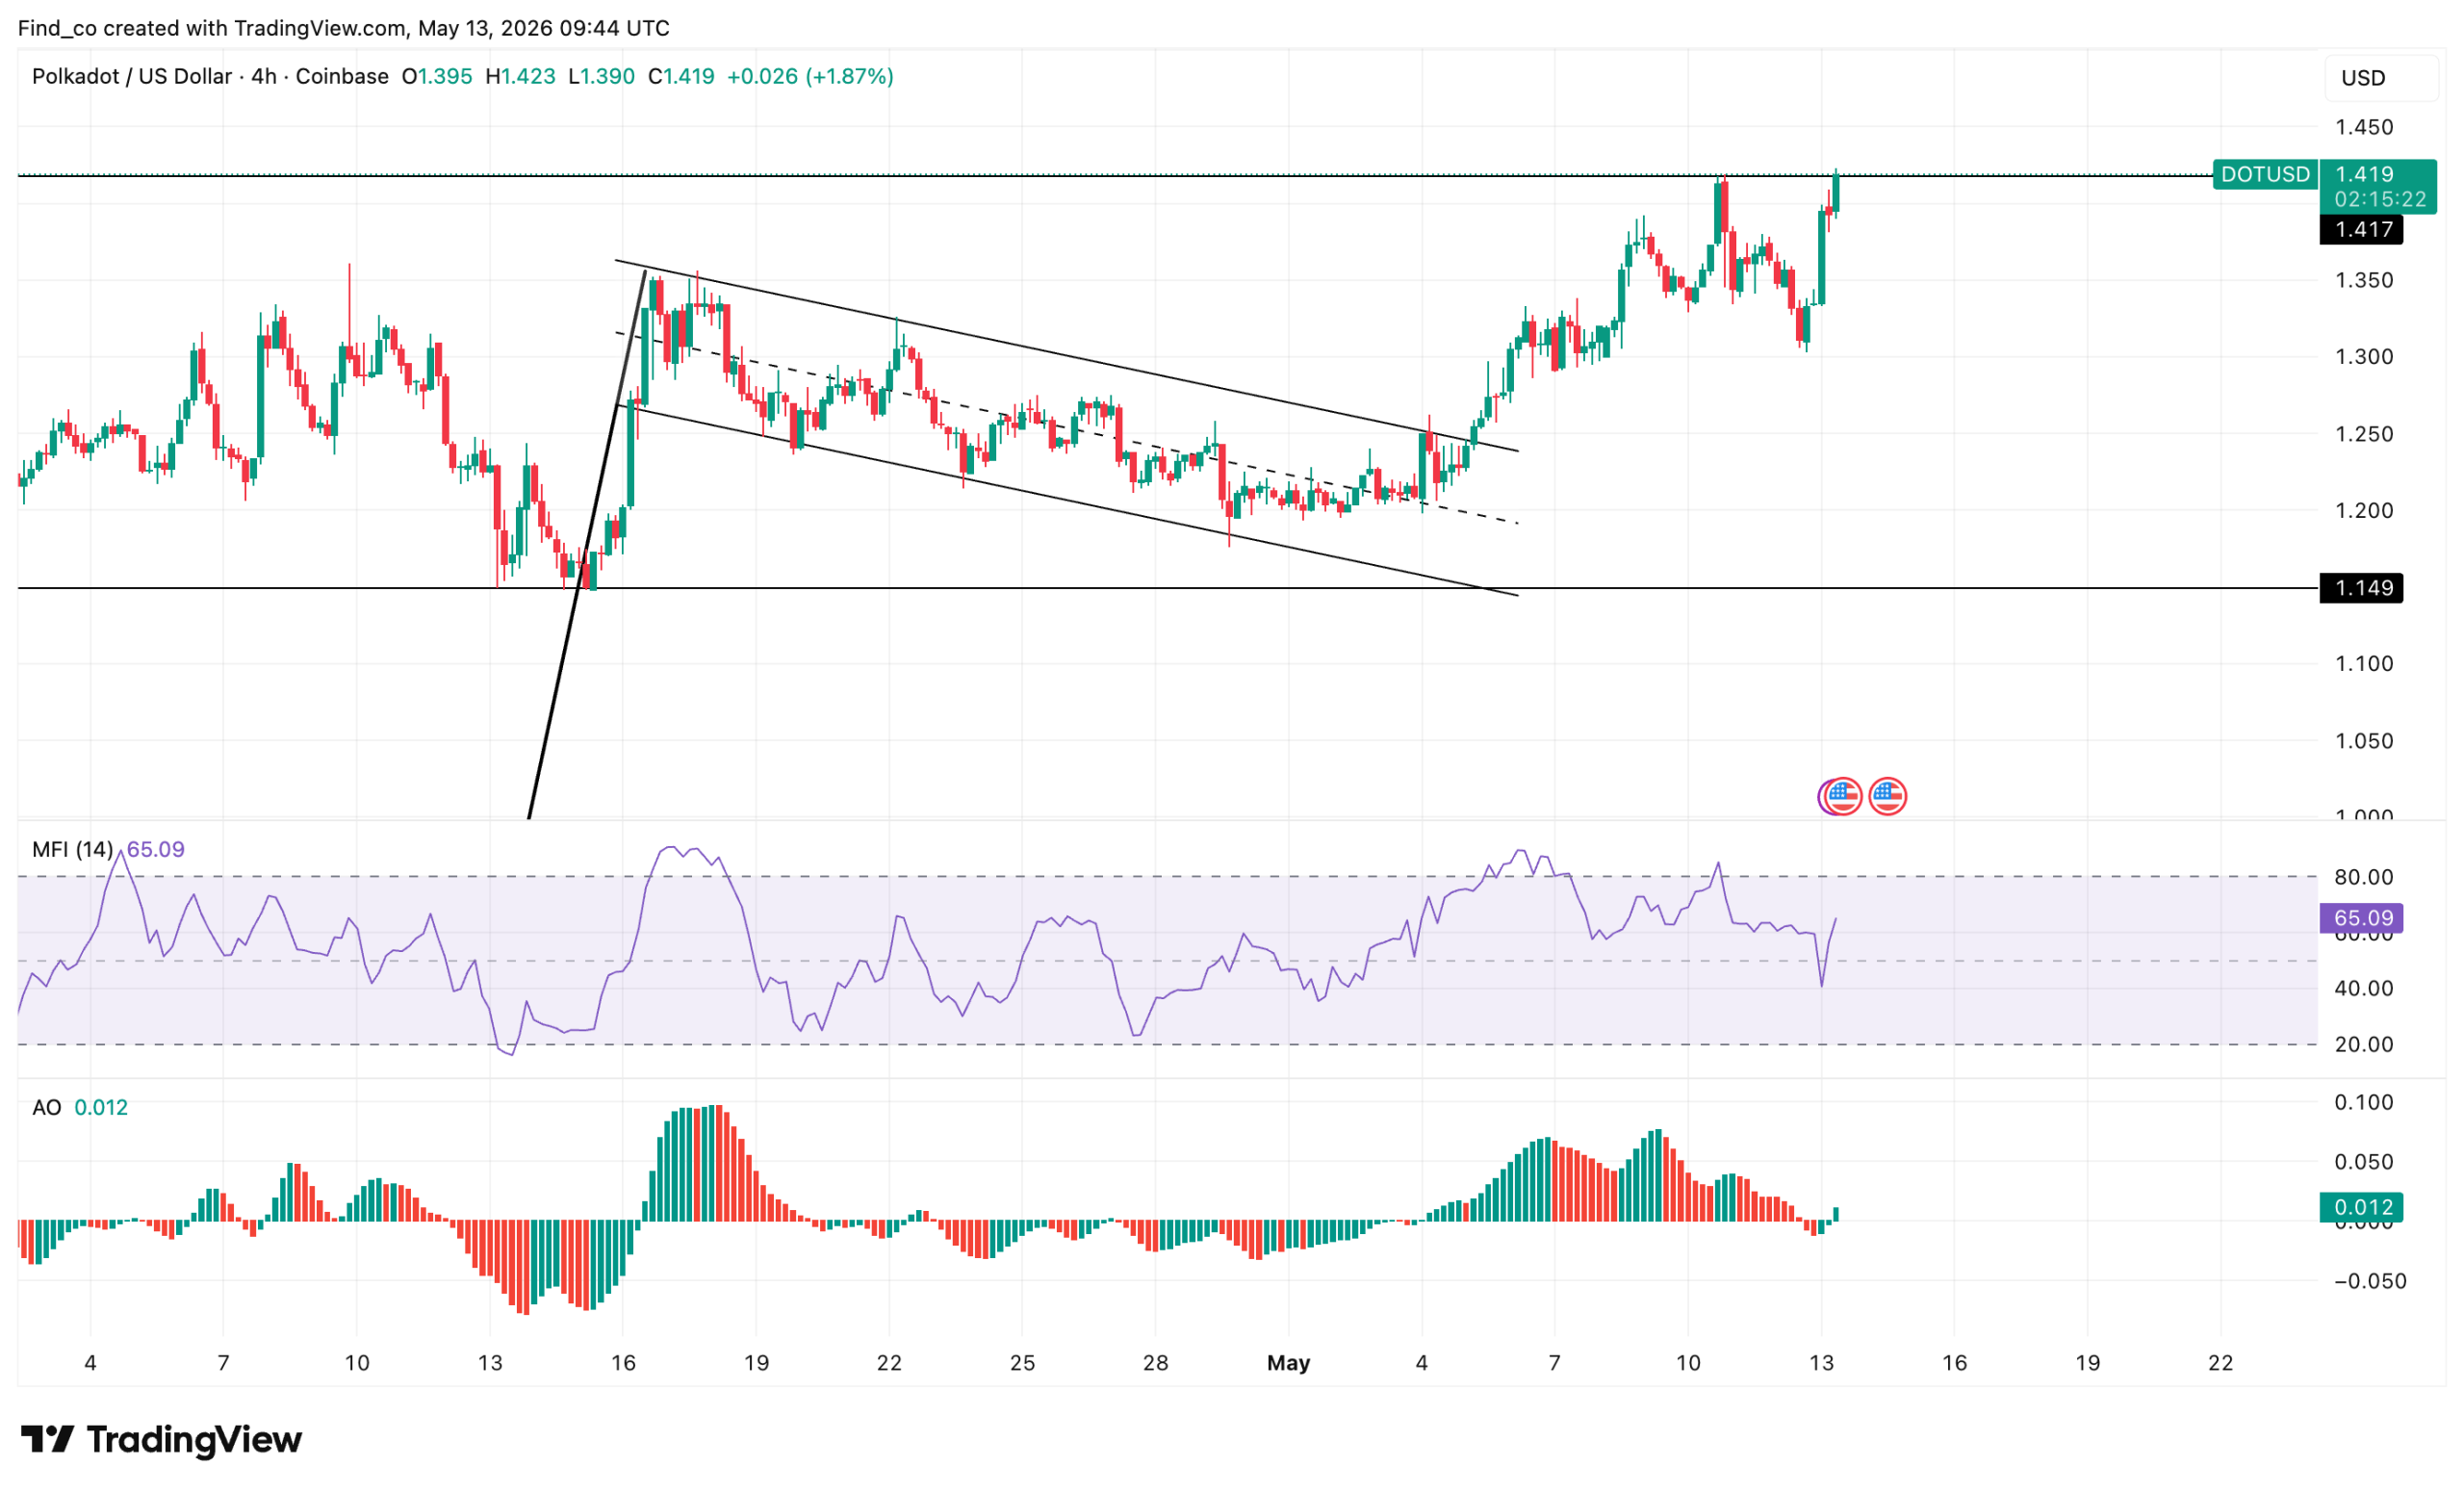
DOT is approaching a critical zone after climbing steadily toward the $1.40 resistance region. The 4-hour chart shows buyers regaining control over the past week.
However, bullish momentum is now beginning to fade as sellers continue defending the upper boundary.
Notably, Polkadot’s price recently printed multiple higher highs and higher lows, confirming a short-term bullish structure.
Get These Top Crypto Casino Offers Now!
Sponsored
Disclosure
We sometimes use affiliate links in our content, when clicking on those we might receive a commission at no extra cost to you. By using this website you agree to our terms and conditions and privacy policy.
In addition, the price rebounded from the $1.20 region earlier in May, allowing bulls to quickly recover lost ground.
Still, the latest candles reveal hesitation near resistance. Several rejection wicks have appeared around the $1.40 zone, showing that bears remain active at higher levels.
The Relative Strength Index (RSI) remains above the neutral 50 level, currently around 56. This suggests buyers still hold slight control of momentum.
Meanwhile, the Awesome Oscillator (AO) is flattening near the zero line after a strong bullish wave earlier in the month. Histogram bars have also shrunk, signaling fading momentum and reduced buyer aggression.
The $1.40 level now stands as the most important resistance zone on the chart.
A breakout above this area could strengthen bullish continuation and potentially open the door toward fresh monthly highs.
Recovery Faces Skepticism
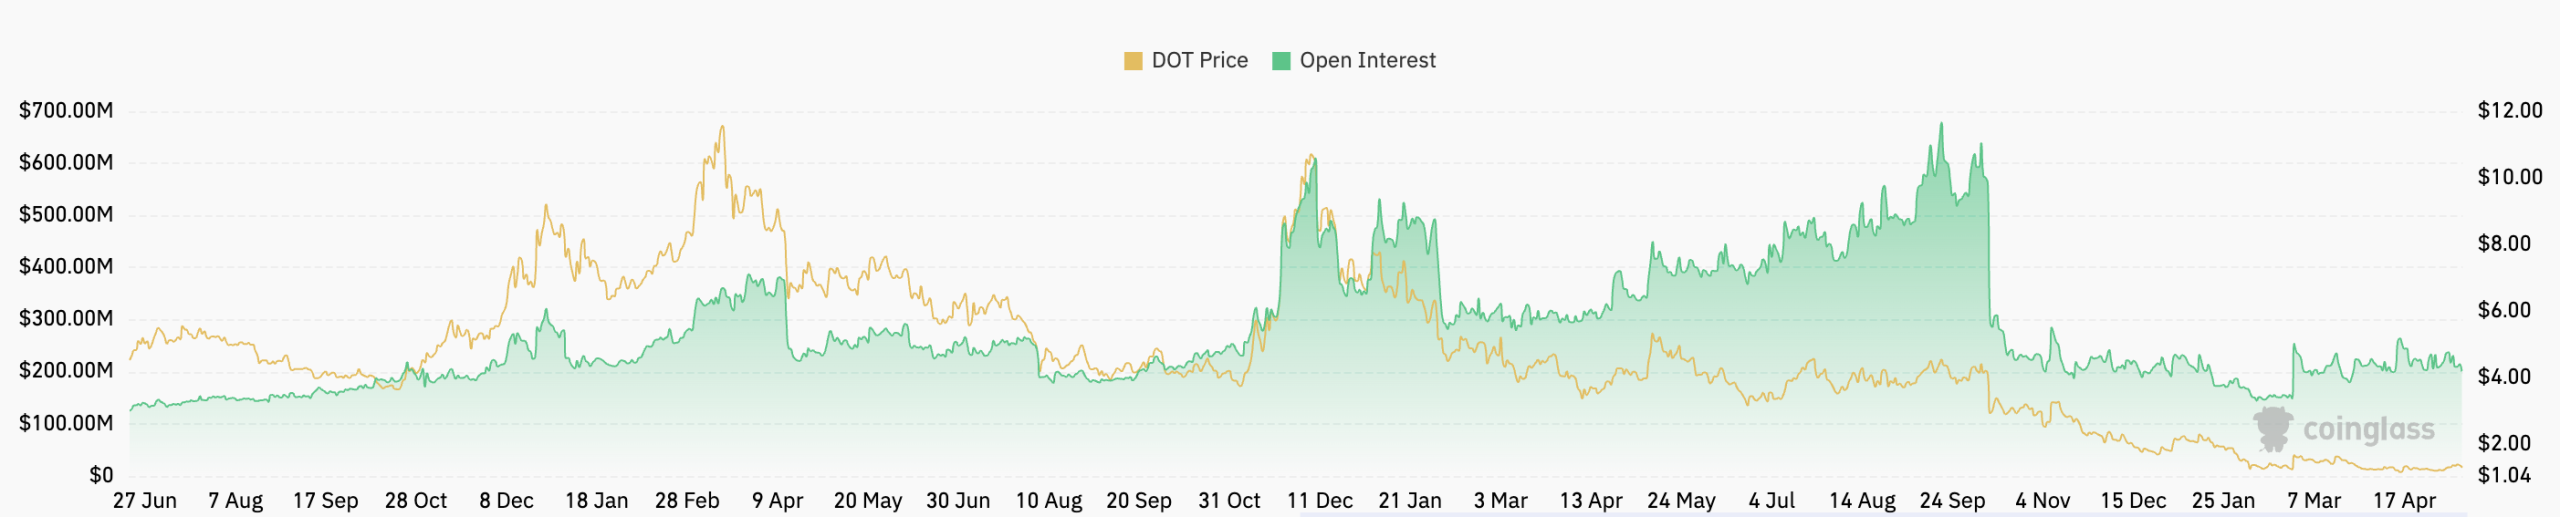
Polkadot’s derivatives market is showing caution, with open interest declining by 7% despite the recent price recovery.
Typically, falling open interest during an upward move suggests traders are reducing leveraged exposure rather than opening aggressive new positions.
This signals weakening conviction behind the rally, even as Polkadot’s price attempts to stabilize above $1.30.
However, the disconnect between improving spot momentum and declining futures participation suggests the recovery may still lack strong institutional backing.
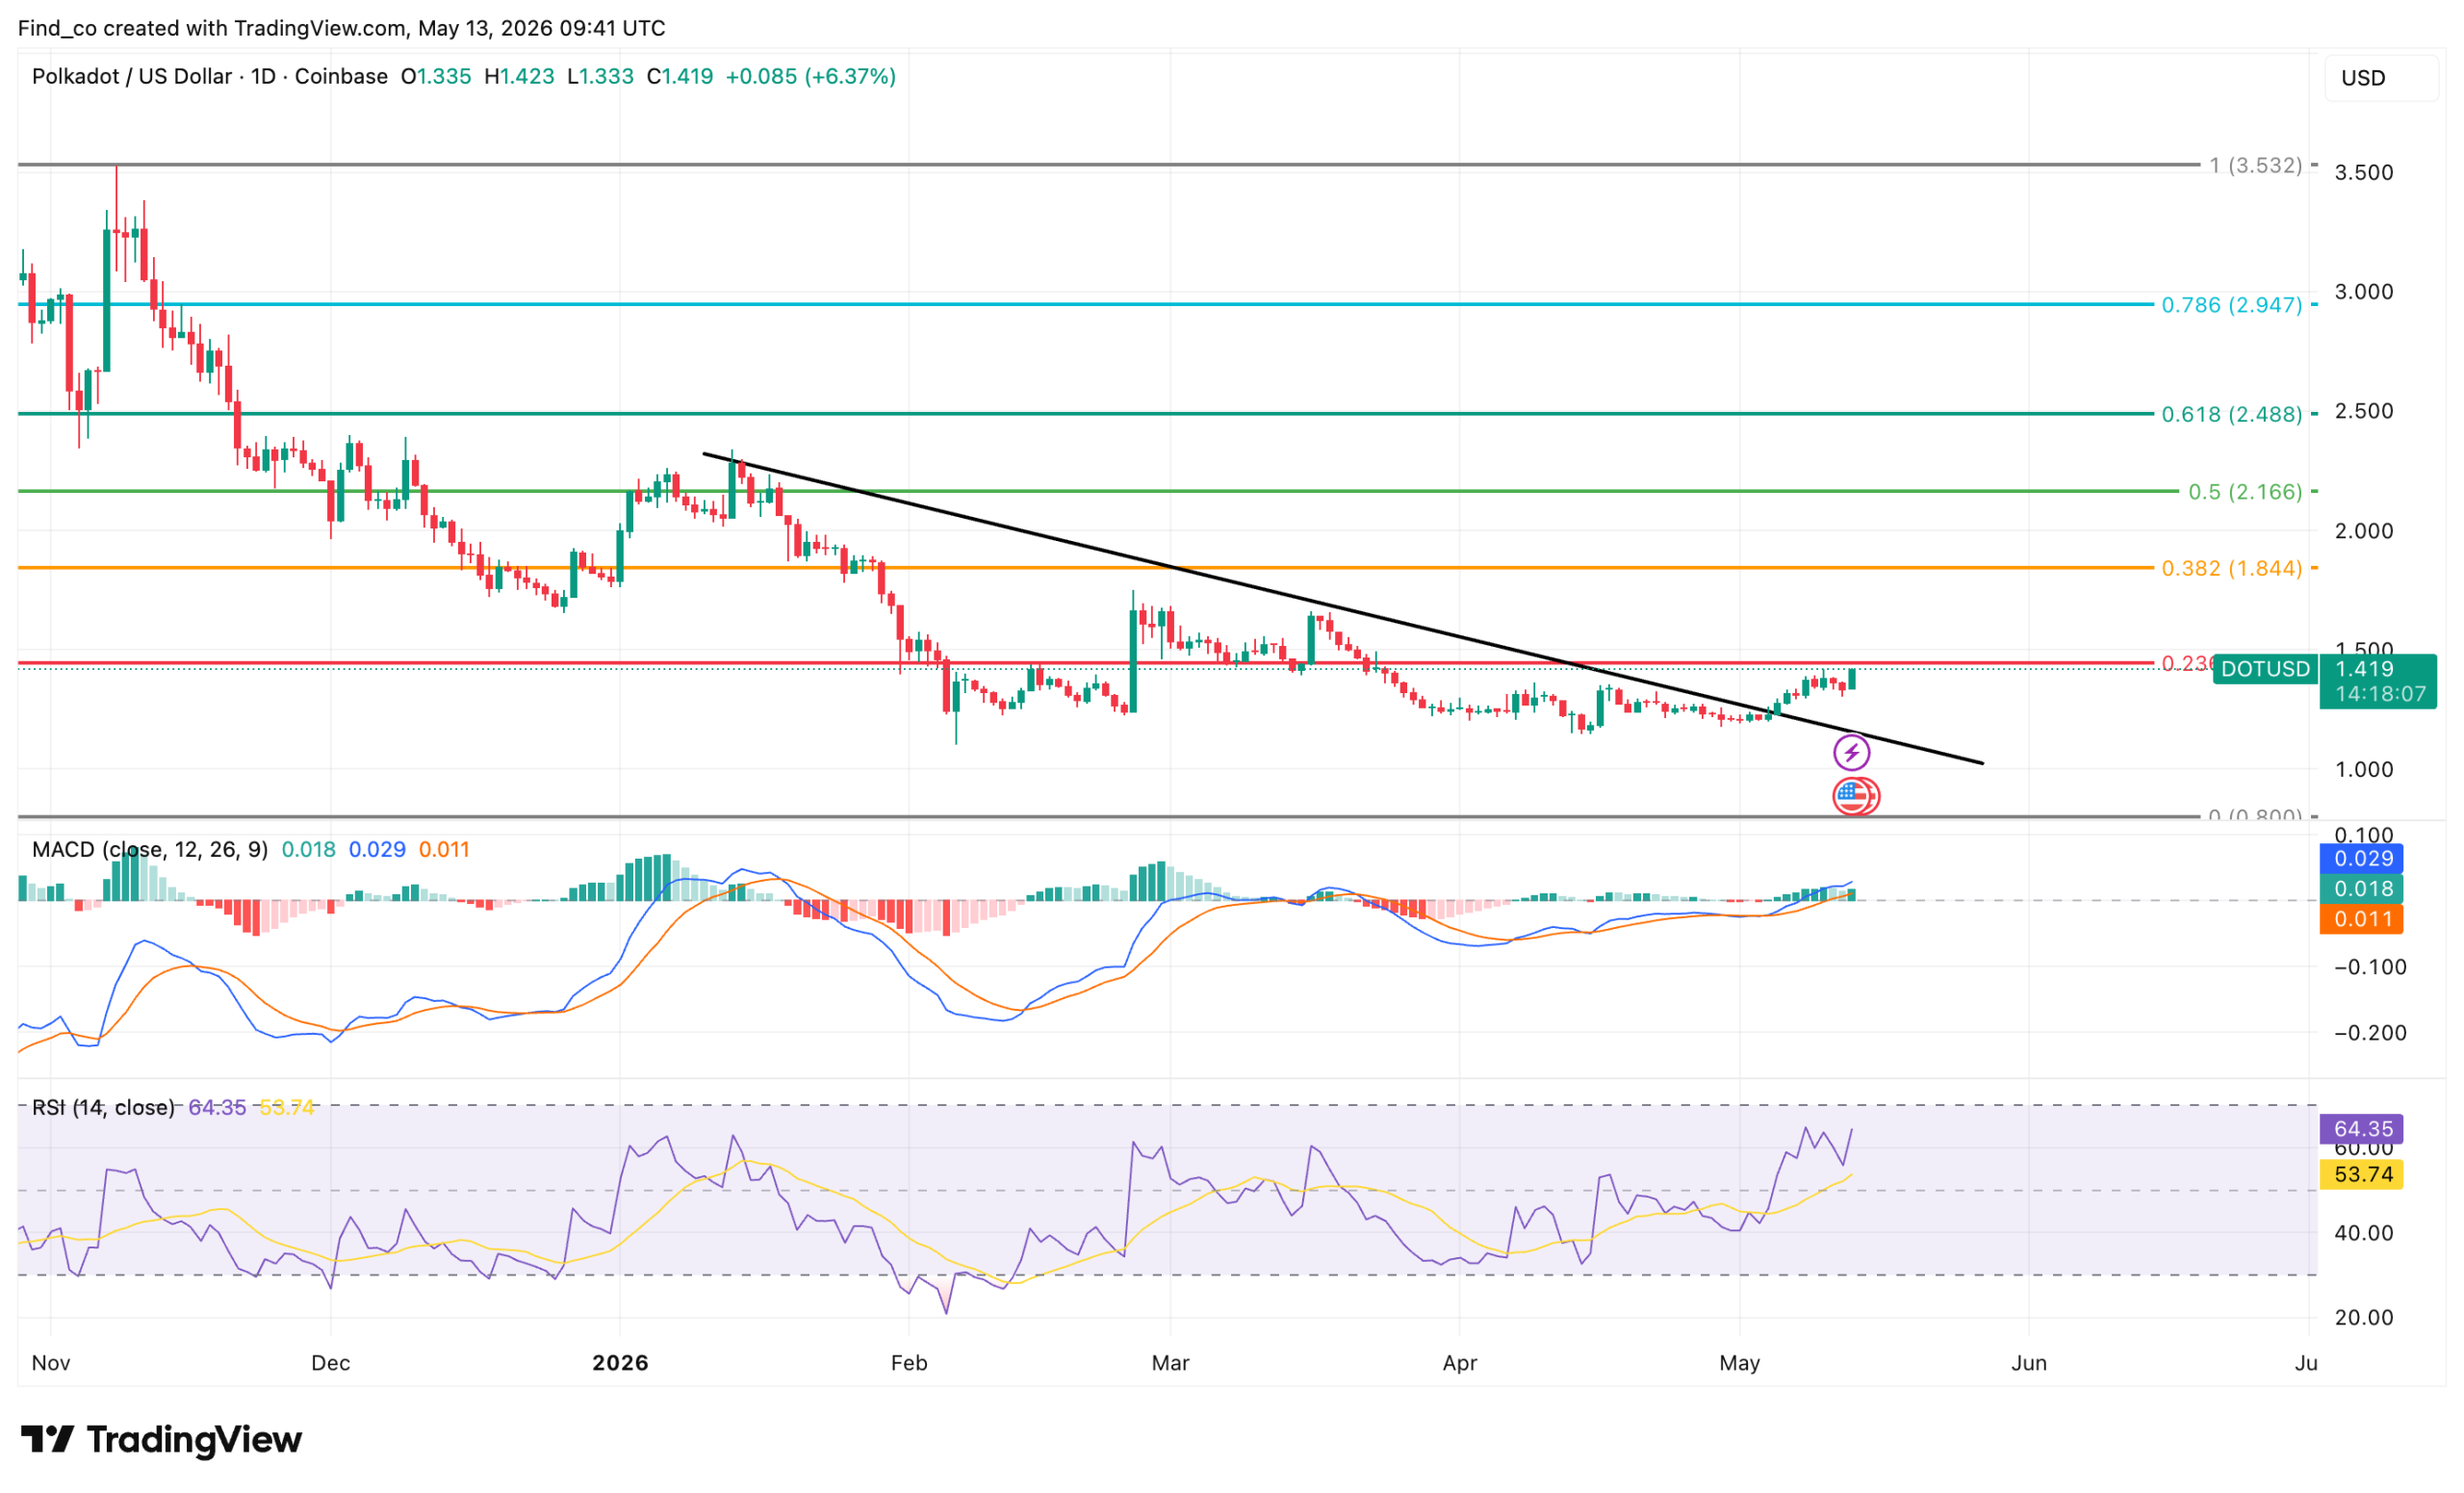
On the daily chart, price has rebounded toward the $1.38 region while attempting to break above the descending trendline that has capped rallies since late 2025.
Although the broader structure remains bearish, momentum is gradually shifting in favor of buyers.
Meanwhile, the Moving Average Convergence Divergence (MACD) has crossed into positive territory, signaling improving short-term momentum.
The Relative Strength Index (RSI) also climbed above 60, reflecting strengthening market participation and renewed buying interest.
However, DOT’s price still trades well below key Fibonacci resistance levels, particularly the $2.01 and $2.57 zones, which continue to define the broader recovery ceiling.
If buyers sustain current momentum, DOT could extend toward higher resistance clusters in the coming sessions.
Still, failure to hold above the $1.30 area may trigger renewed selling pressure, especially as macro market sentiment across altcoins remains selective rather than broadly bullish.
Disclaimer:
The information provided in this article is for informational purposes only. It is not intended to be, nor should it be construed as, financial advice. We do not make any warranties regarding the completeness, reliability, or accuracy of this information. All investments involve risk, and past performance does not guarantee future results. We recommend consulting a financial advisor before making any investment decisions.
Victor Olanrewaju is a crypto analyst and reporter at CCN with deep roots in on-chain research and technical analysis. His crypto journey began in 2017, but it was the 2020 Uniswap airdrop that sparked a full-time pivot into the space.
With a foundation in copywriting, Victor honed his craft creating high-converting content for leading crypto brokers — most notably an XRP price prediction that ranked #1 on Google during the 2021 bull run.
He later joined AMBCrypto in 2022, where he combined storytelling with technical and on-chain analysis to cover key market narratives.
In 2024, he expanded his expertise at BeInCrypto, collaborating with analysts and using tools like Glassnode, Santiment, and IntoTheBlock to break down Bitcoin and altcoin trends.
At CCN, Victor covers the top cryptocurrencies, memecoins, macro shifts, blending real-time insights with deep-dive metrics.
He holds a Bachelor’s degree in Physics from the University of Ibadan, equipping him to simplify complex data for a wide audience. Follow his work or connect on LinkedIn or X.