A Hyperbridge gateway vulnerability allowed an attacker to mint 1 billion DOT tokens on Ethereum and sell them in a single transaction.
DOT’s derivatives market is flashing severe bearish signals, hinting at further price dips.
Technically, with a bearish MACD crossover forming, the $0.63 six-month low is in play if buy-side pressure fails to recover.
Polkadot’s native coin, DOT, has shed nearly 10% of its value today, making it one of the crypto assets with the largest losses.
This comes after the Layer-0 network reportedly fell victim to an exploit that allowed an attacker to mint 1 billion DOT tokens on the Ethereum mainnet.
With on-chain and technical indicators now hinting at surging selloffs following the exploit, DOT risks falling below $1 and returning to a six-month low.
Hackers Minted 1 Billion DOT Tokens and Sold Them Off
In an earlier report, CCN noted that the attack was due to a Hyperbridge gateway vulnerability that allowed attackers to forge messages and manipulate the administrator of a Polkadot token contract on Ethereum.
According to on-chain sleuth Lookonchain, after minting the tokens, the attacker then sold the entire supply in a single transaction, making $237,000.
Due to relatively low liquidity at the time of the attack, total losses were limited to that figure.
DOT Holders Are Exiting
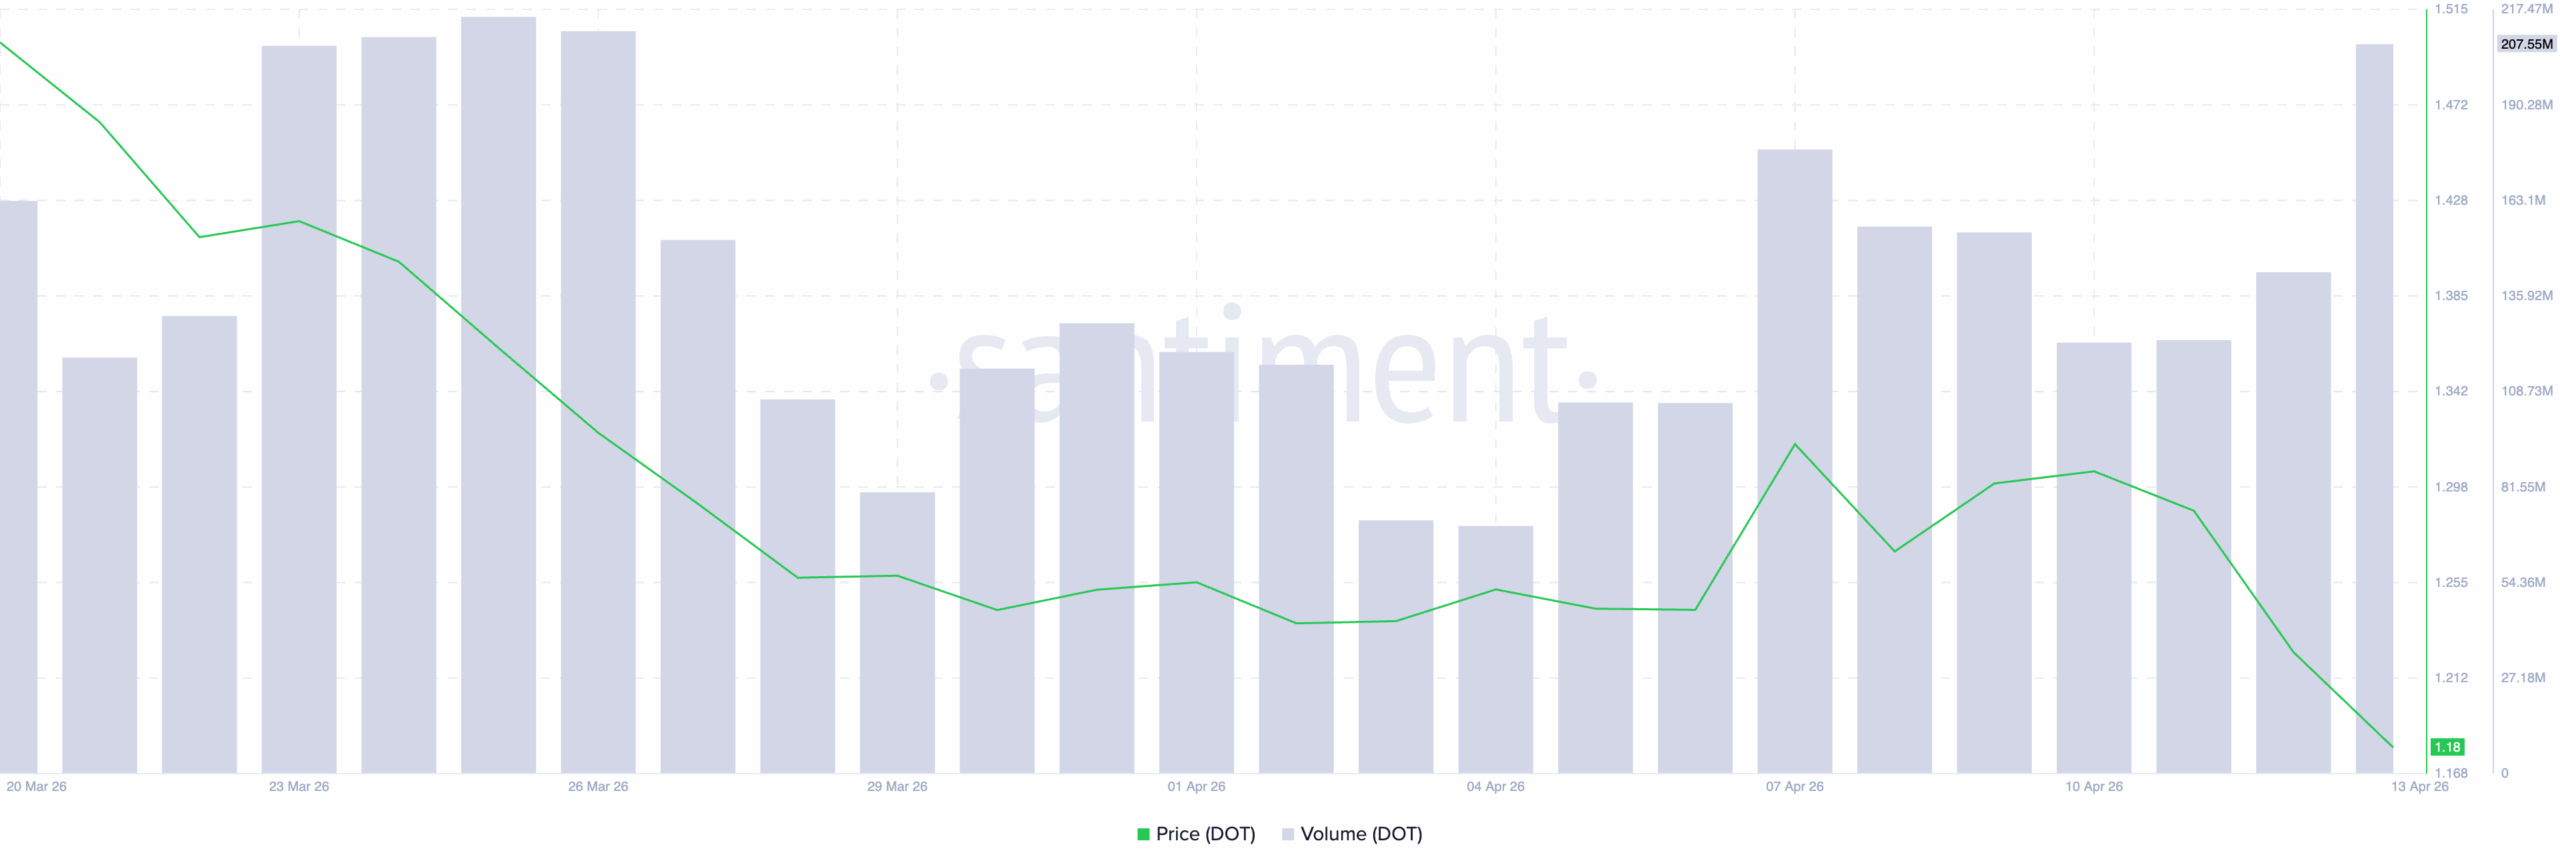
The exploit has triggered a sharp market reaction. DOT’s price has dropped 5% on the day, making it one of the worst-performing major tokens in the past 24 hours.
Down 47% during the same period, data from Santiment shows its trading volume trending in the opposite direction of price. At press time, this sits at an 18-day high of $208 million.
When an asset’s price declines while trading volume rises sharply, it is a bearish signal. The surge in volume confirms broad selling pressure among market participants.
DOT’s trading volume spike to an 18-day high suggests that the exploit has prompted a significant number of holders to exit their positions rather than hold through the uncertainty and volatility.
Long Liquidations Hit Monthly High as DOT Shorts Take Control
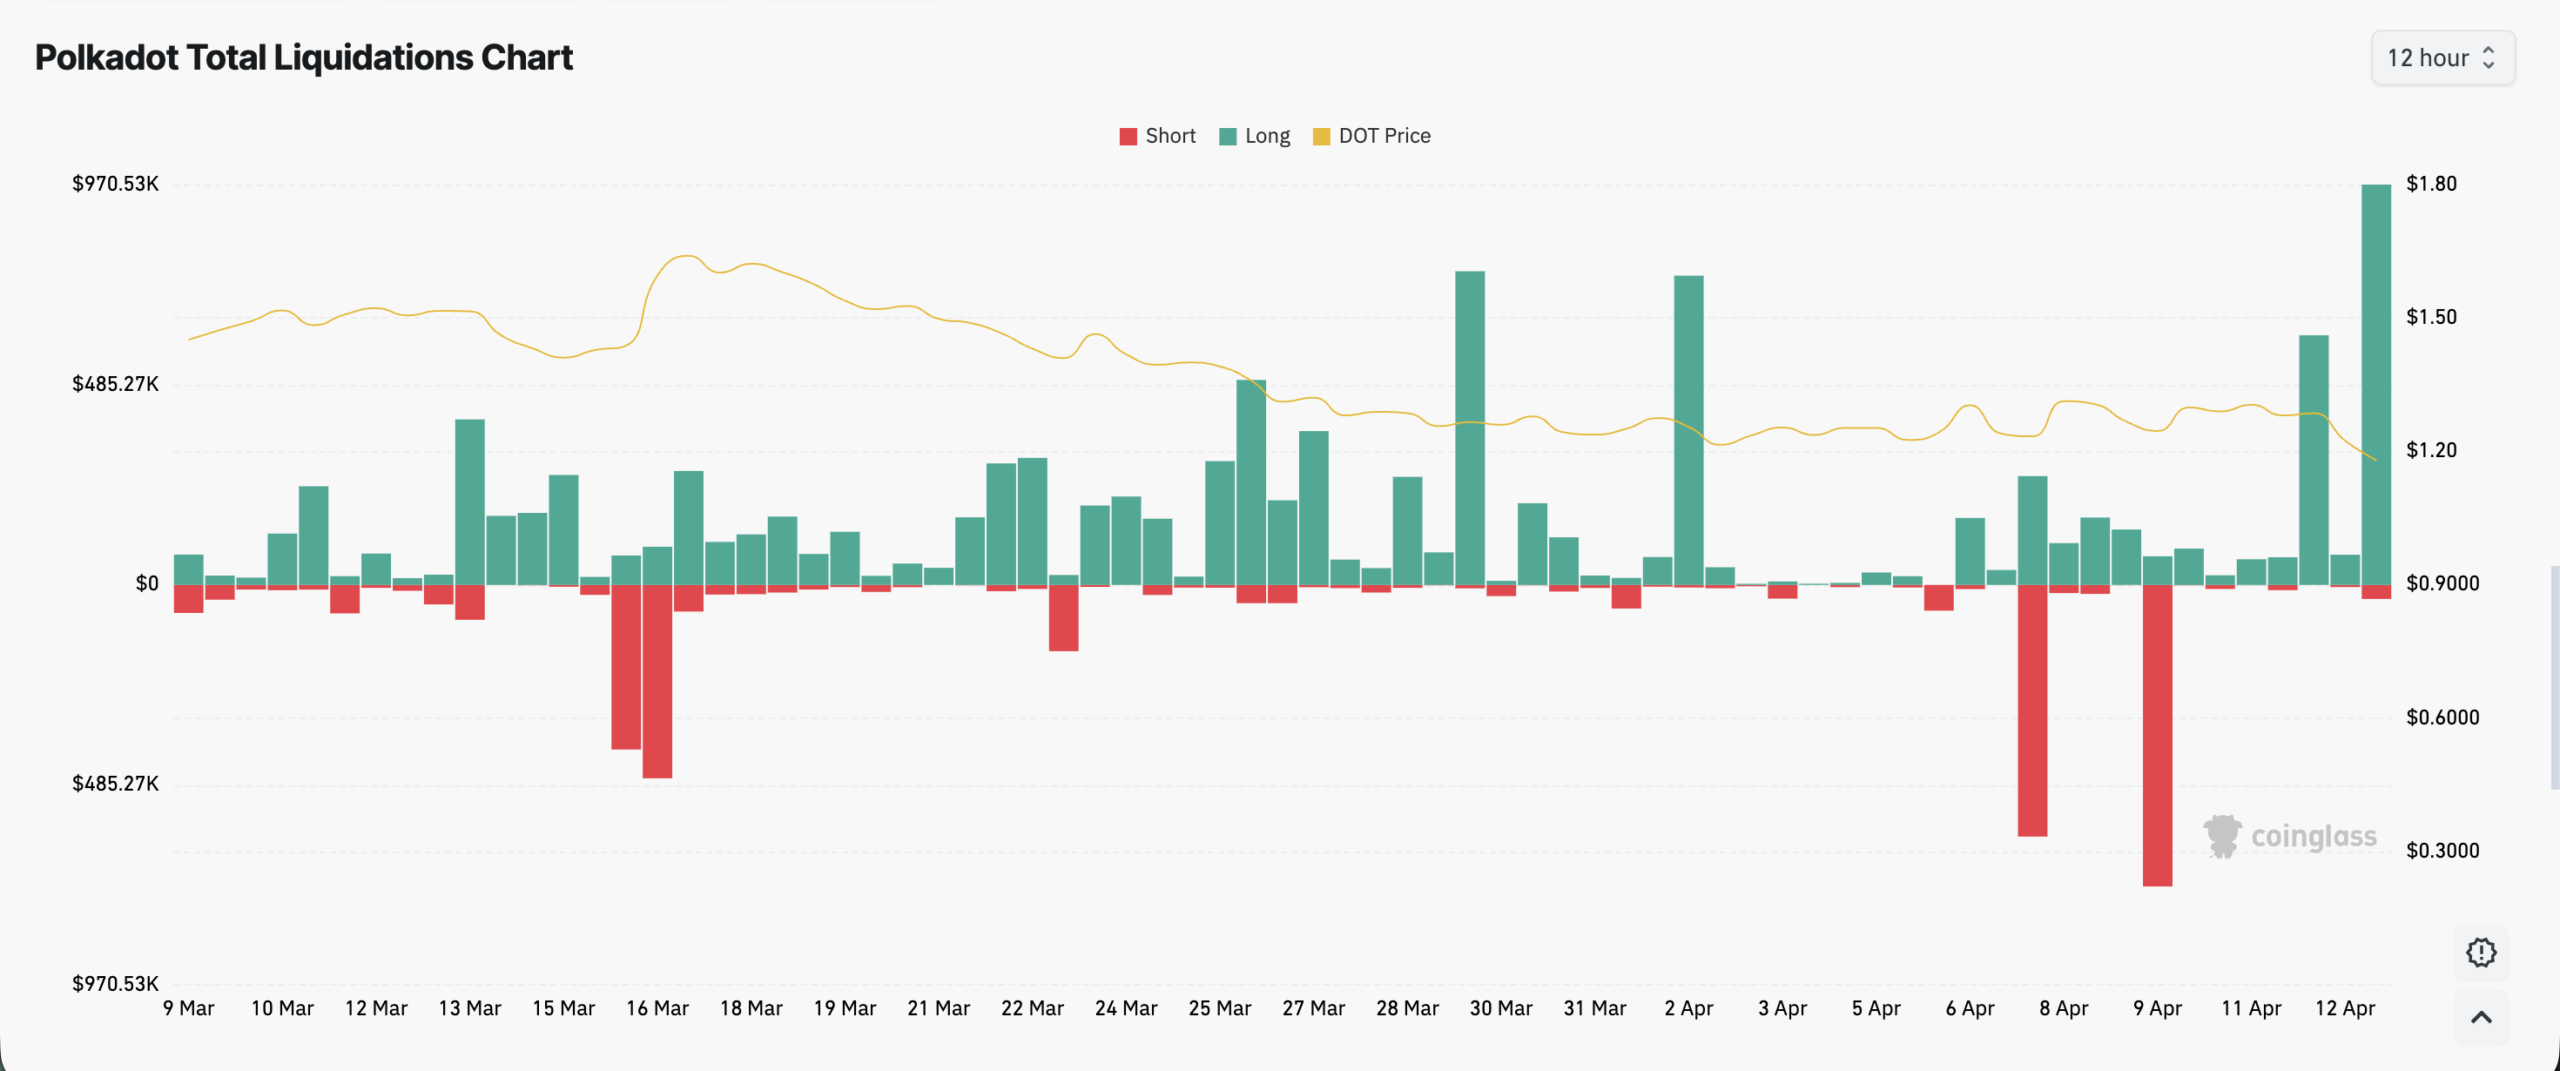
Moreover, the near-10 % dip in the coin’s price has triggered significant long liquidations. According to Coinglass data, DOT long liquidations have totaled $971,000 over the past 12 hours, marking their highest single-day figure in the past month.
Polkadot Total Liquidations Chart | Credit: Coinglass
Liquidations occur in an asset’s derivatives market when the asset’s price moves against traders’ positions. When this happens, positions are forcefully closed due to insufficient funds to maintain them.
Long liquidations happen when traders with long positions are forced to sell the asset at a lower price to cover their losses as the price falls. This happens when the asset’s price decreases beyond a certain level, forcing traders with open positions betting on a price increase to exit the market.
As long positions are forcefully closed, the resulting sell-side activity adds fresh supply to an already weakened DOT market. This may amplify price declines and trigger a cascade of further liquidations.
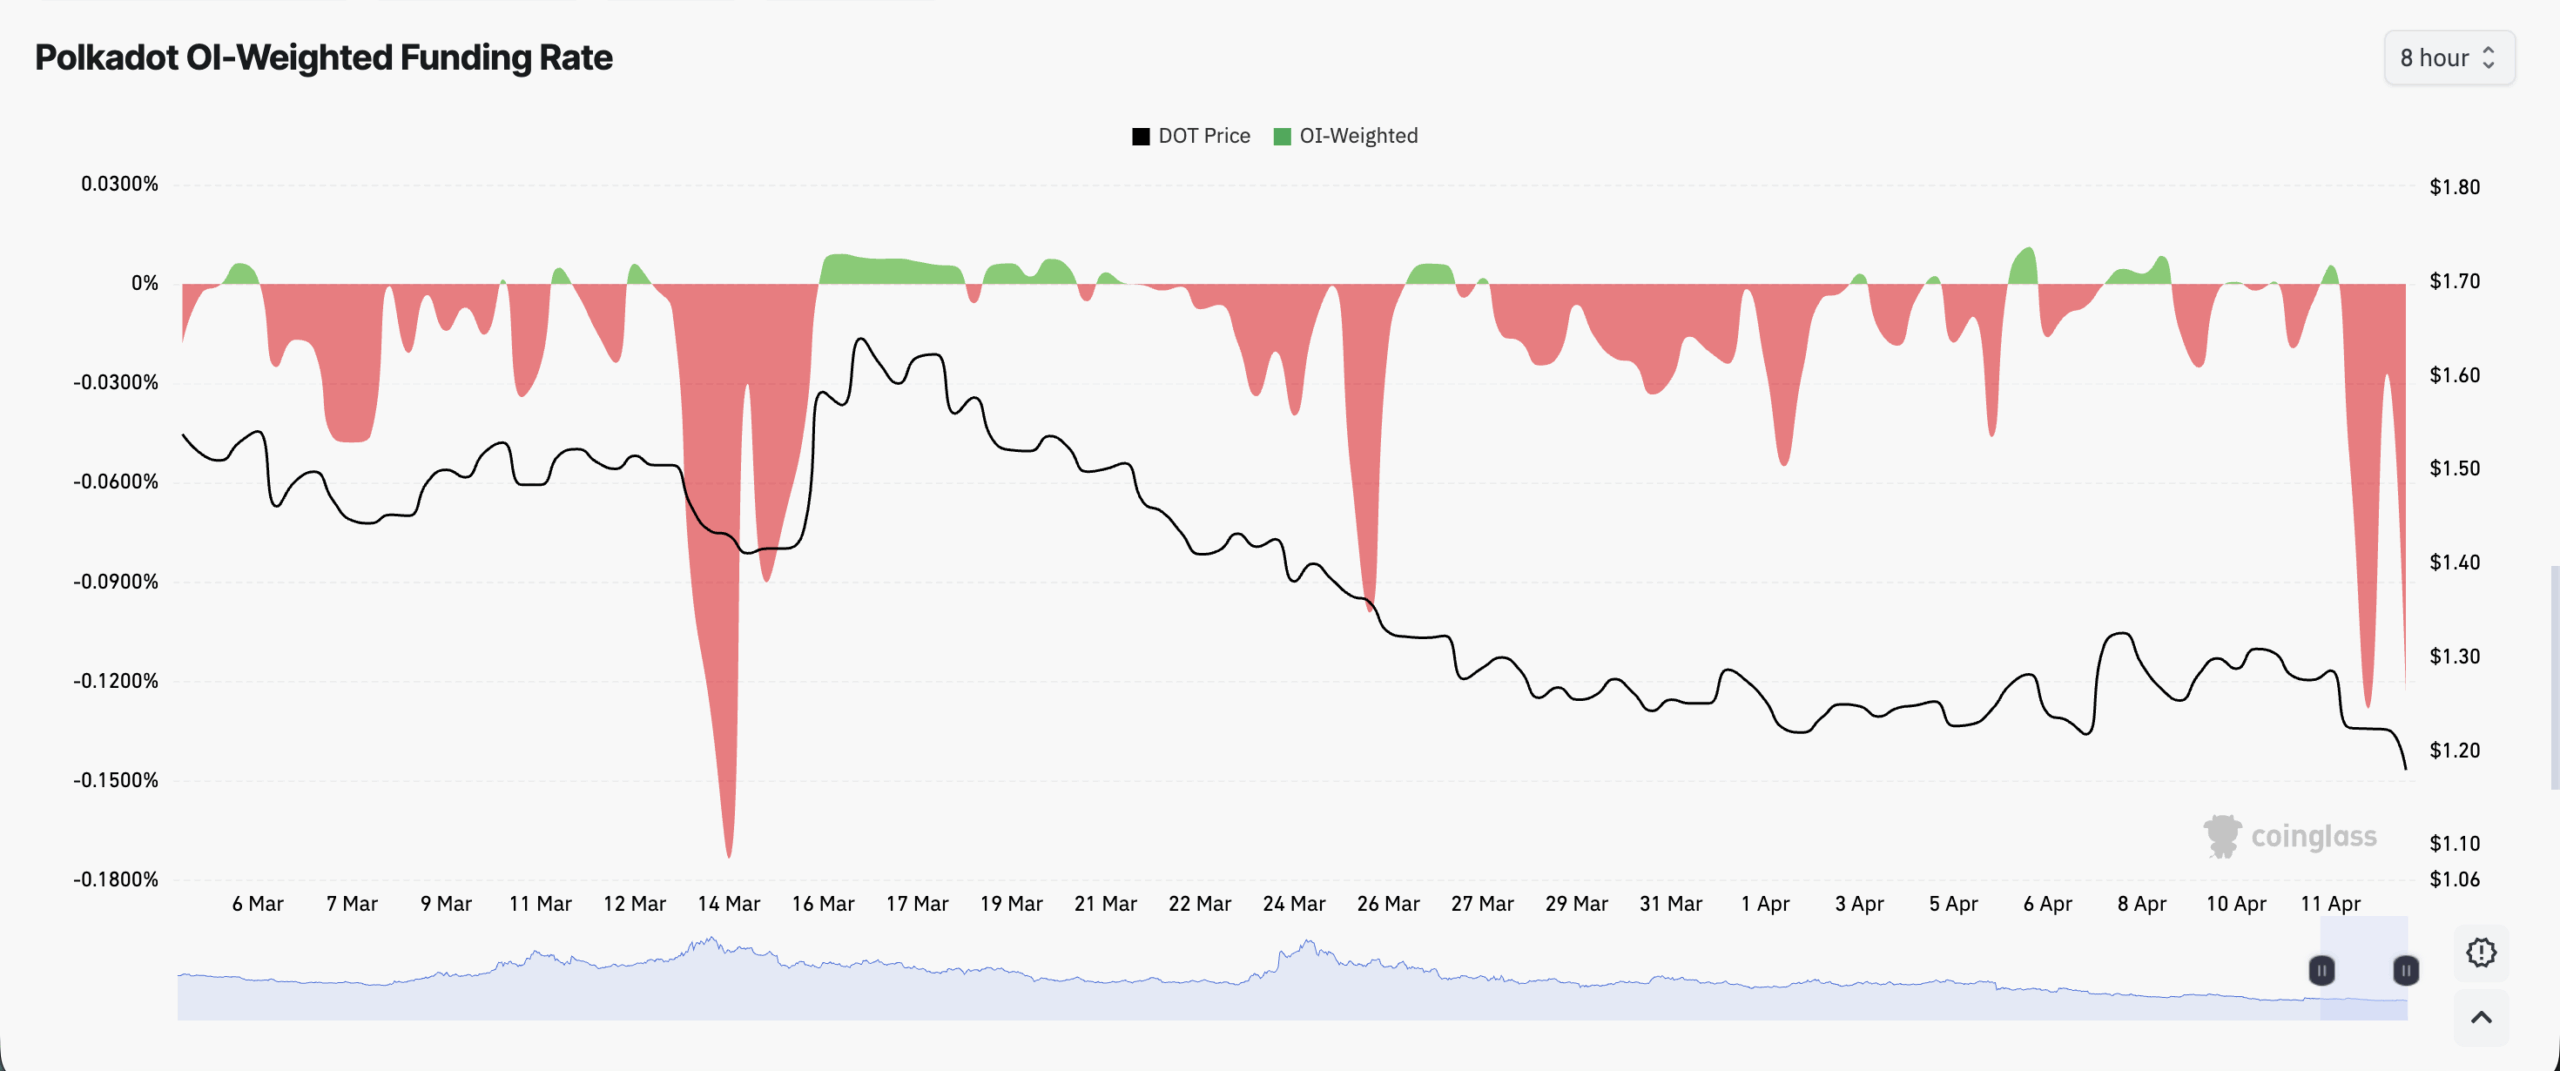
DOT’s funding rate, which has remained severely negative since early March, supports this bearish stance.
According to Coinglass, over the past month, the coin’s weighted funding rate has been predominantly negative, flipping to positive only a few times before falling back below zero. As of this writing, it sits at -0.1006%.
The funding rate is the periodic payment exchanged between long and short futures contract holders based on the difference between an asset’s spot price and futures price.
A persistently negative funding rate like DOT’s signals that short sellers are consistently willing to pay a premium to maintain their bearish bets.
This indicates that the coin’s derivatives market sentiment has been skewed to the downside well before today’s exploit. The exploit has only further dampened investor sentiment, increasing the risk of near-term price declines.
Sub-$1 DOT Remains on the Table as Bearish Momentum Builds
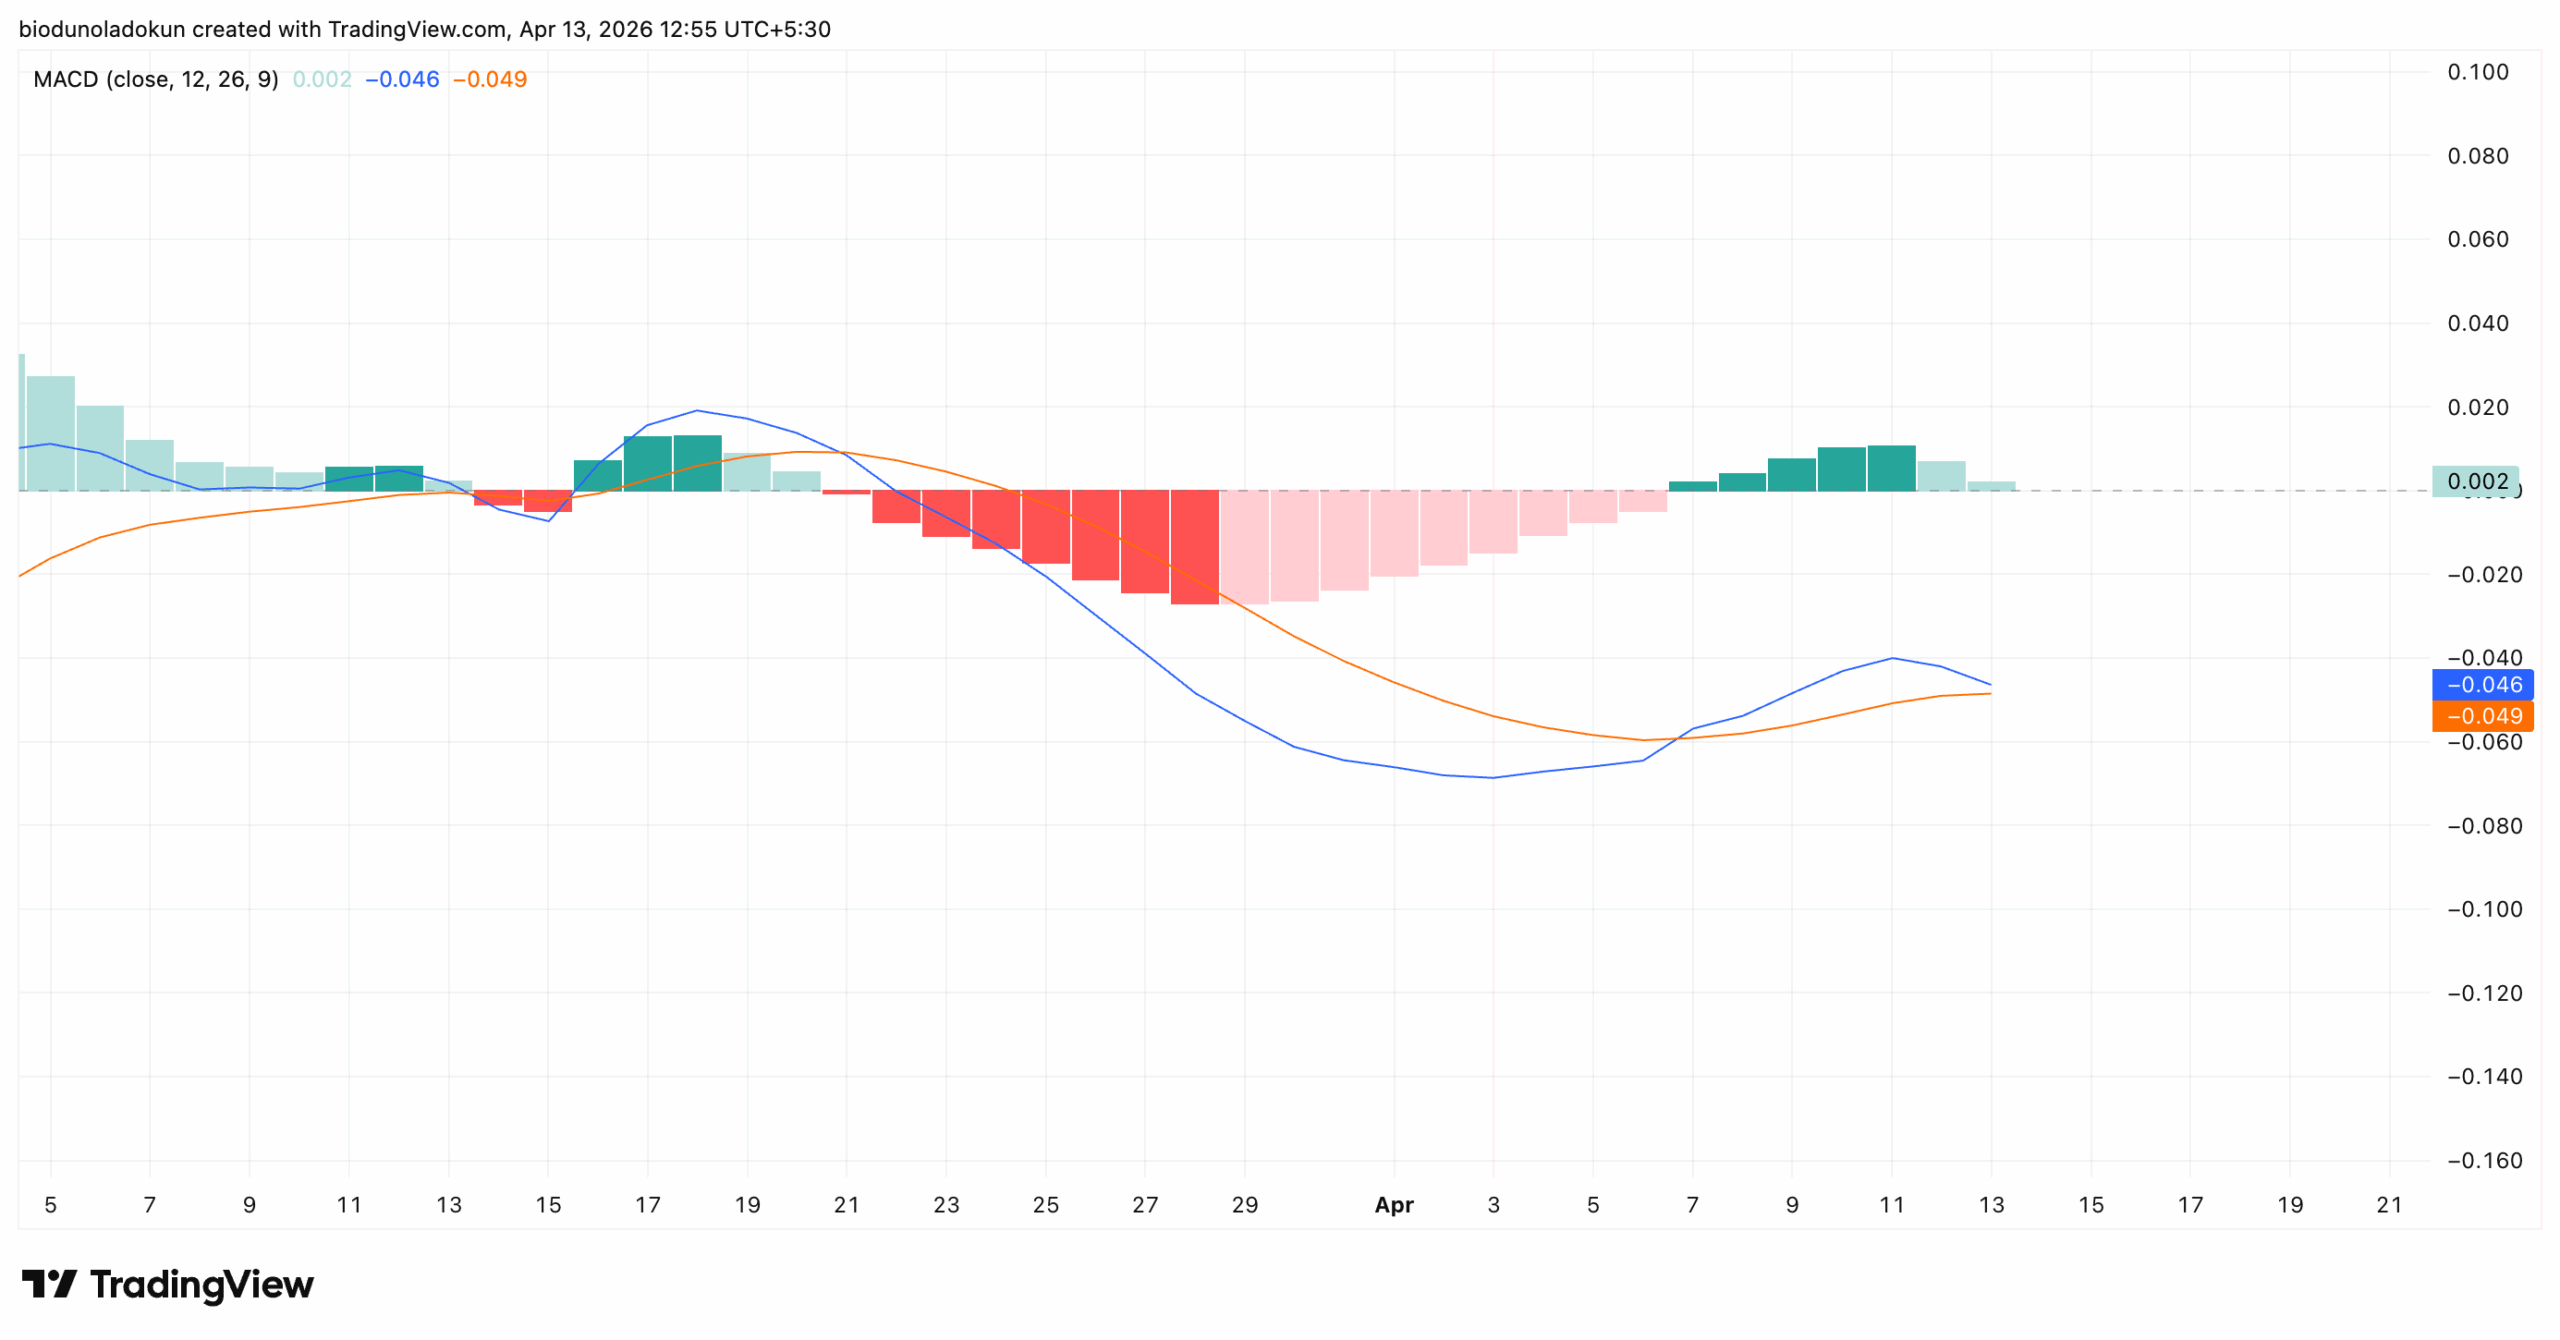
Readings from the DOT/USD daily chart indicate the coin’s Moving Average Convergence Divergence (MACD) is poised for a bearish crossover, suggesting deeper losses in the near term.
The MACD indicator identifies trends and momentum in an asset’s price movement, helping traders spot potential buy or sell signals through crossovers between the MACD and signal lines.
A bearish crossover occurs when the MACD line (blue) dips below the signal line (orange), indicating a weakening in bullish momentum and a possible shift toward downward price pressure.
At press time, DOT’s MACD line sits at -0.046, edging closer to the signal line at -0.049. A breach that, if completed, would confirm the bearish shift in momentum.
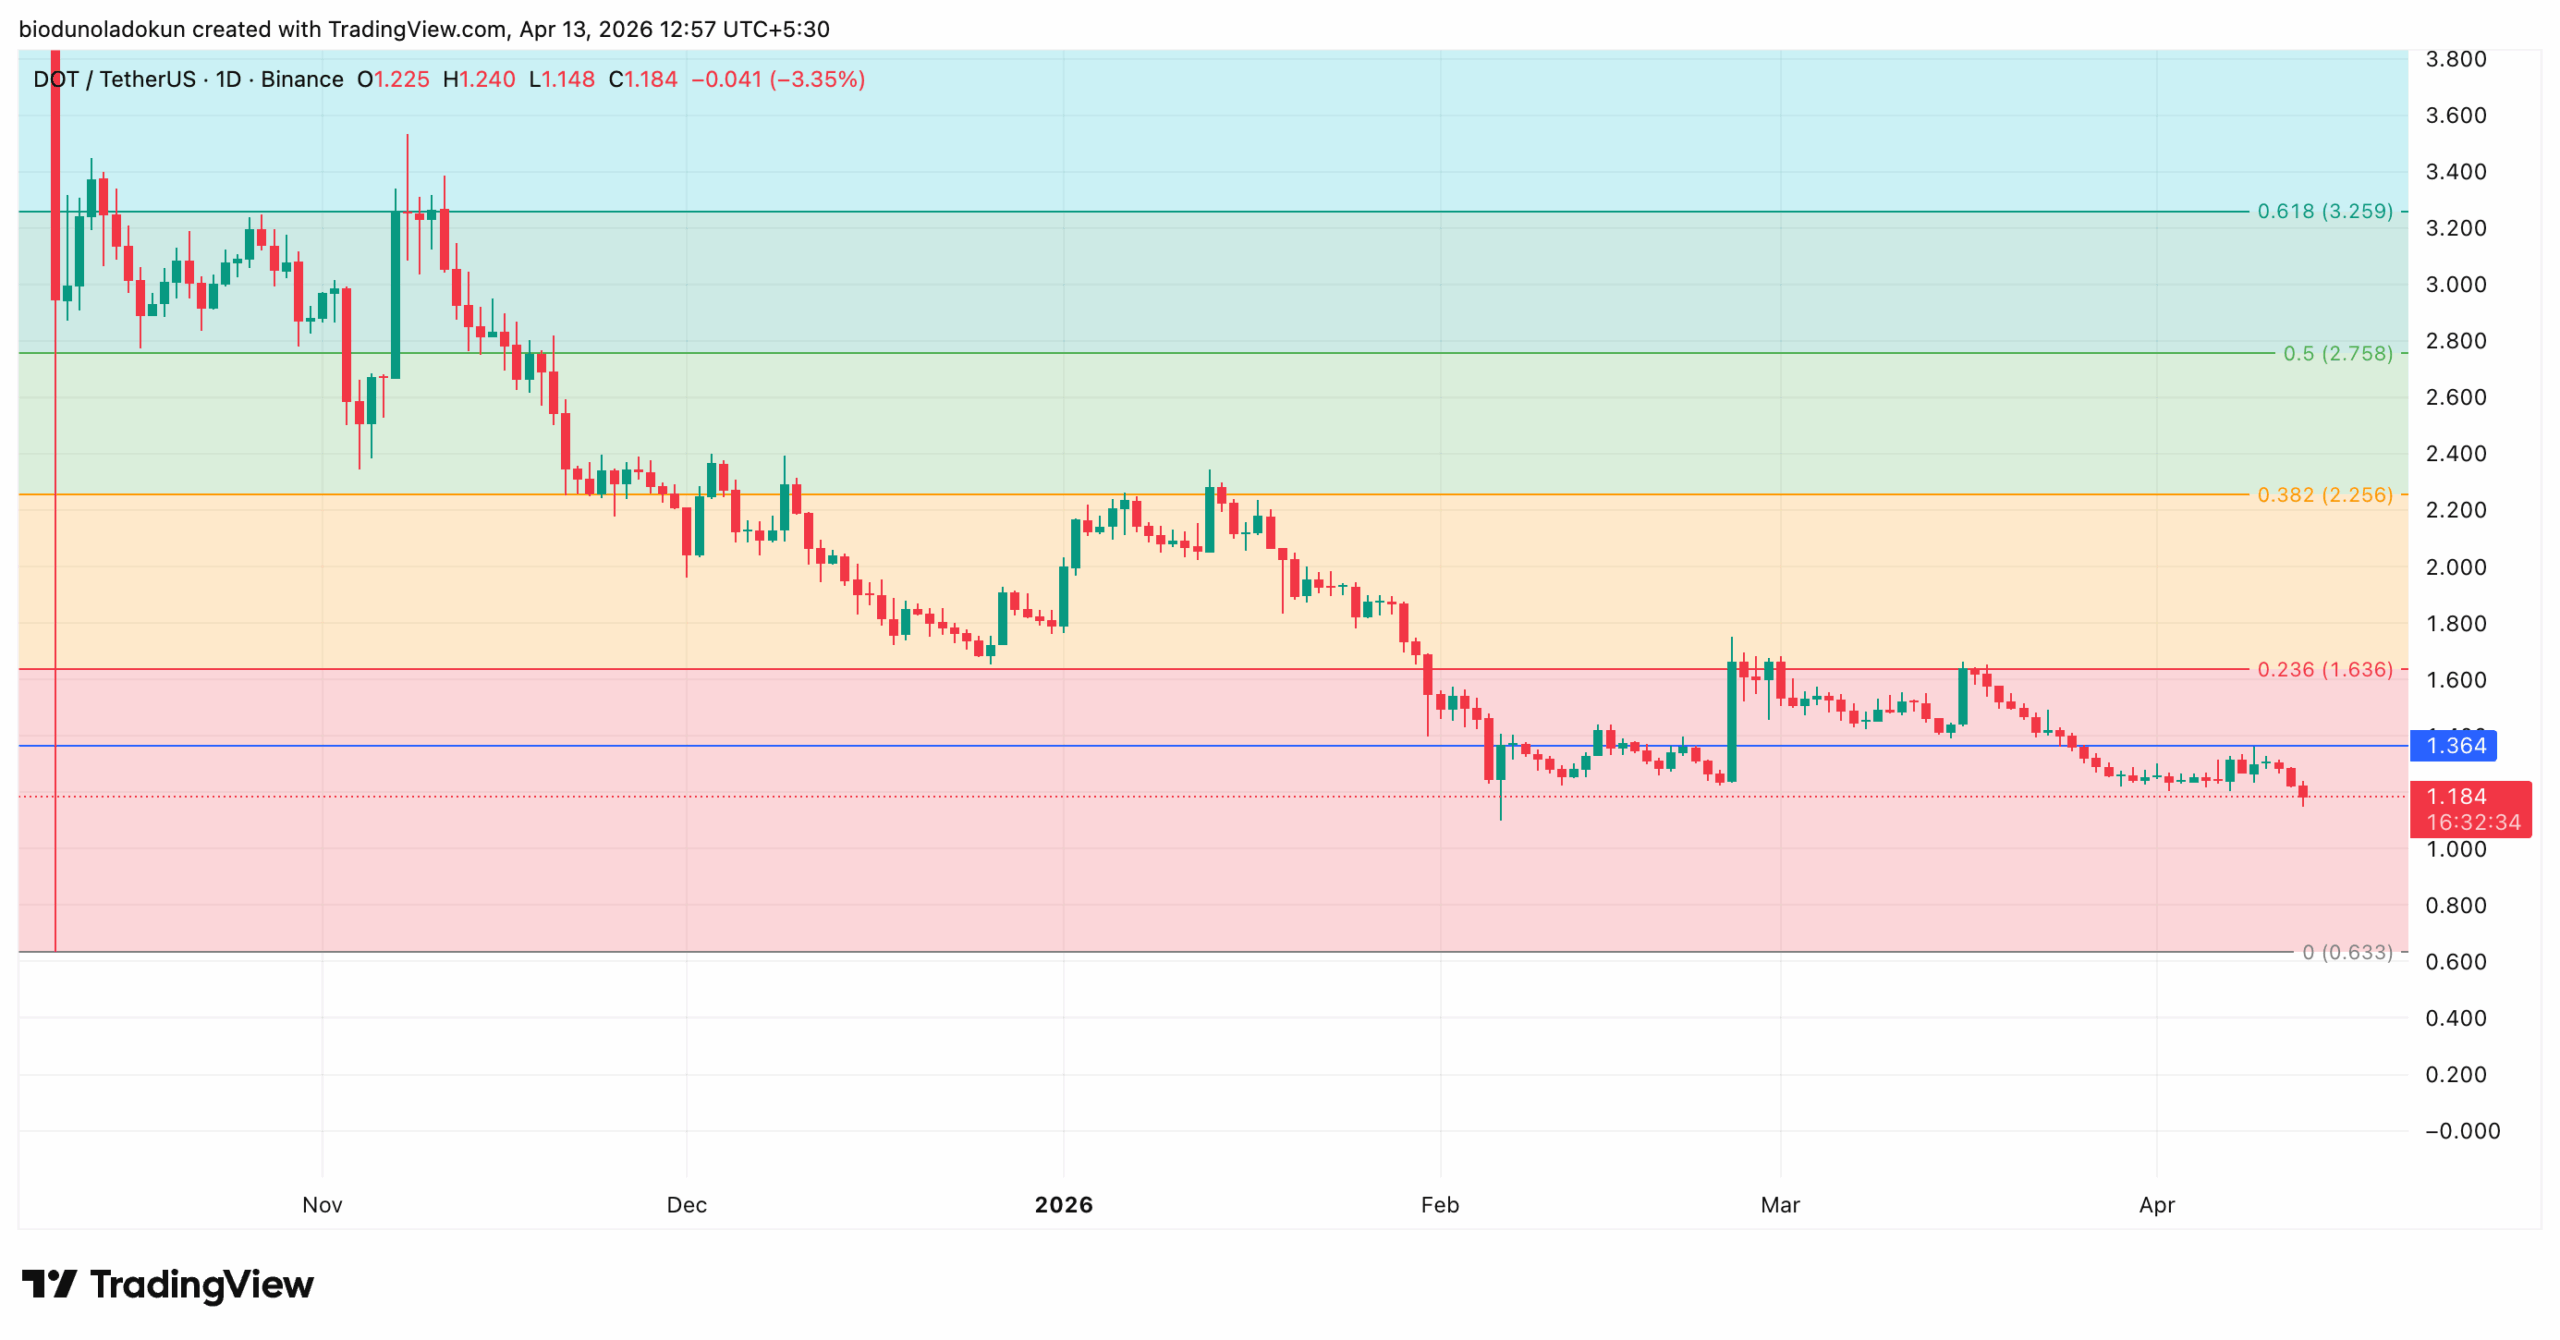
If buy-side pressure continues to weaken, DOT risks falling below the $1 psychological level. A break below $1 could lead to a decline toward the $0.63 Fibonacci retracement floor, a level last seen six months ago.
On the other hand, any recovery would first require DOT to rally past the $1.36 resistance level. A daily close above $1.36 could push the coin to $1.63.
However, buying pressure is likely to remain subdued until the Polkadot development team provides more information on the extent of the exploits and the status of network security.
Disclaimer:
The information provided in this article is for informational purposes only. It is not intended to be, nor should it be construed as, financial advice. We do not make any warranties regarding the completeness, reliability, or accuracy of this information. All investments involve risk, and past performance does not guarantee future results. We recommend consulting a financial advisor before making any investment decisions.
Abiodun Oladokun is a Research Analyst at CCN, where he covers cryptocurrency markets with a focus on on-chain analysis, technical assessments, and emerging trends across decentralized finance (DeFi), real-world assets (RWA), artificial intelligence (AI), decentralized physical infrastructure networks (DePIN), Layer 2s, and meme coins.
Prior to CCN, he served as a Senior On-Chain Analyst at BeInCrypto, producing market reports spanning diverse crypto sectors.
Before that, he conducted technical analysis and market assessments of various altcoins at AMBCrypto, where he also contributed long-form quarterly research papers on DeFi, NFTs, DAOs, and scaling architectures, leveraging on-chain platforms including Messari, Santiment, DefiLlama, and Dune Analytics.
He began his crypto career as a research analyst at SixthSense DAO, developing blockchain forensic tools to trace the history of stolen assets.
Abiodun is a lawyer called to the Nigerian Bar and the founder of Ilé Ijó, a Lagos-based electronic dance music collective.