XRP has overtaken BNB to become the fourth-largest cryptocurrency by market cap.
On-chain data shows XRP’s Estimated Leverage Ratio at a 30-day high and funding rates consistently positive since March 10, signalling growing bullish conviction in the derivatives market.
While XRP’s MACD has crossed above the zero line for the first time since January 26 and price holds above the 20-day EMA, the rally faces a critical test.
Ripple’s XRP has climbed back into the top four, overtaking BNB to become the fourth-largest cryptocurrency by market capitalization.
This follows the broader recovery in the crypto market, which has pushed the token’s price up by 2% over the past day.
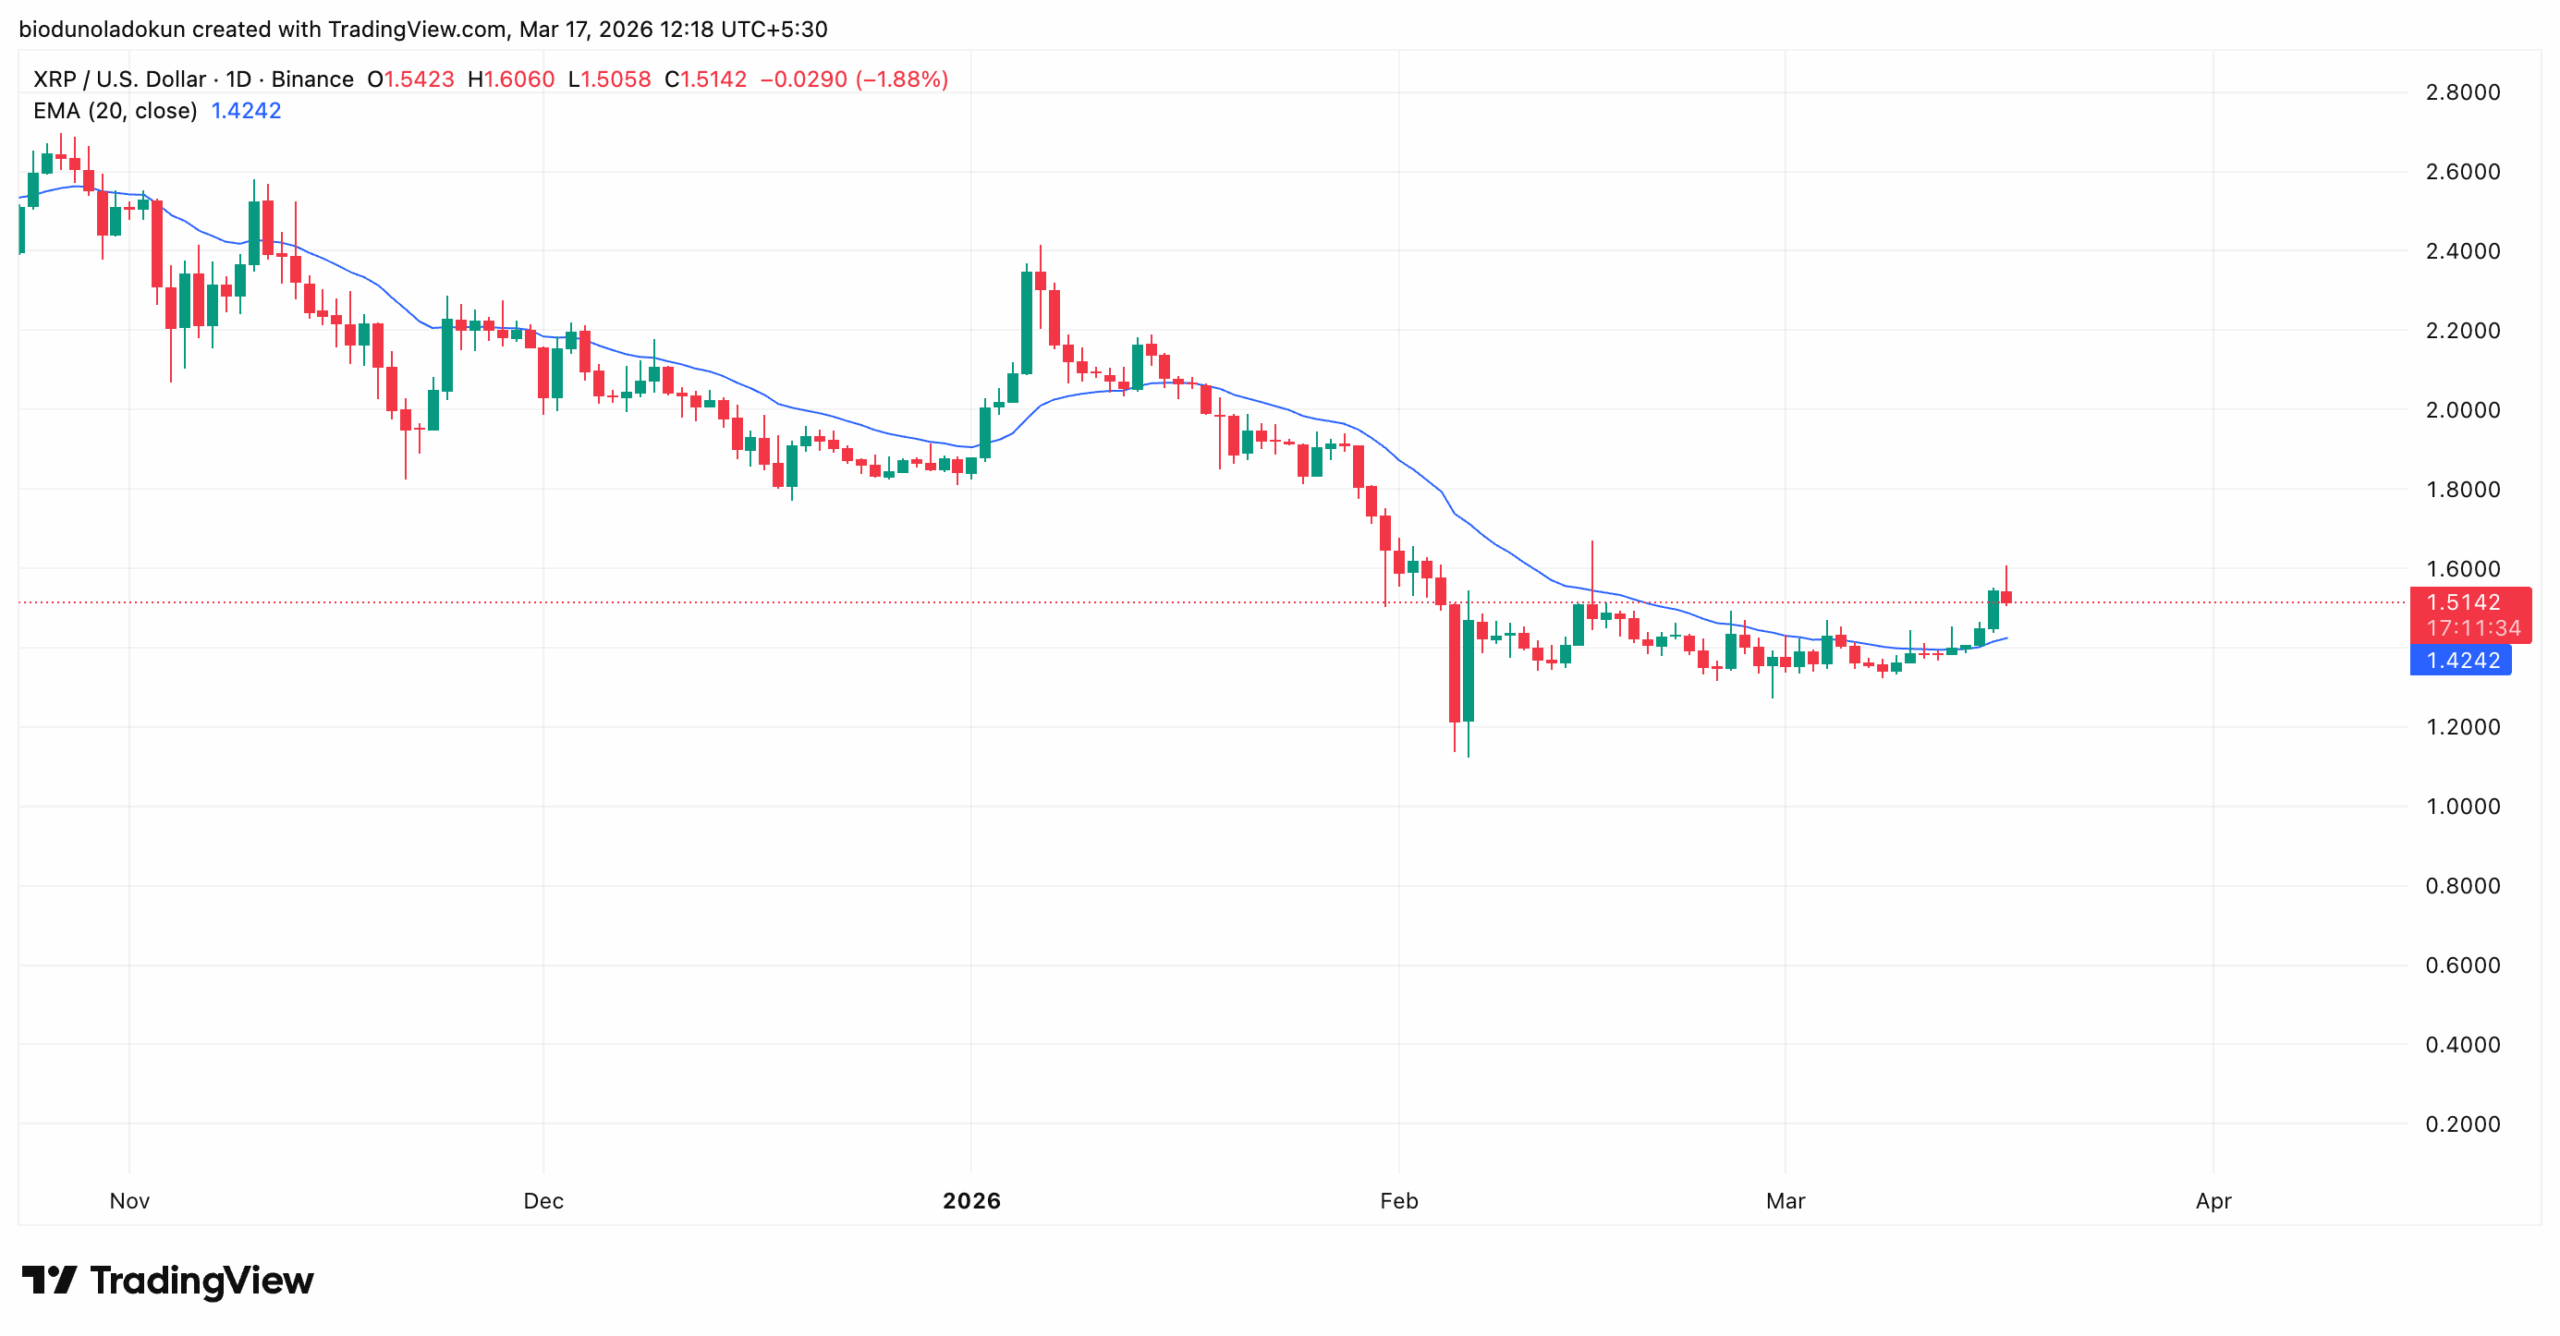
Amid surging daily trading volume, XRP briefly surged to a 29-day high during Tuesday’s early morning trading session before reversing slightly to trade below it at press time.
With on-chain signals confirming the gradual shift in market sentiment tilting toward the buy side, XRP may maintain its position above BNB in the meantime.
Leverage and Options Markets Signal Bullish Lean
One key metric confirming the resurgence in bullish sentiment among XRP holders is its climbing Estimated Leverage Ratio.
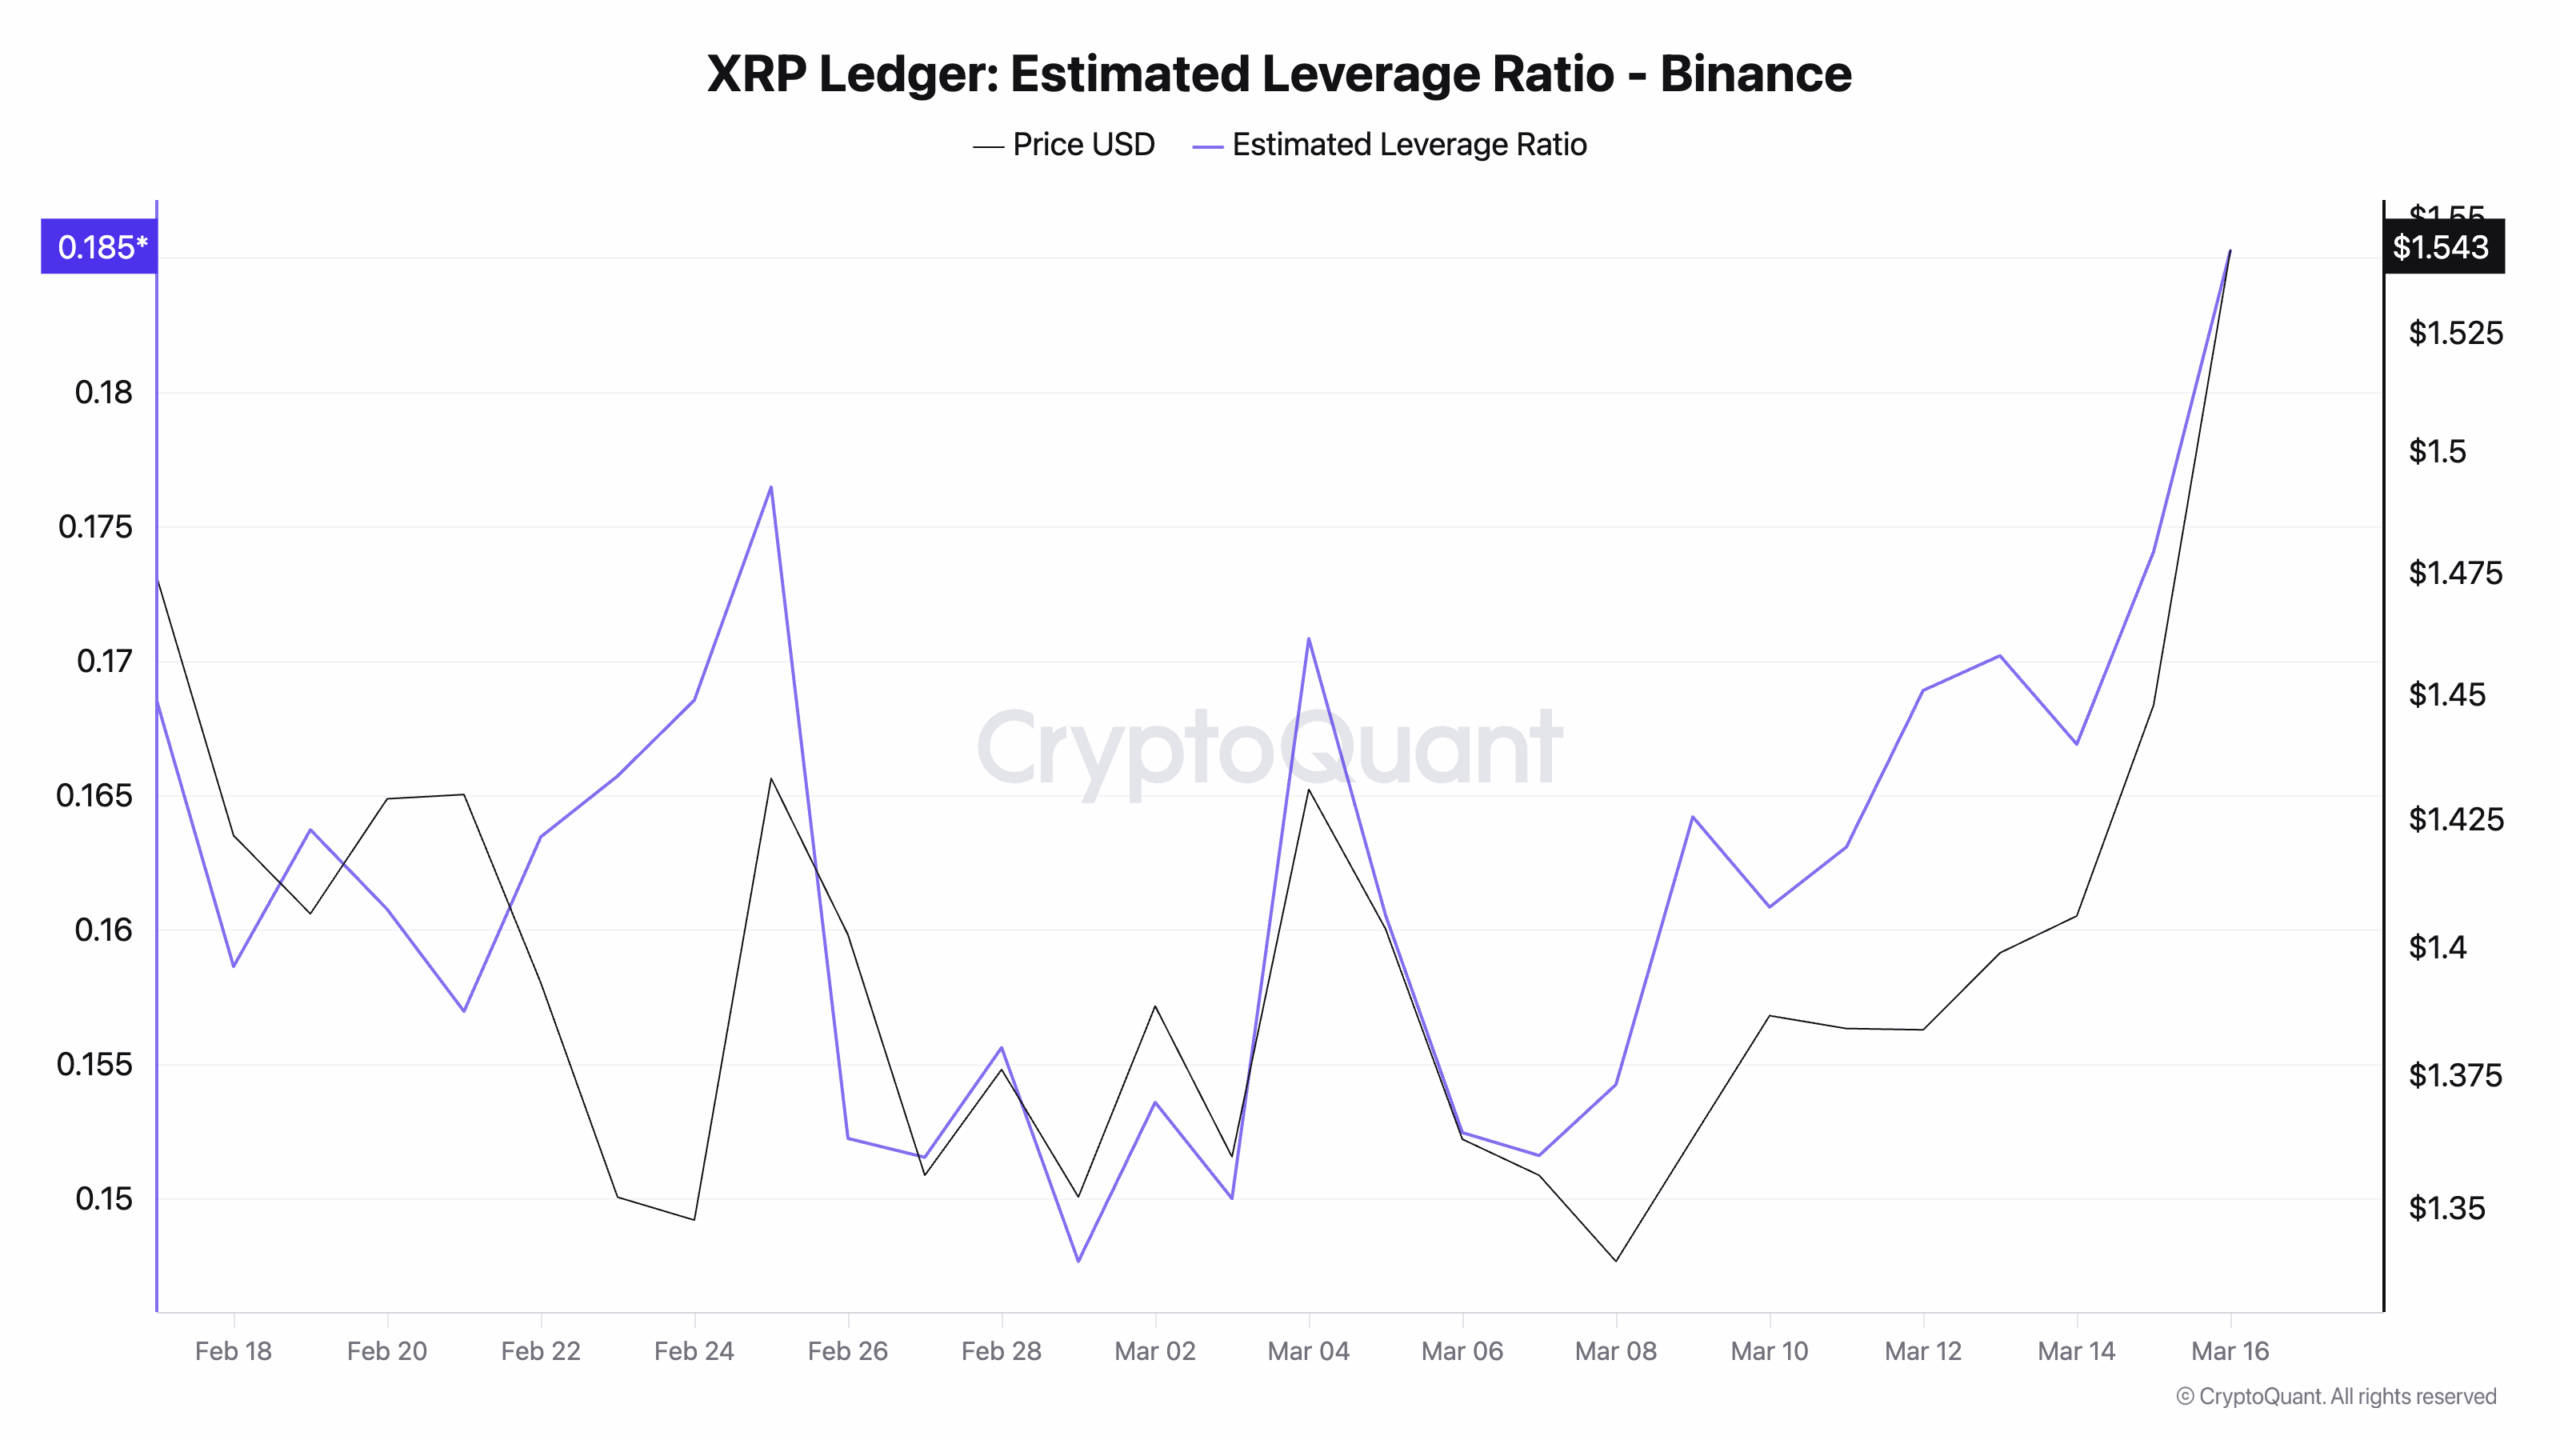
According to CryptoQuant, XRP’s Estimated Leverage Ratio (ELR) on Binance now sits at a 30-day high of 0.18.
The move means XRP’s derivatives traders are increasingly willing to take on exposure, signalling rising investor confidence and a stronger appetite for risk.
XRP Estimated Leverage Ratio | Credit: CryptoQuant
The ELR metric tracks the average leverage that an asset’s holders use to complete trades on a cryptocurrency exchange. It is calculated by dividing the asset’s open interest by the exchange’s reserve for that currency.
When it falls, it indicates a lack of risk appetite among traders. It shows that investors are becoming more cautious about the token’s near-term outlook and steering clear of high-leverage positions that could magnify losses.
On the other hand, a rising ELR, like XRP’s, indicates that traders are taking on larger leveraged positions, showing stronger conviction.
This trend signals growing market confidence among XRP holders. It hints at the potential for continued upward momentum as leveraged traders back the token’s short-term rally.
Long Bets Dominate
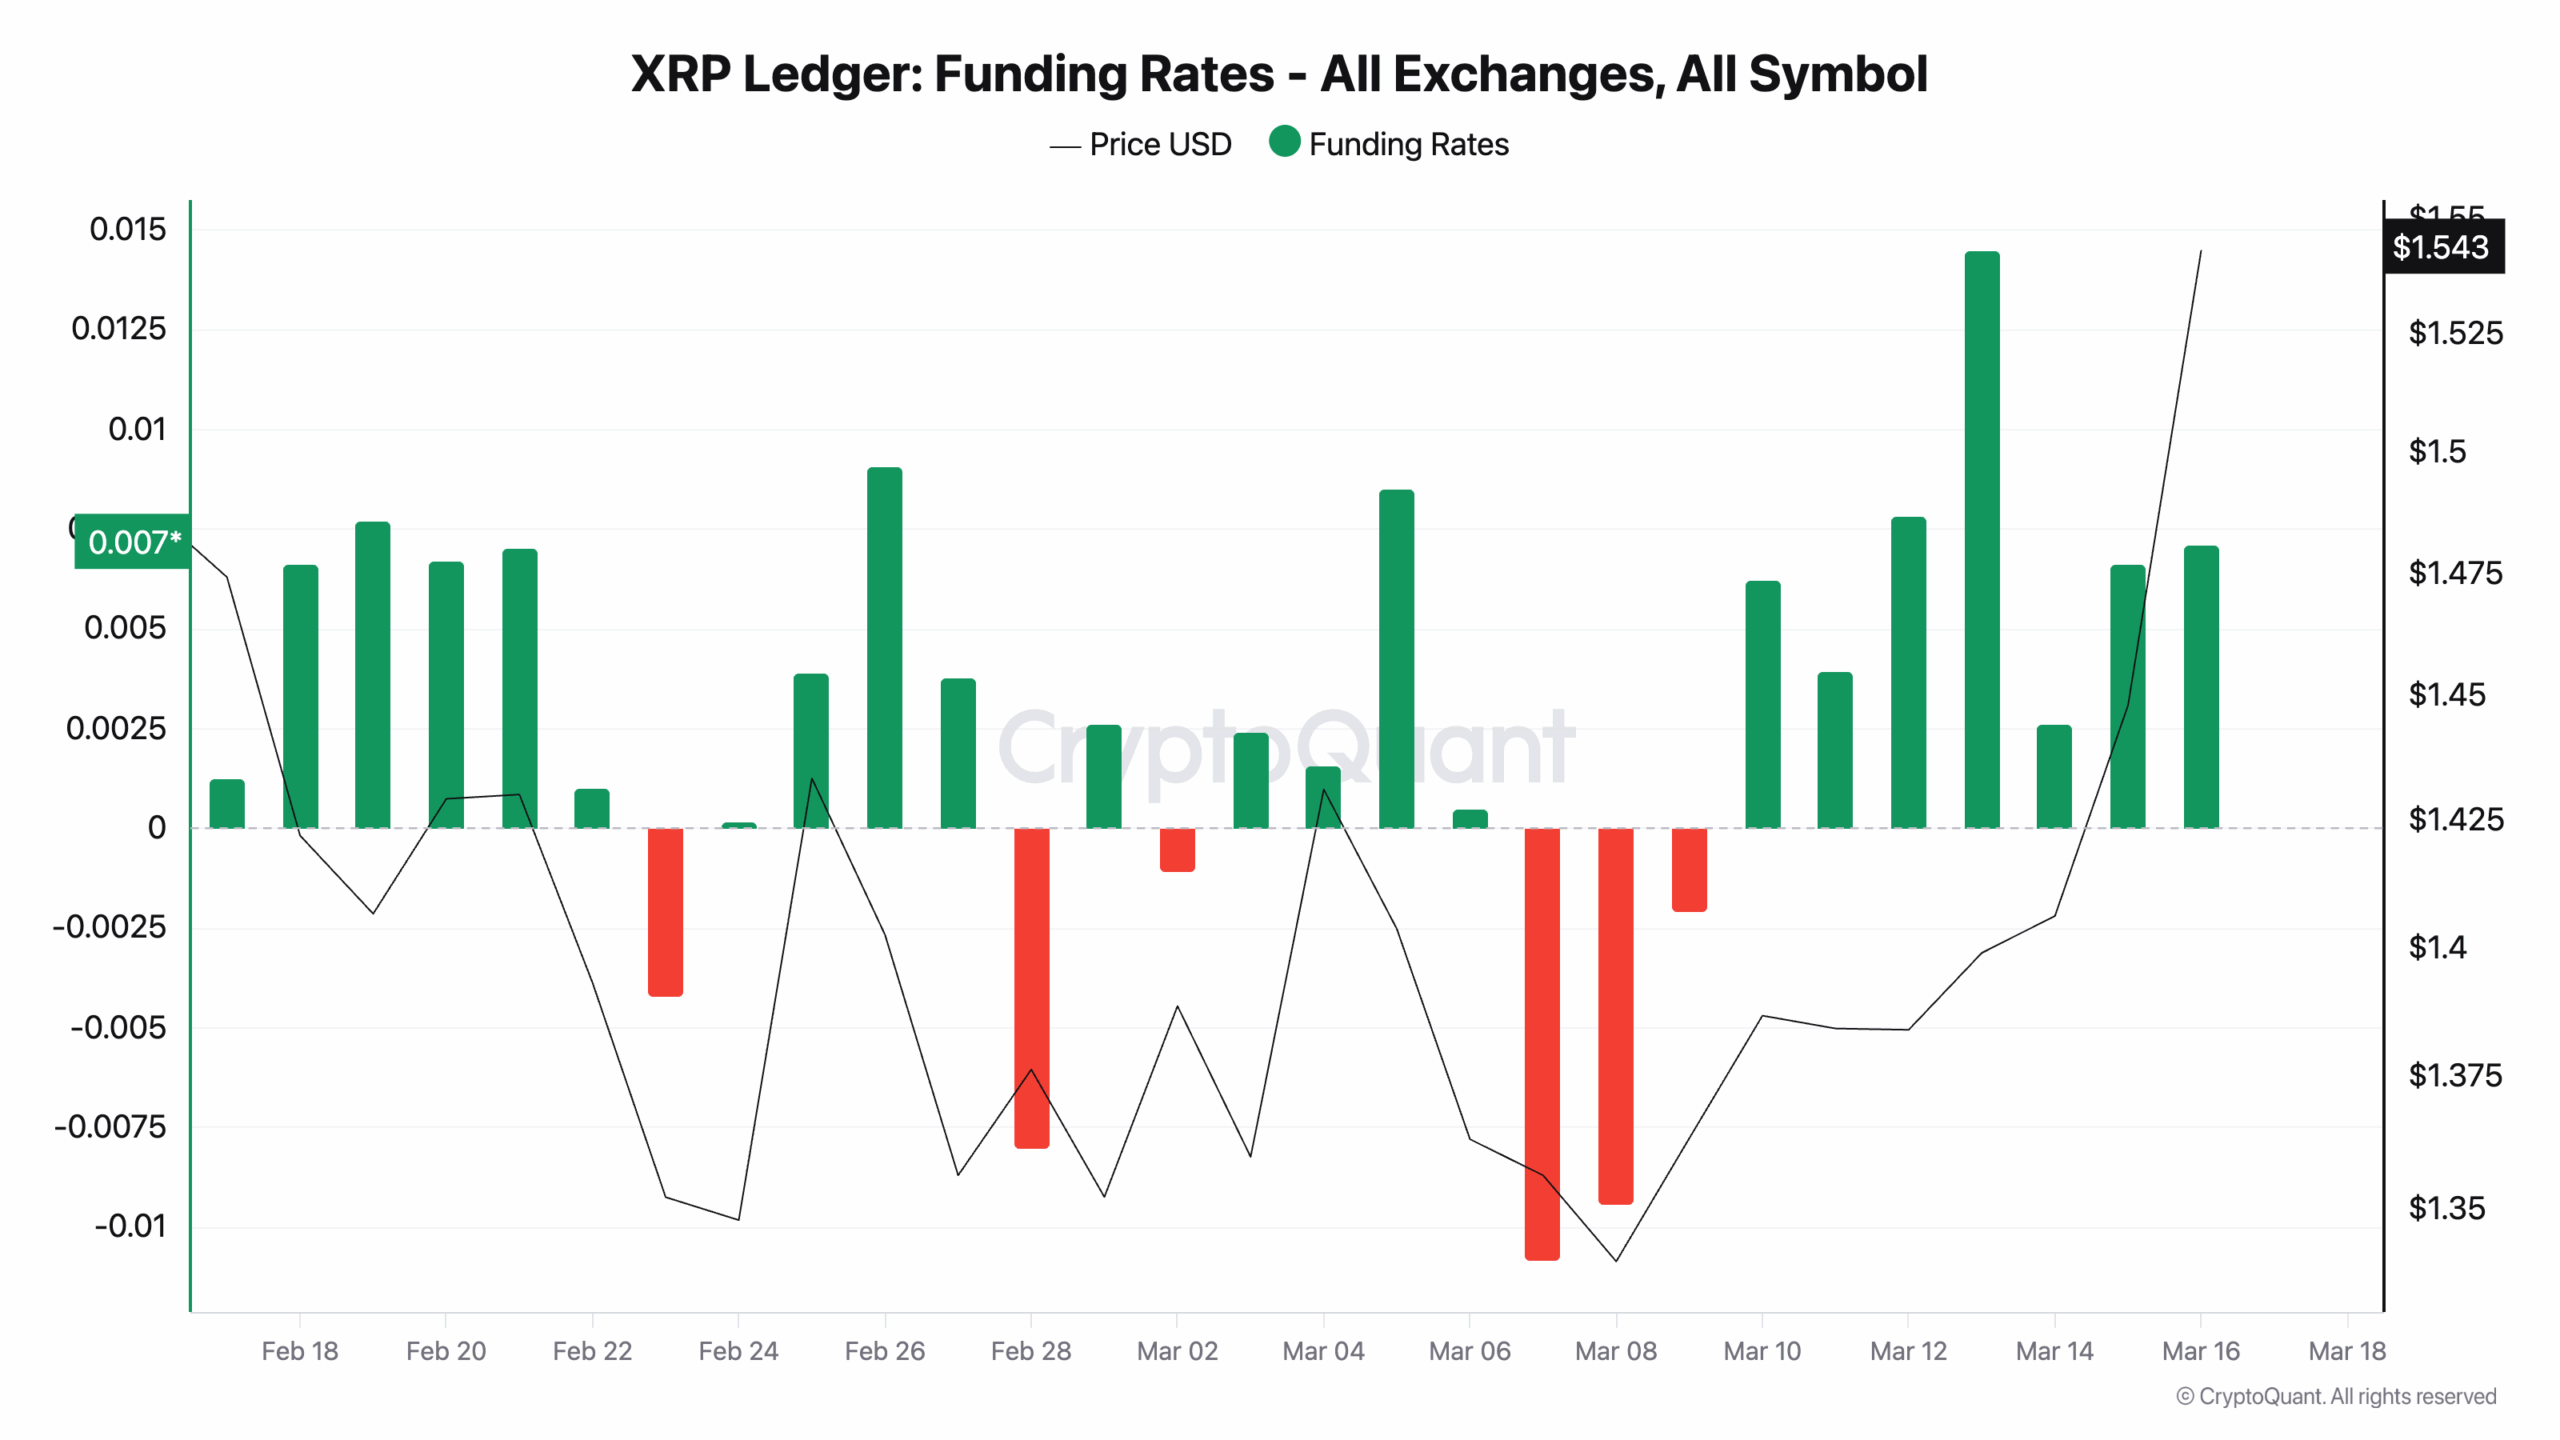
Furthermore, XRP’s consistent positive funding rate across all exchanges in the past week supports its price rally and confirms the growing bullish bias among traders. At press time, this sits at 0.007.
The funding rate is a periodic payment between traders in perpetual futures contracts to keep the contract price aligned with the spot price.
When the funding rate is positive, there is a higher demand for long positions. This means more traders are betting on XRP’s price rising.
For context, CryptoQuant’s data shows that XRP’s funding rate bottomed at -0.01 on March 7, as price struggled at a 30-day low of $1.34.
This indicated that short sellers were dominant, with traders paying a premium to maintain bearish positions.
However, XRP’s funding rates crossed back above zero on March 10 and have since remained positive.
This shift signals that long positions have taken control of the perpetual futures market, with bulls now paying the funding fee to maintain their exposure.
This transition in funding rate coincides almost exactly with XRP’s price recovery from the $1.35 low to the 29-day high it trades at as of this writing.
This suggests that the move upward has also been fuelled by genuine leveraged long demand, not just spot buying.
XRP Technical Indicators Align Bullishly
On the daily chart, XRP’s Moving Average Convergence Divergence (MACD) indicator is flashing a notable bullish signal.
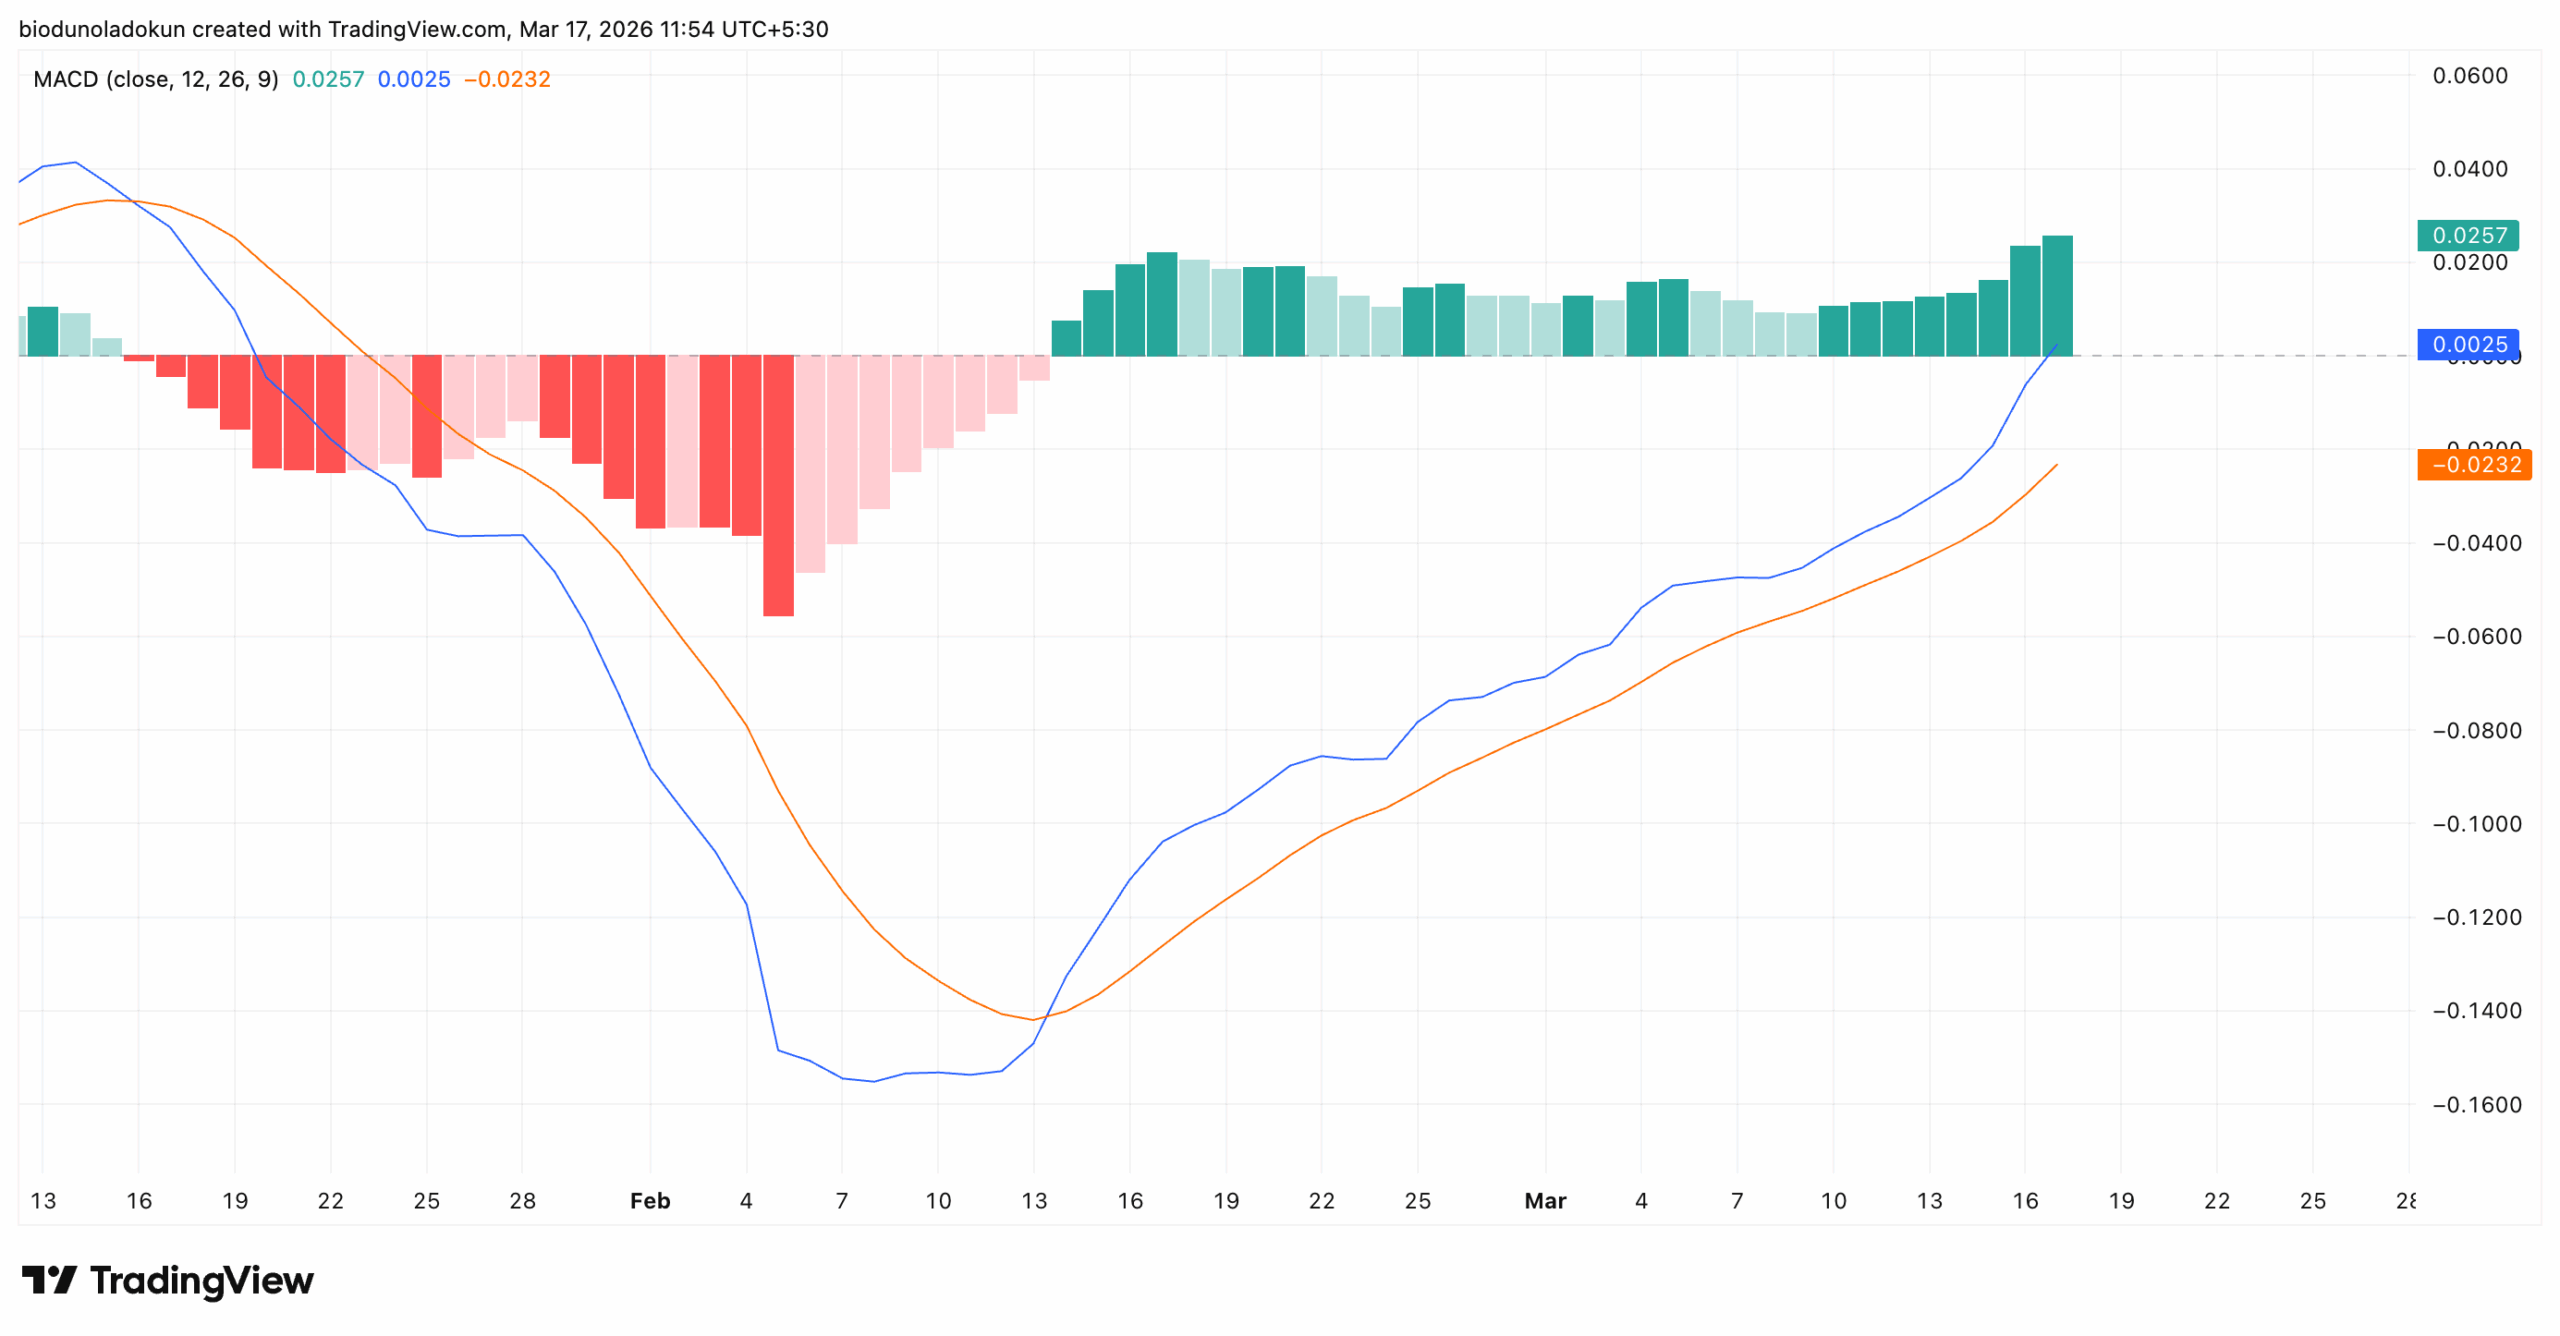
The MACD line (blue) is tracking above the signal line (orange) and has crossed above the zero line in today’s session for the first time since January 26.
The MACD is a momentum indicator that tracks the relationship between two moving averages of an asset’s price. It helps traders spot potential buy or sell signals through crossovers between the MACD and signal lines.
When the MACD line breaks above the zero line from below, it signals that short-term momentum has overtaken the longer-term average, a classic indication that bullish momentum is gaining ground.
The green histogram bars, which have been expanding since March 10, further confirm that the gap between the MACD and signal lines is widening in the bulls’ favor.
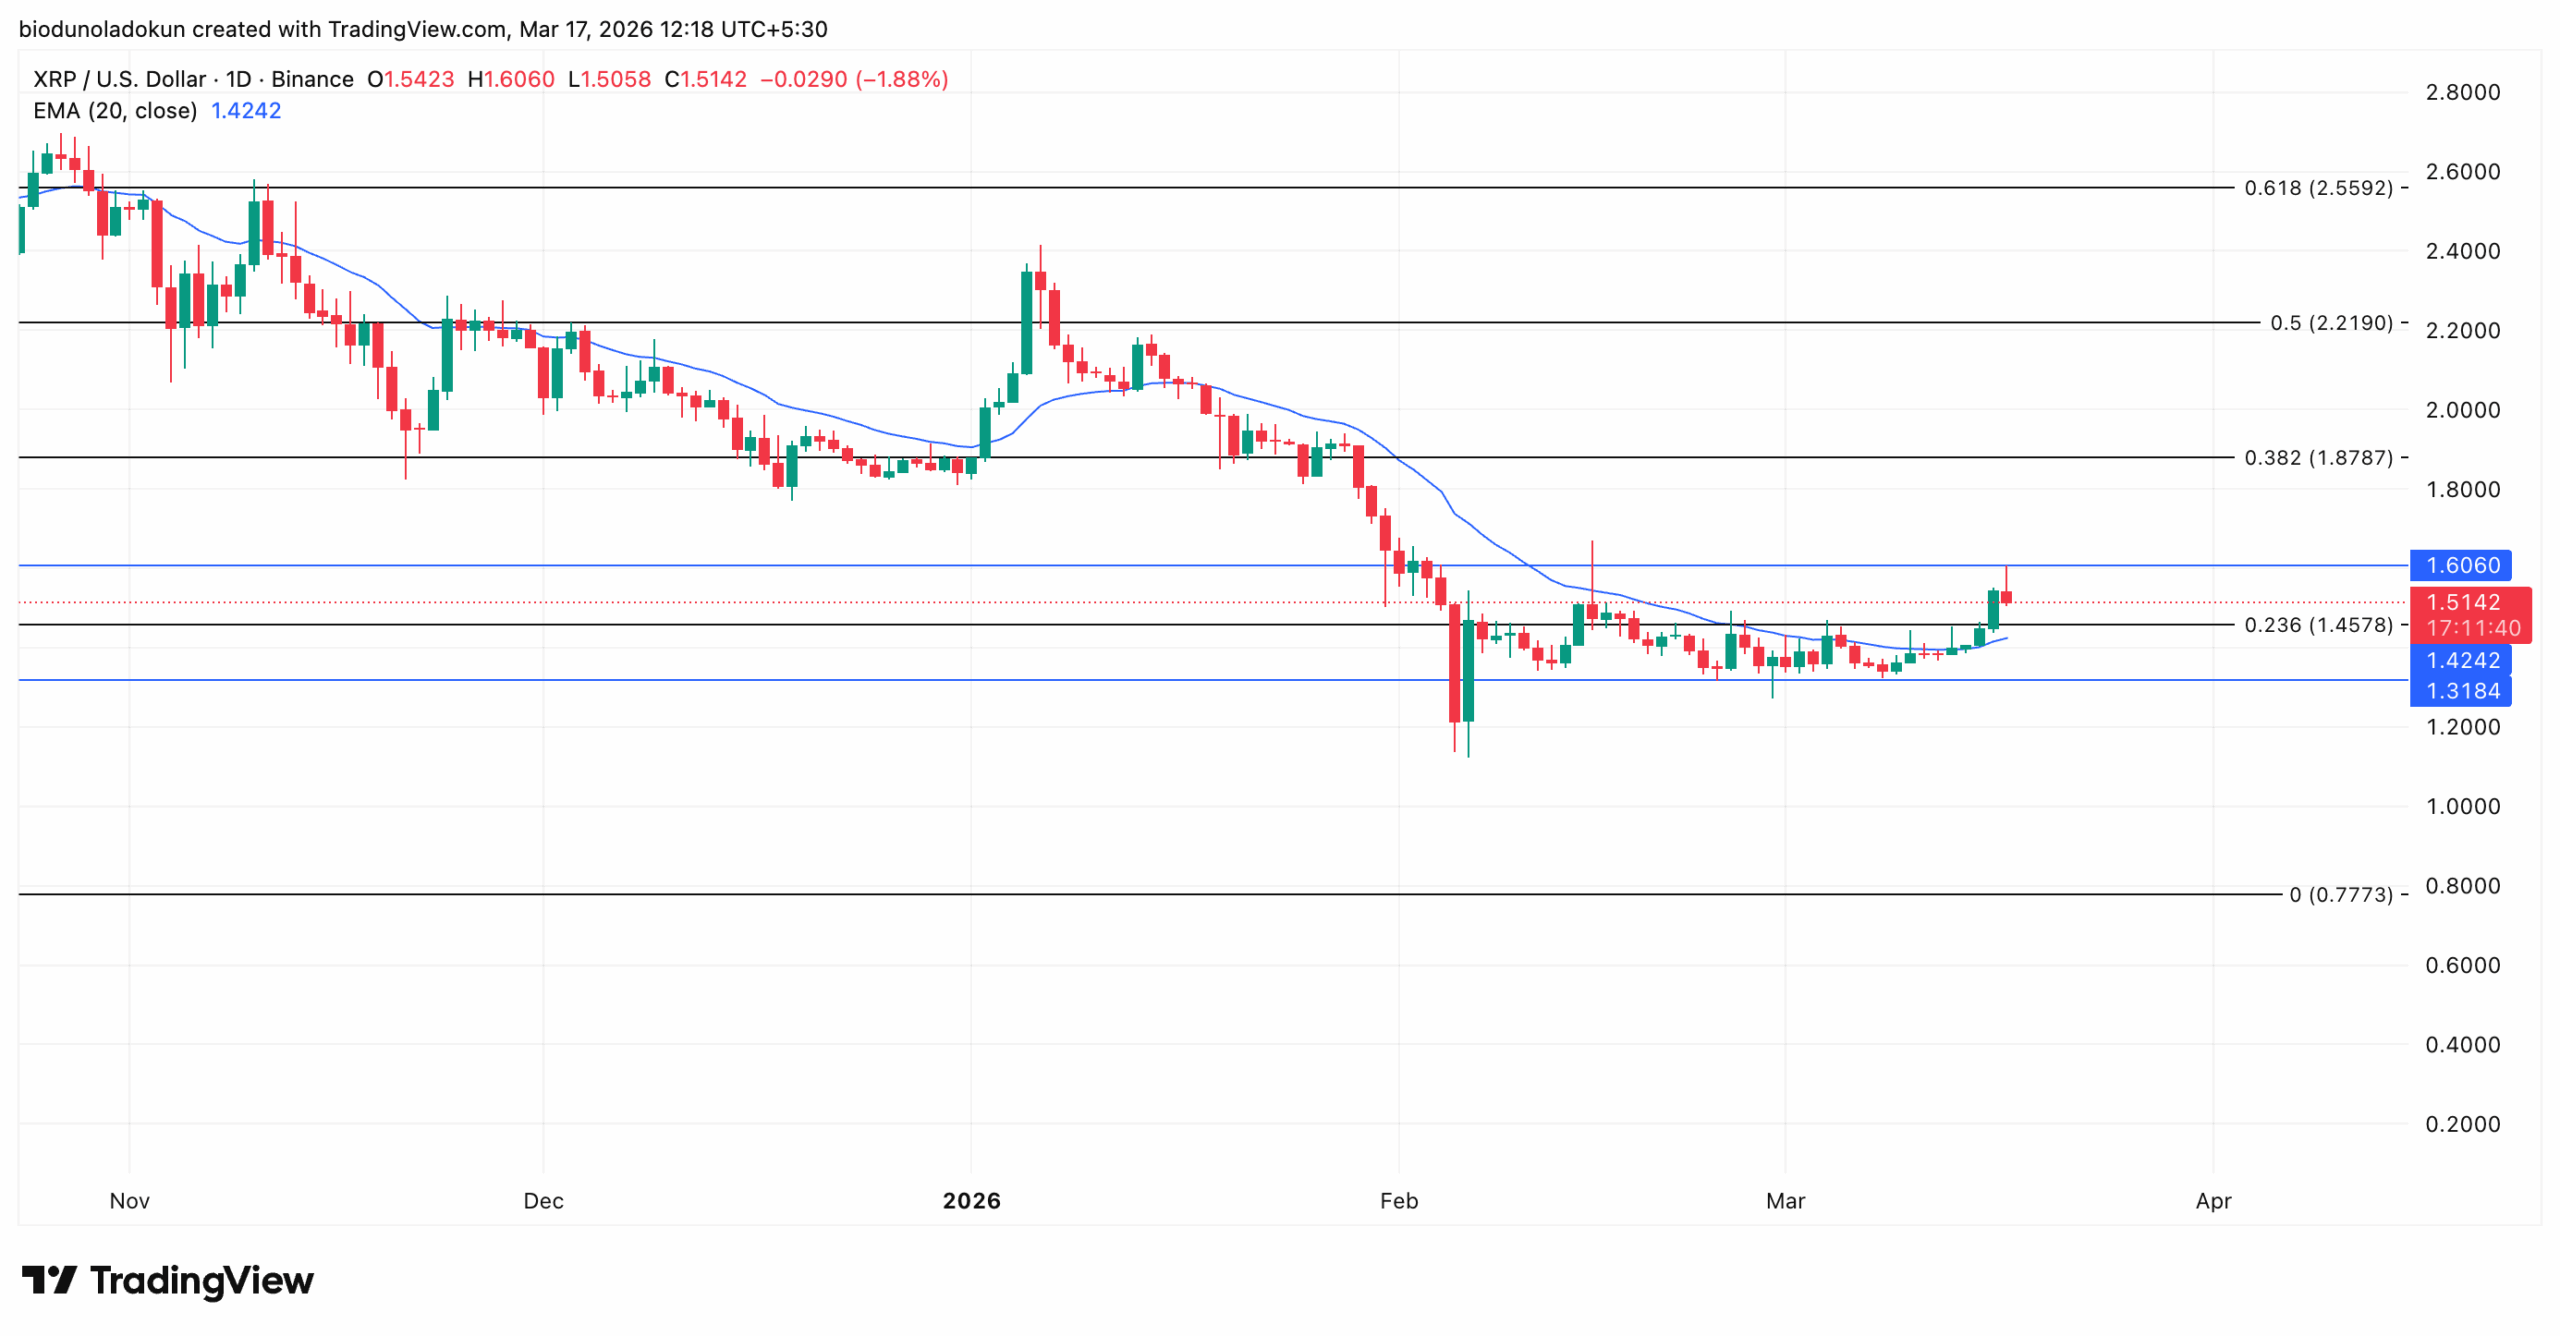
Moreover, XRP now holds above its 20-day Exponential Moving Average, supporting this bullish outlook.
However, if momentum stalls and XRP loses the $1.45 support line, the 20-day EMA becomes the last meaningful line of defense before a retest of $1.31.
[You-may-like]
Disclaimer:
The information provided in this article is for informational purposes only. It is not intended to be, nor should it be construed as, financial advice. We do not make any warranties regarding the completeness, reliability, or accuracy of this information. All investments involve risk, and past performance does not guarantee future results. We recommend consulting a financial advisor before making any investment decisions.
Abiodun Oladokun is a Research Analyst at CCN, where he covers cryptocurrency markets with a focus on on-chain analysis, technical assessments, and emerging trends across decentralized finance (DeFi), real-world assets (RWA), artificial intelligence (AI), decentralized physical infrastructure networks (DePIN), Layer 2s, and meme coins.
Prior to CCN, he served as a Senior On-Chain Analyst at BeInCrypto, producing market reports spanning diverse crypto sectors.
Before that, he conducted technical analysis and market assessments of various altcoins at AMBCrypto, where he also contributed long-form quarterly research papers on DeFi, NFTs, DAOs, and scaling architectures, leveraging on-chain platforms including Messari, Santiment, DefiLlama, and Dune Analytics.
He began his crypto career as a research analyst at SixthSense DAO, developing blockchain forensic tools to trace the history of stolen assets.
Abiodun is a lawyer called to the Nigerian Bar and the founder of Ilé Ijó, a Lagos-based electronic dance music collective.