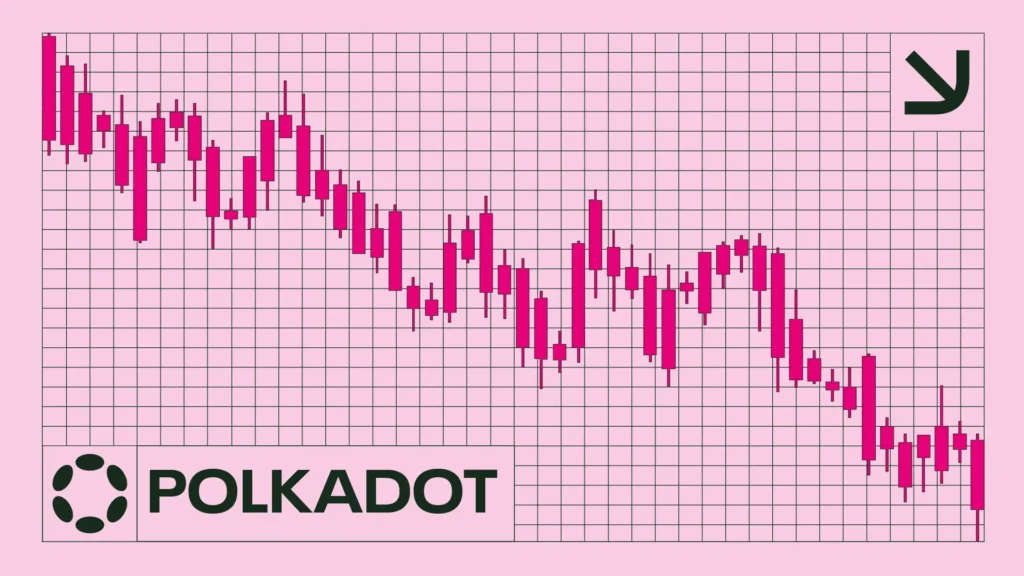
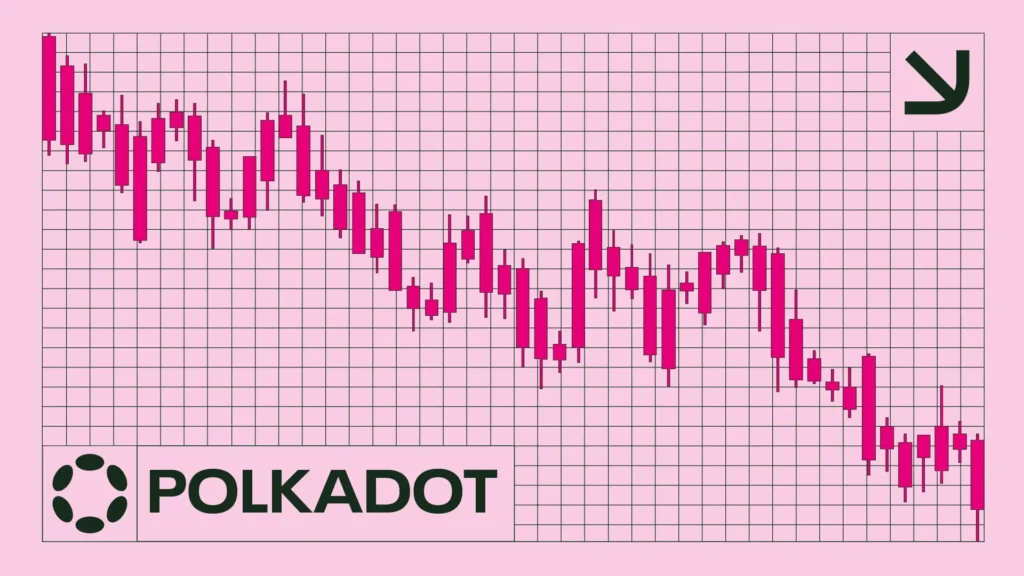
Here is what could lie ahead for DOT | Credit: Hamem Sarwar
Share
Key Takeaways
DOT remains in a strong bearish structure, with persistent lower highs and lower lows.
Price is consolidating between $1.20 and $1.34 as indicators show a possible breakdown.
Selling pressure is easing, yet inflows into DOT remain weak, leaving the downtrend intact.
Polkadot (DOT) is sliding again, and this time, the pressure is building fast. Sellers remain firmly in control, pushing price deeper into a sustained downtrend.
However, despite repeated attempts to stabilize, bulls continue to lose ground. As a result, Polkadot’s price is at risk of an extended leg down
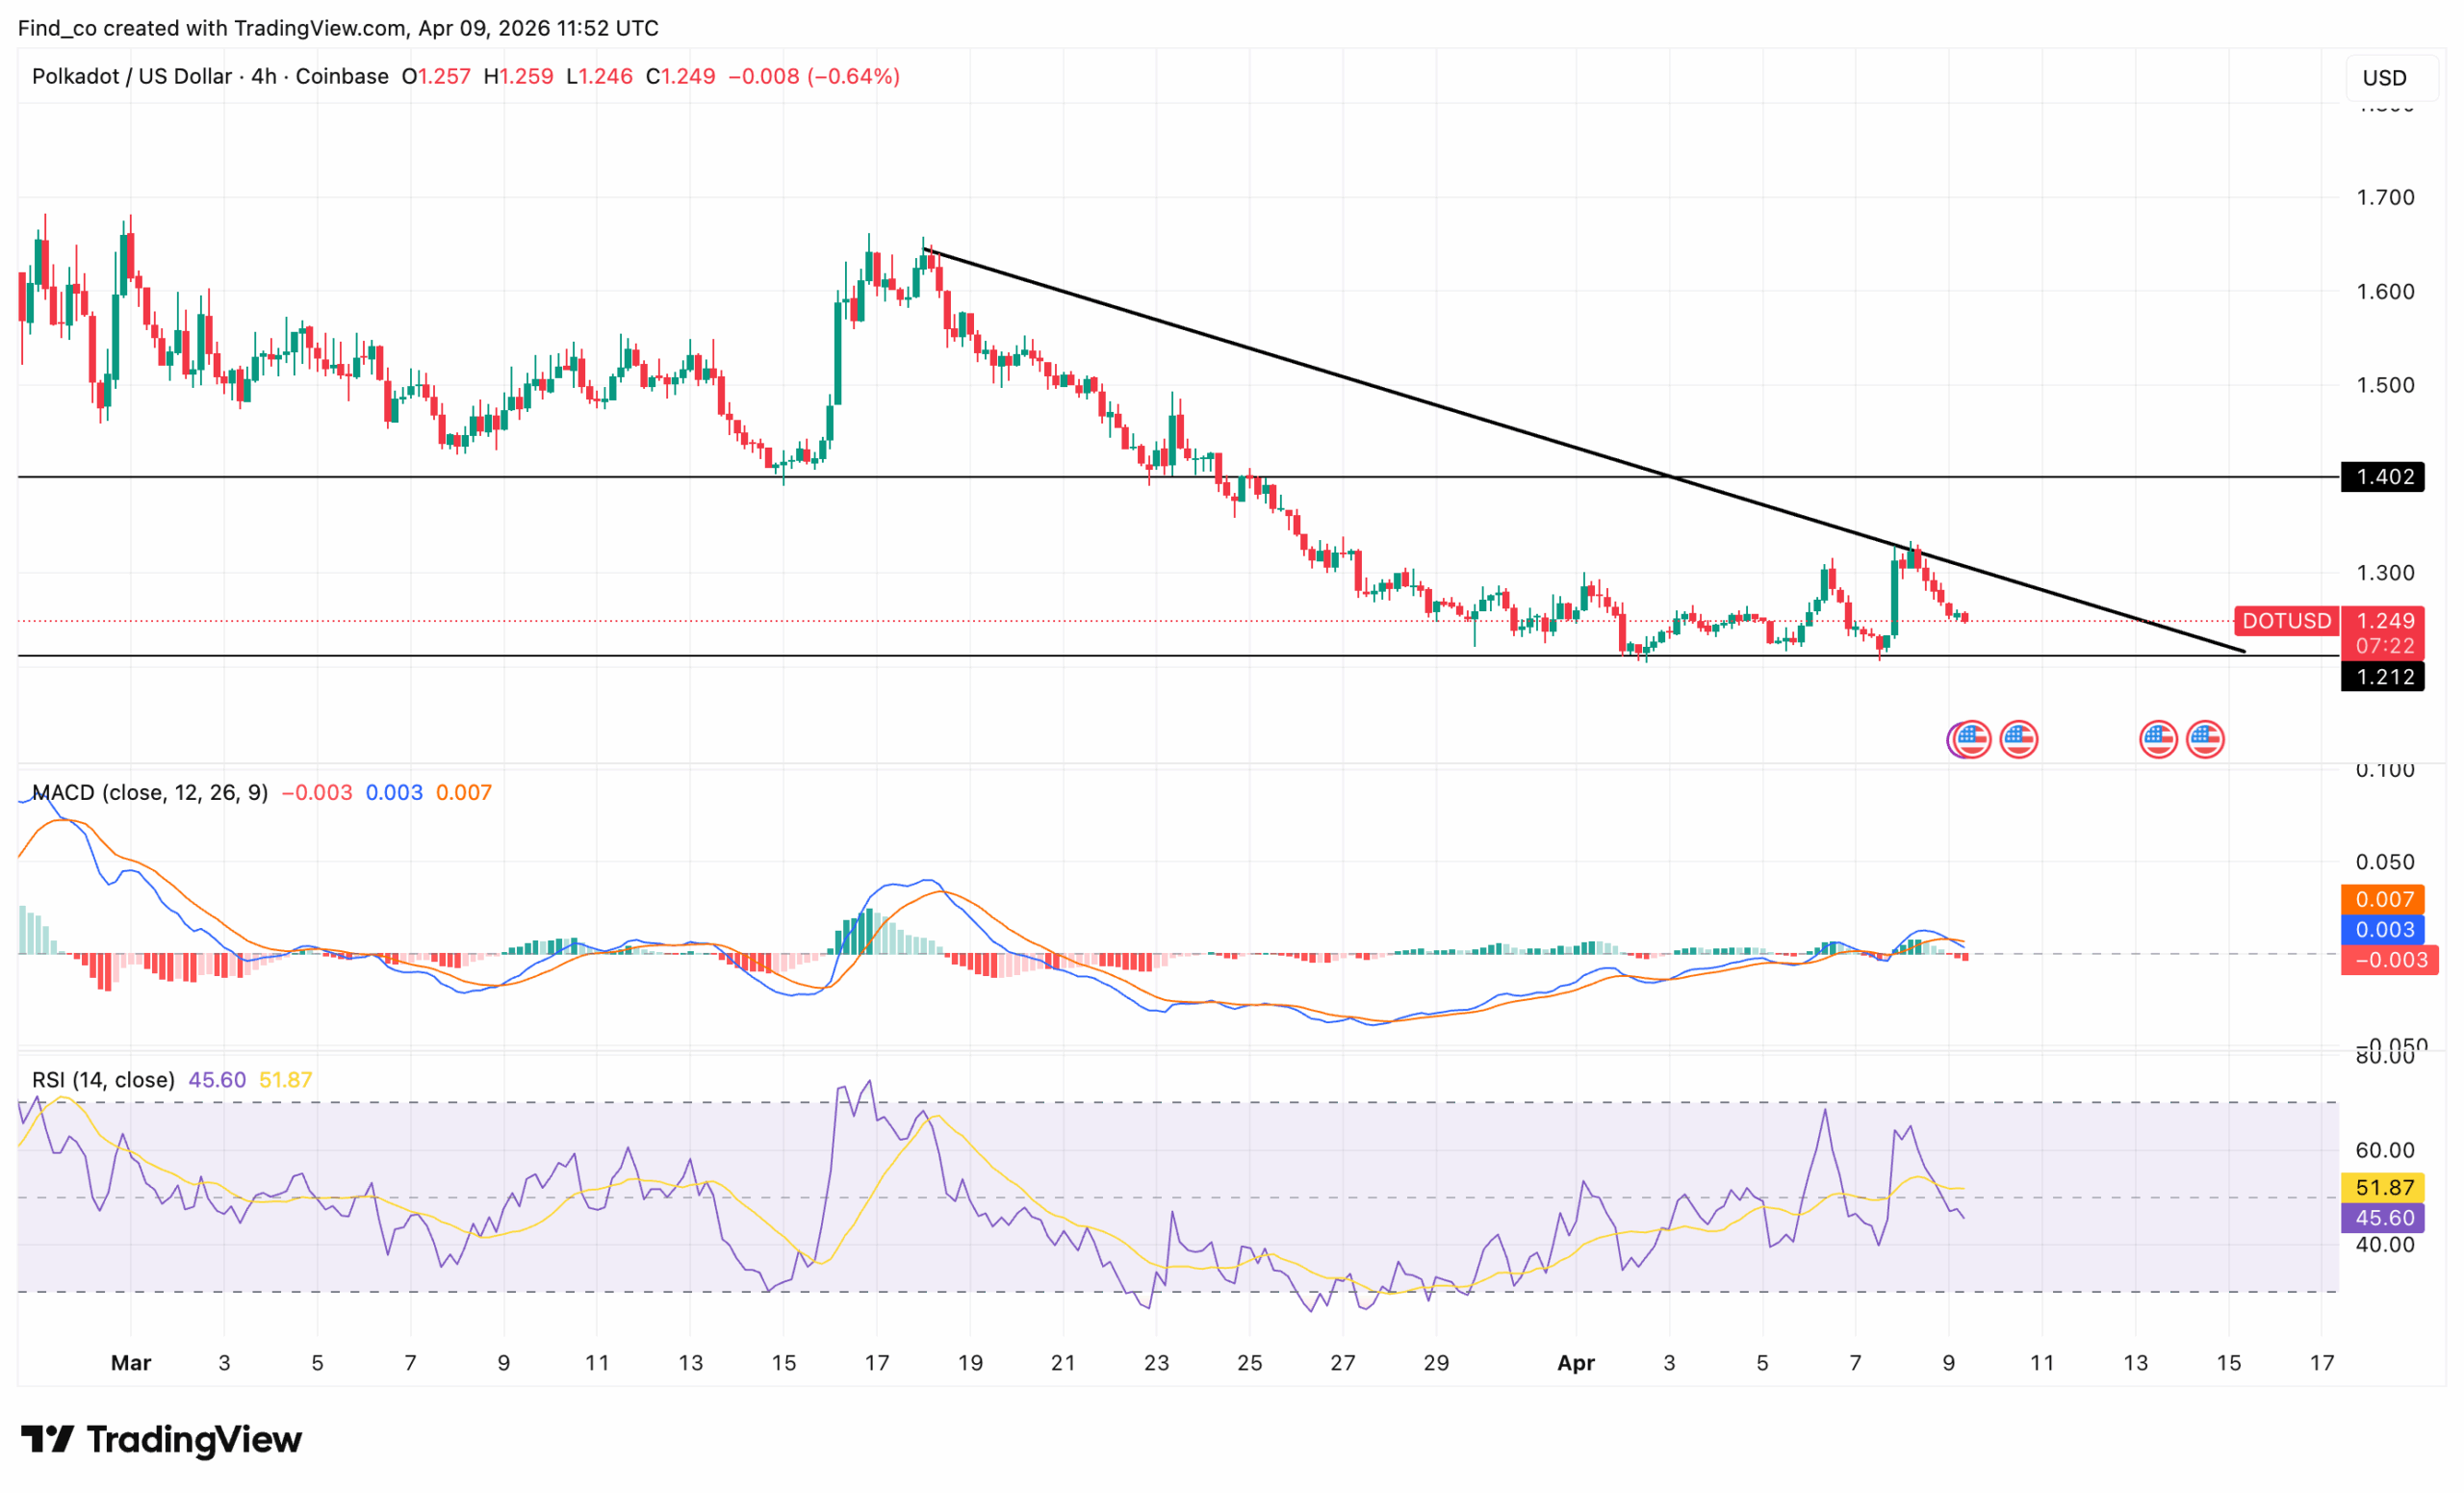
The 4-hour chart shows a steady downtrend, with lower highs and lower lows dominating since mid-March.
However, momentum is beginning to shift. DOT’s price is now consolidating between key levels, with strong support holding near $1.20 and resistance capped around $1.34.
This range signals both accumulation and indecision.
Meanwhile, the recent Polkadot price action shows a liquidity sweep below support, followed by a quick recovery.
This suggests buyers are defending the zone. Still, upside attempts continue to face rejection near the range high.
Key momentum indicators reflect this bearish setup. The Relative Strength Index (RSI) hovers around neutral-to-bearish levels, showing no strong momentum bias.
At the same time, the Moving Average Convergence Divergence (MACD) is flattening, hinting at a potential trend shift but lacking confirmation.
A sustained break below the $1.20 mark may trigger another leg down into a deeper correction as sellers regain control.
Bearish Intensity Slowly Declines
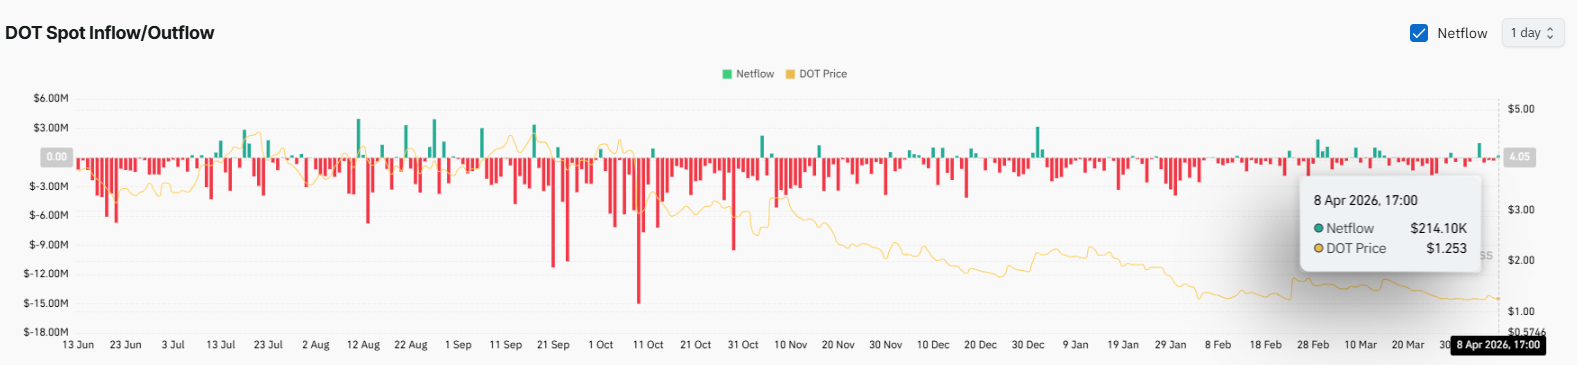
Polkadot’s derivatives data highlights sustained but controlled sell pressure, rather than extreme liquidation.
Throughout March, net flows remain consistently negative, with outflows largely ranging below the positive region.
This steady pattern of red bars confirms ongoing bearish positioning and aligns with DOT’s broader downtrend.
However, the structure begins to shift into late March and early April.
Outflows become noticeably shallower, while netflows compress toward neutral. At the same time, small inflows, such as the +$214,000 print, are emerging, signaling tentative buyer interest.
Overall, while sellers still dominate, the declining intensity of outflows suggests bearish momentum is gradually easing, signaling early signs of stabilization in DOT’s price.
DOT Price Analysis: Downtrend Continues
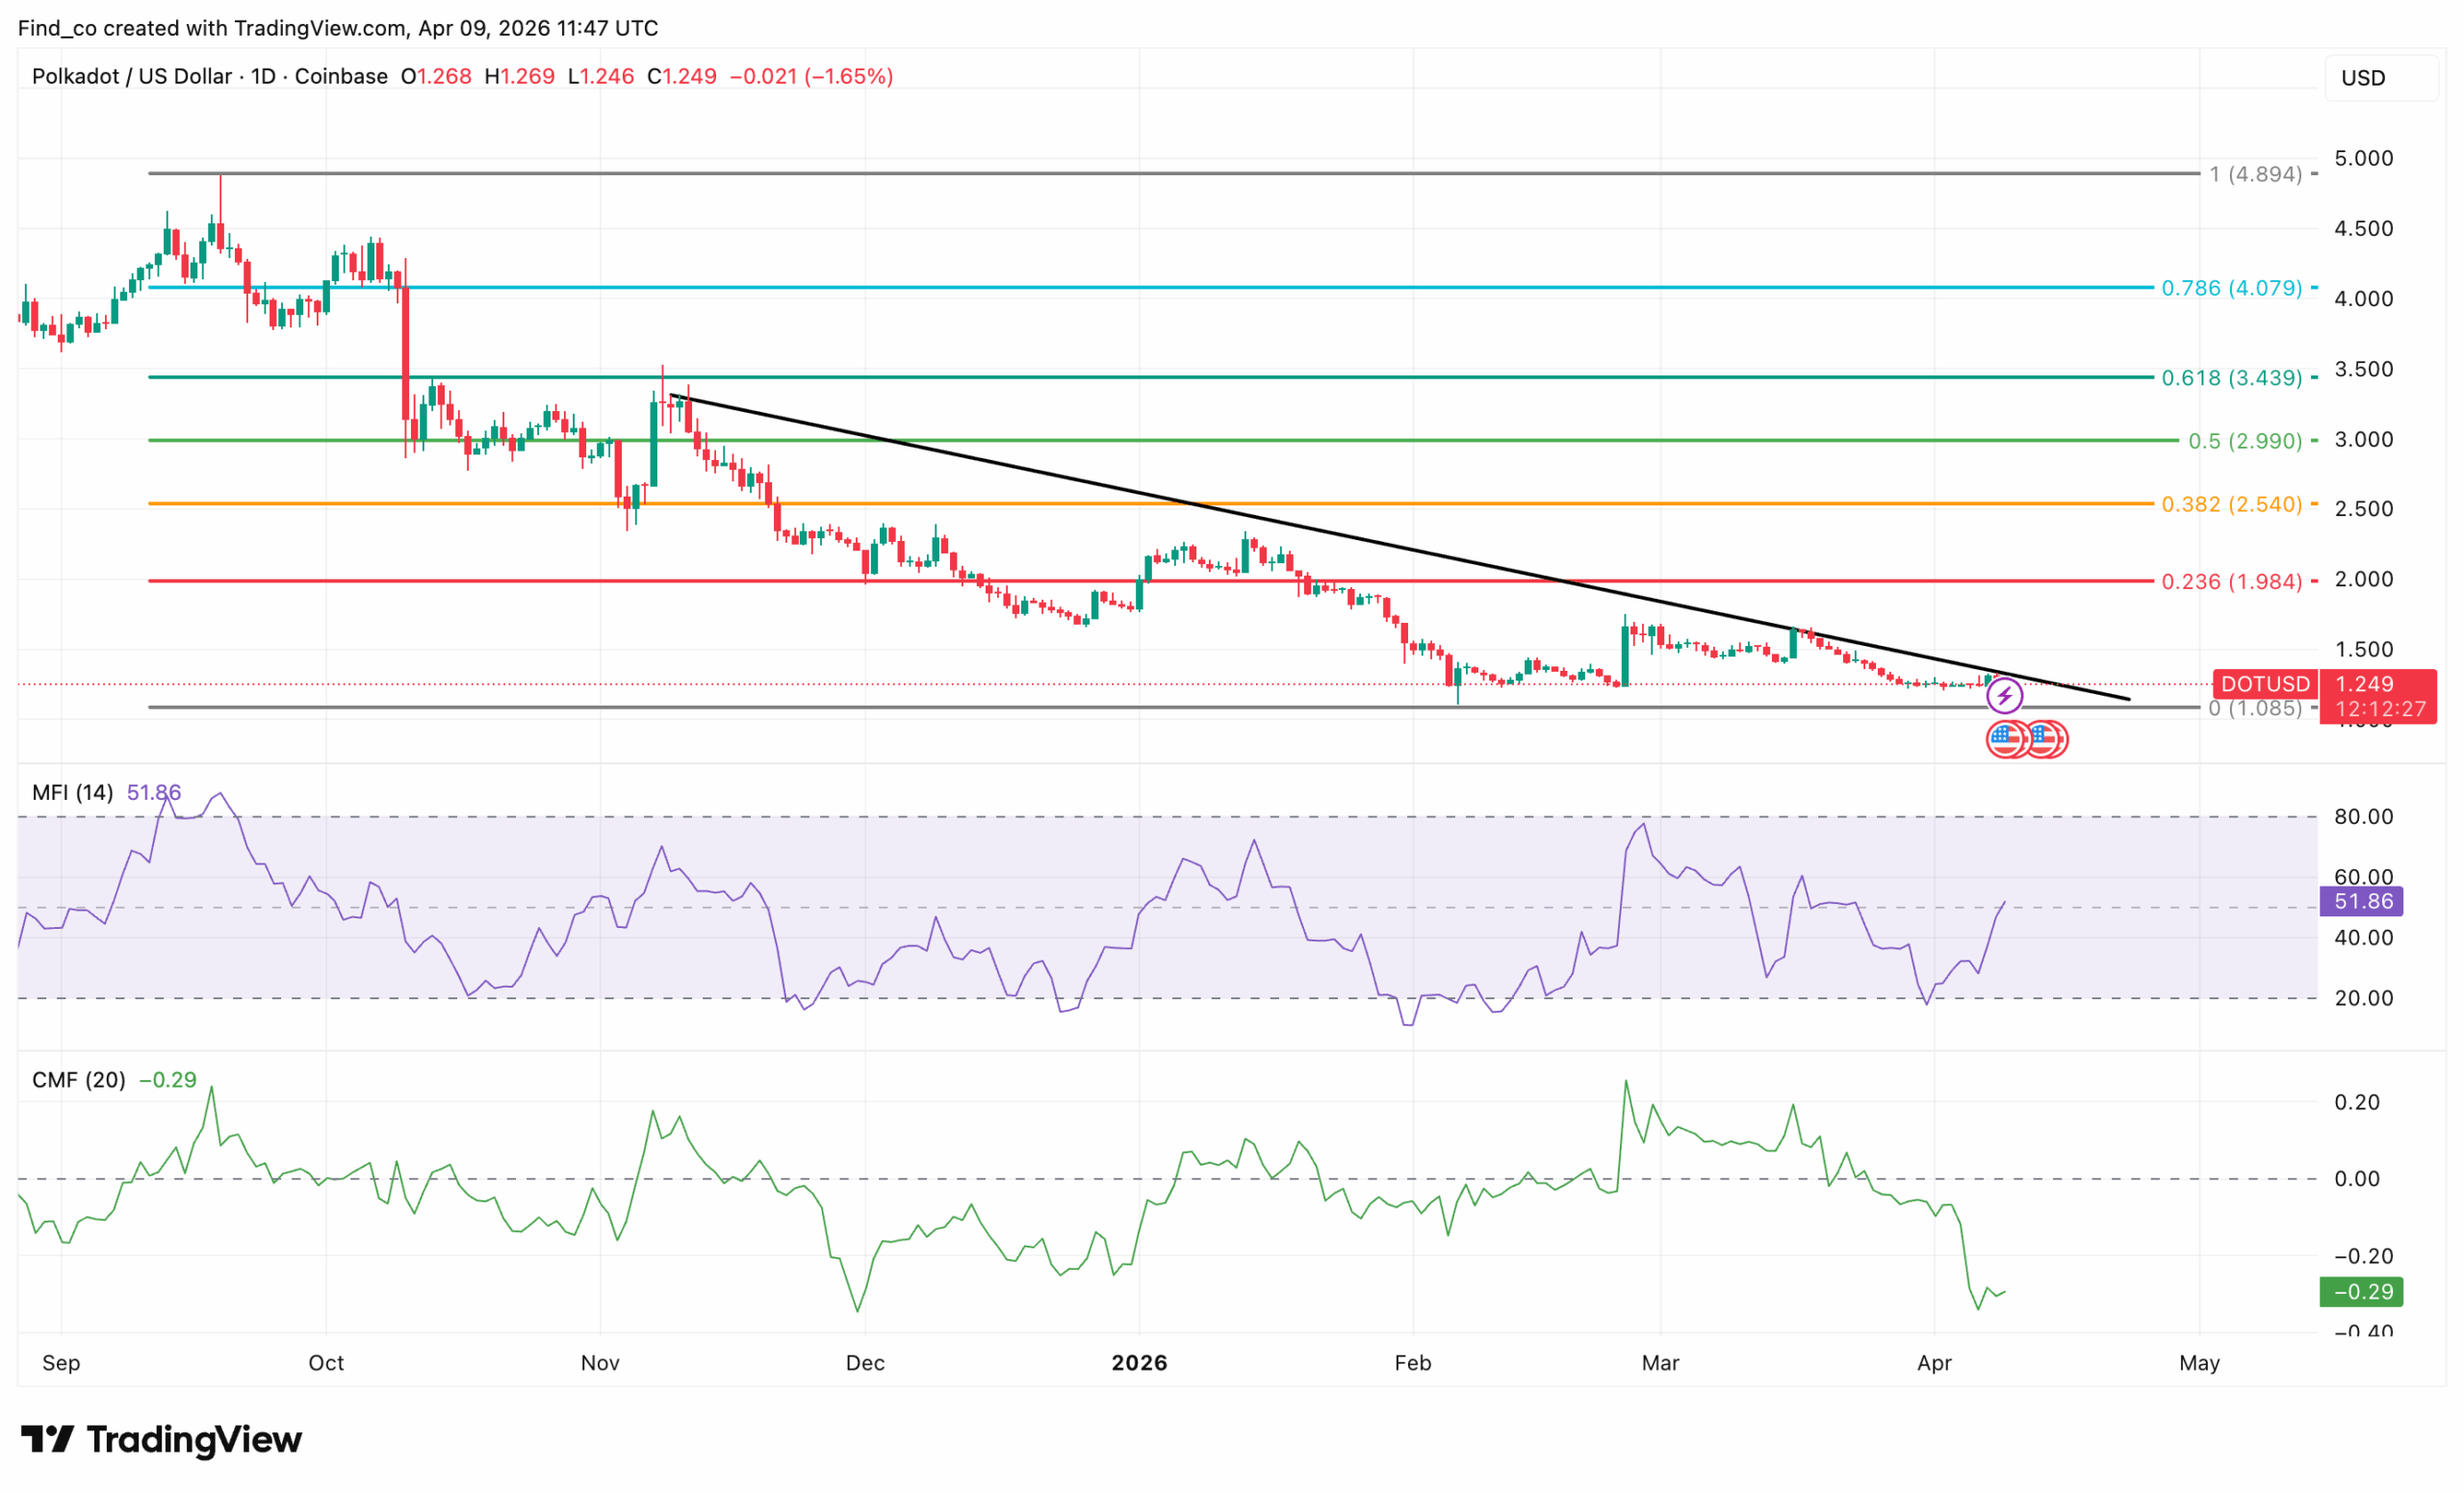
In the meantime, DOT remains in a downtrend, with price action confined in a descending structure on the daily chart.
The broader trend shows persistent lower highs and lower lows, confirming sustained bearish control.
After repeated rejections from key Fibonacci levels, particularly the 0.236 and 0.382 zones, DOT’s price has failed to build any meaningful upside momentum.
Currently, DOT’s price hovers just above the $1.10 support region, a critical level that has absorbed recent selling pressure. However, momentum indicators point to weakness.
The Money Flow Index (MFI) sits near the mid-range, reflecting neutral demand, while the Chaikin Money Flow (CMF) remains negative, signaling consistent capital outflows.
Disclaimer:
The information provided in this article is for informational purposes only. It is not intended to be, nor should it be construed as, financial advice. We do not make any warranties regarding the completeness, reliability, or accuracy of this information. All investments involve risk, and past performance does not guarantee future results. We recommend consulting a financial advisor before making any investment decisions.
Victor Olanrewaju is a crypto analyst and reporter at CCN with deep roots in on-chain research and technical analysis. His crypto journey began in 2017, but it was the 2020 Uniswap airdrop that sparked a full-time pivot into the space.
With a foundation in copywriting, Victor honed his craft creating high-converting content for leading crypto brokers — most notably an XRP price prediction that ranked #1 on Google during the 2021 bull run.
He later joined AMBCrypto in 2022, where he combined storytelling with technical and on-chain analysis to cover key market narratives.
In 2024, he expanded his expertise at BeInCrypto, collaborating with analysts and using tools like Glassnode, Santiment, and IntoTheBlock to break down Bitcoin and altcoin trends.
At CCN, Victor covers the top cryptocurrencies, memecoins, macro shifts, blending real-time insights with deep-dive metrics.
He holds a Bachelor’s degree in Physics from the University of Ibadan, equipping him to simplify complex data for a wide audience. Follow his work or connect on LinkedIn or X.