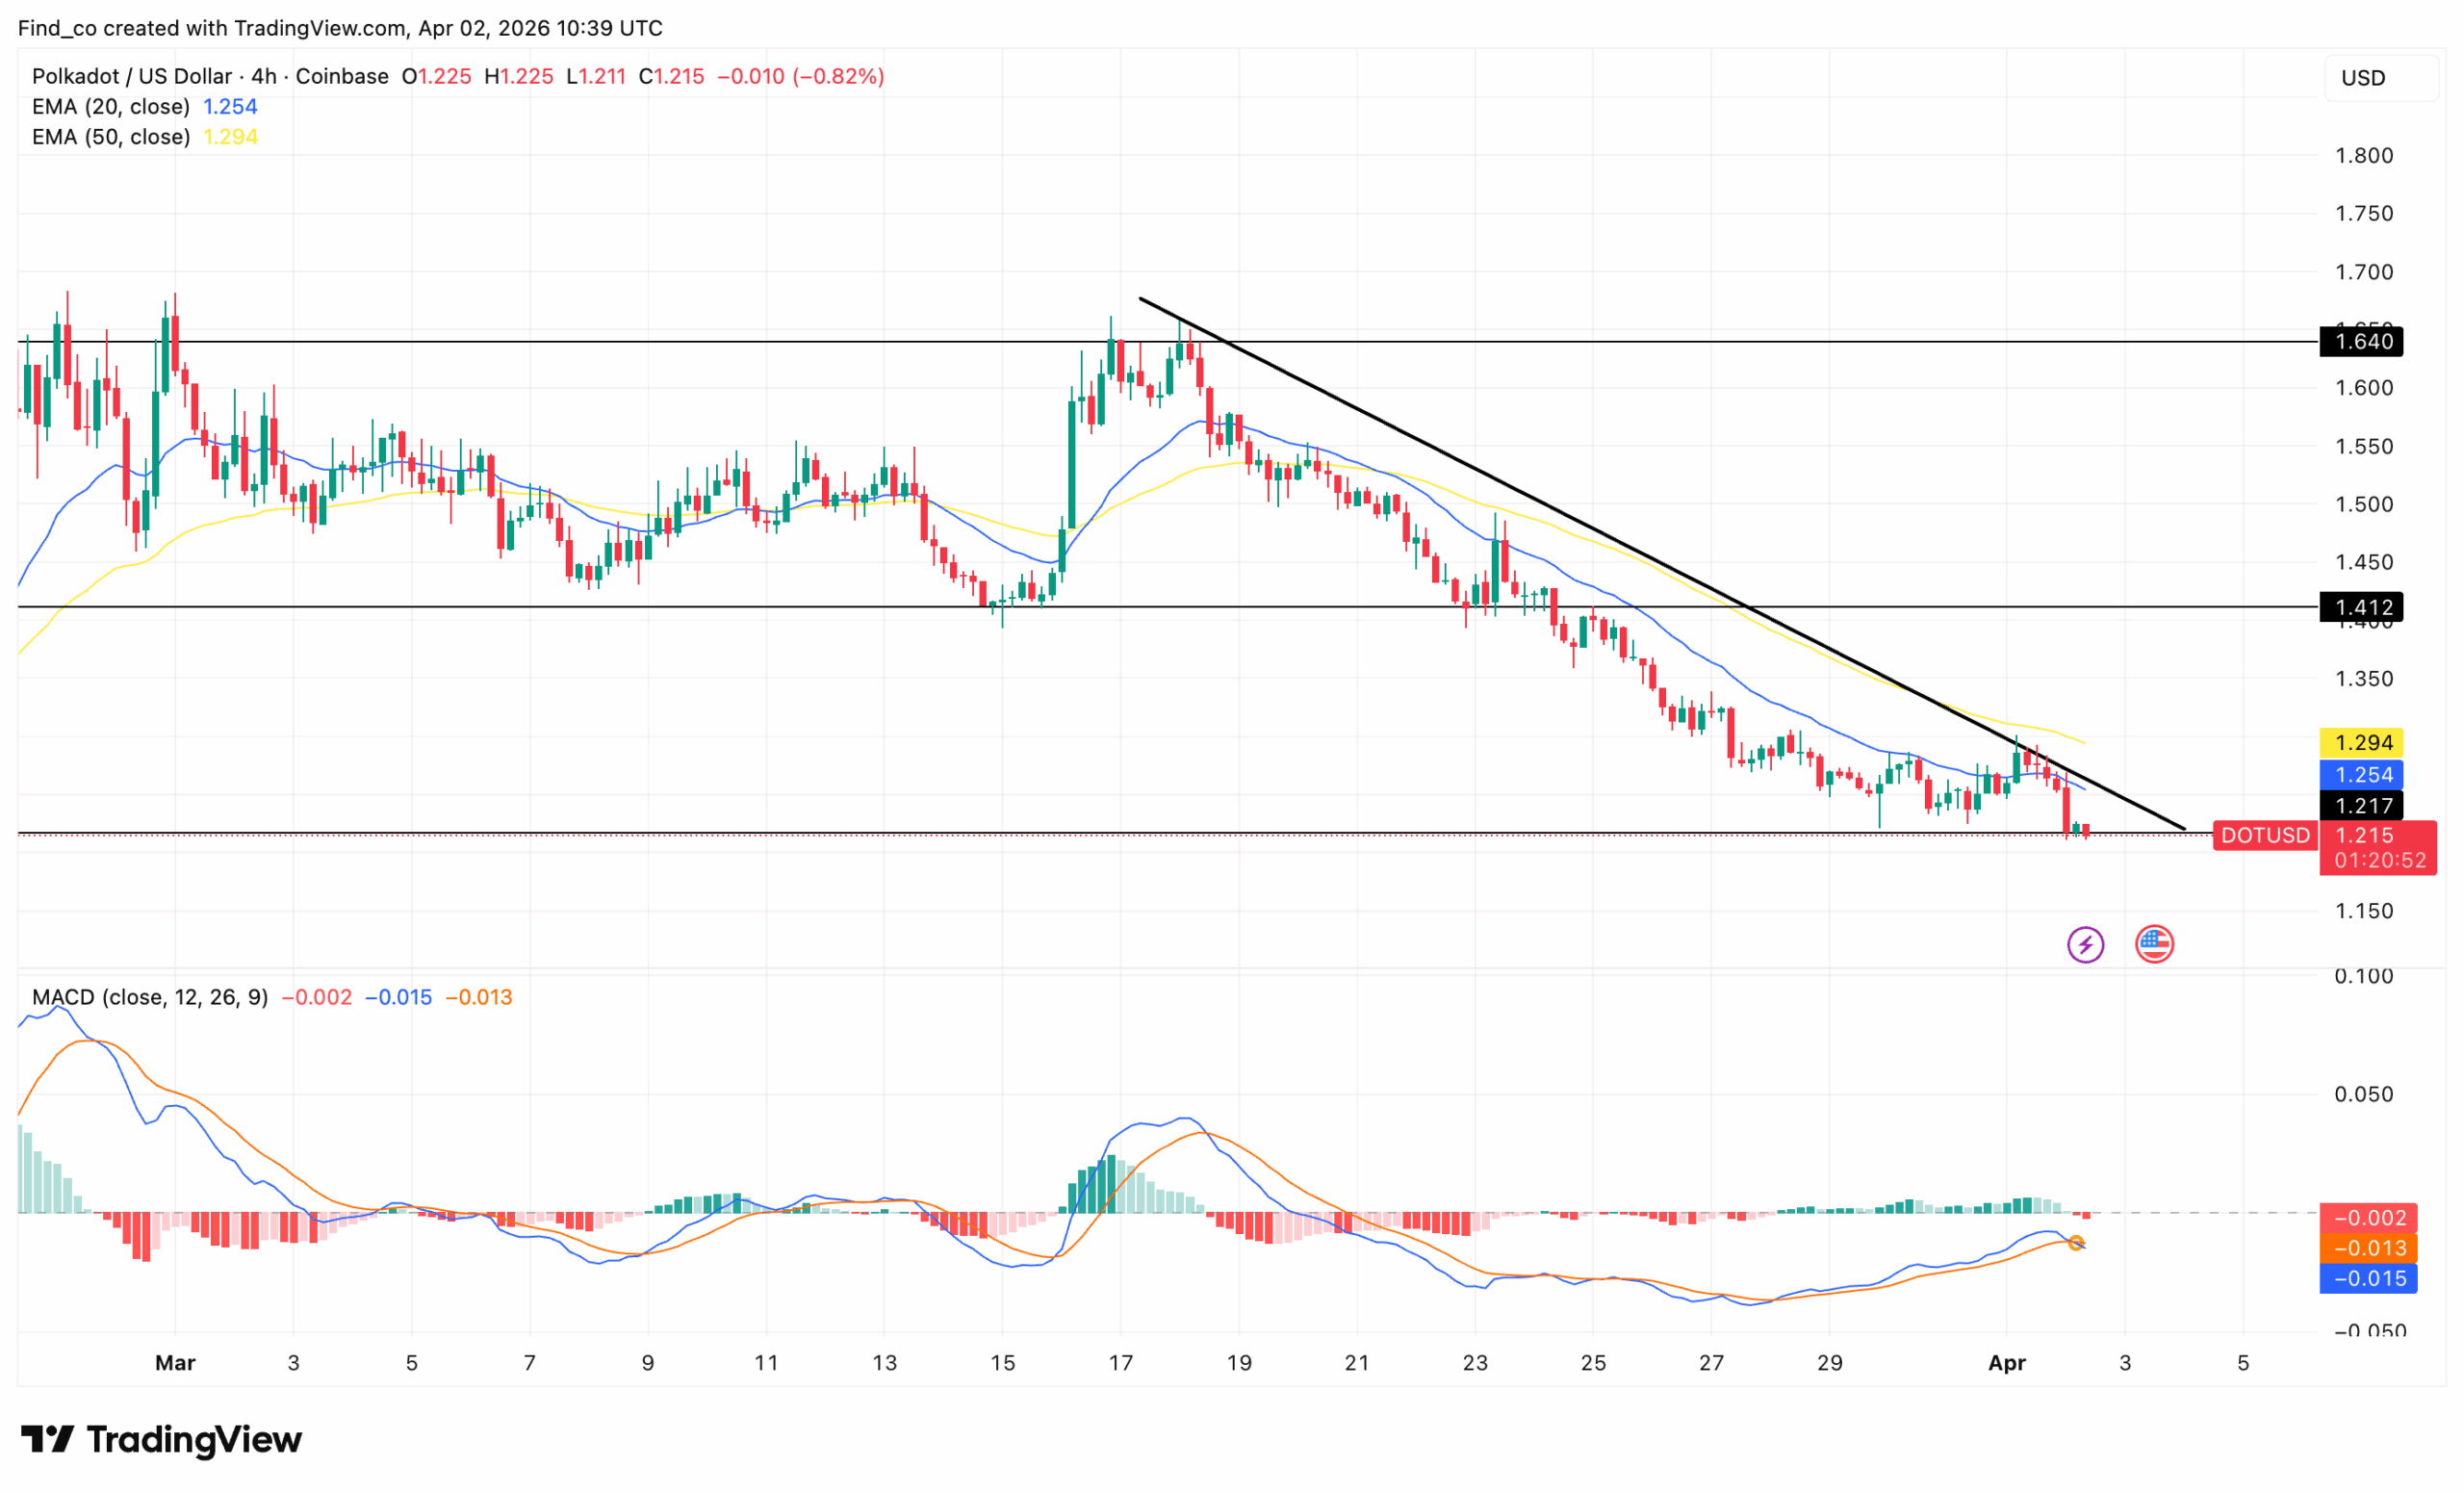
Above that, $1.41 becomes the next key barrier. A break above these levels would be needed to shift sentiment.
On the downside, $1.21 is immediate support. If it fails, Polkadot’s price could drift lower toward psychological levels near $1.15.
DOT Price Analysis: More Losses
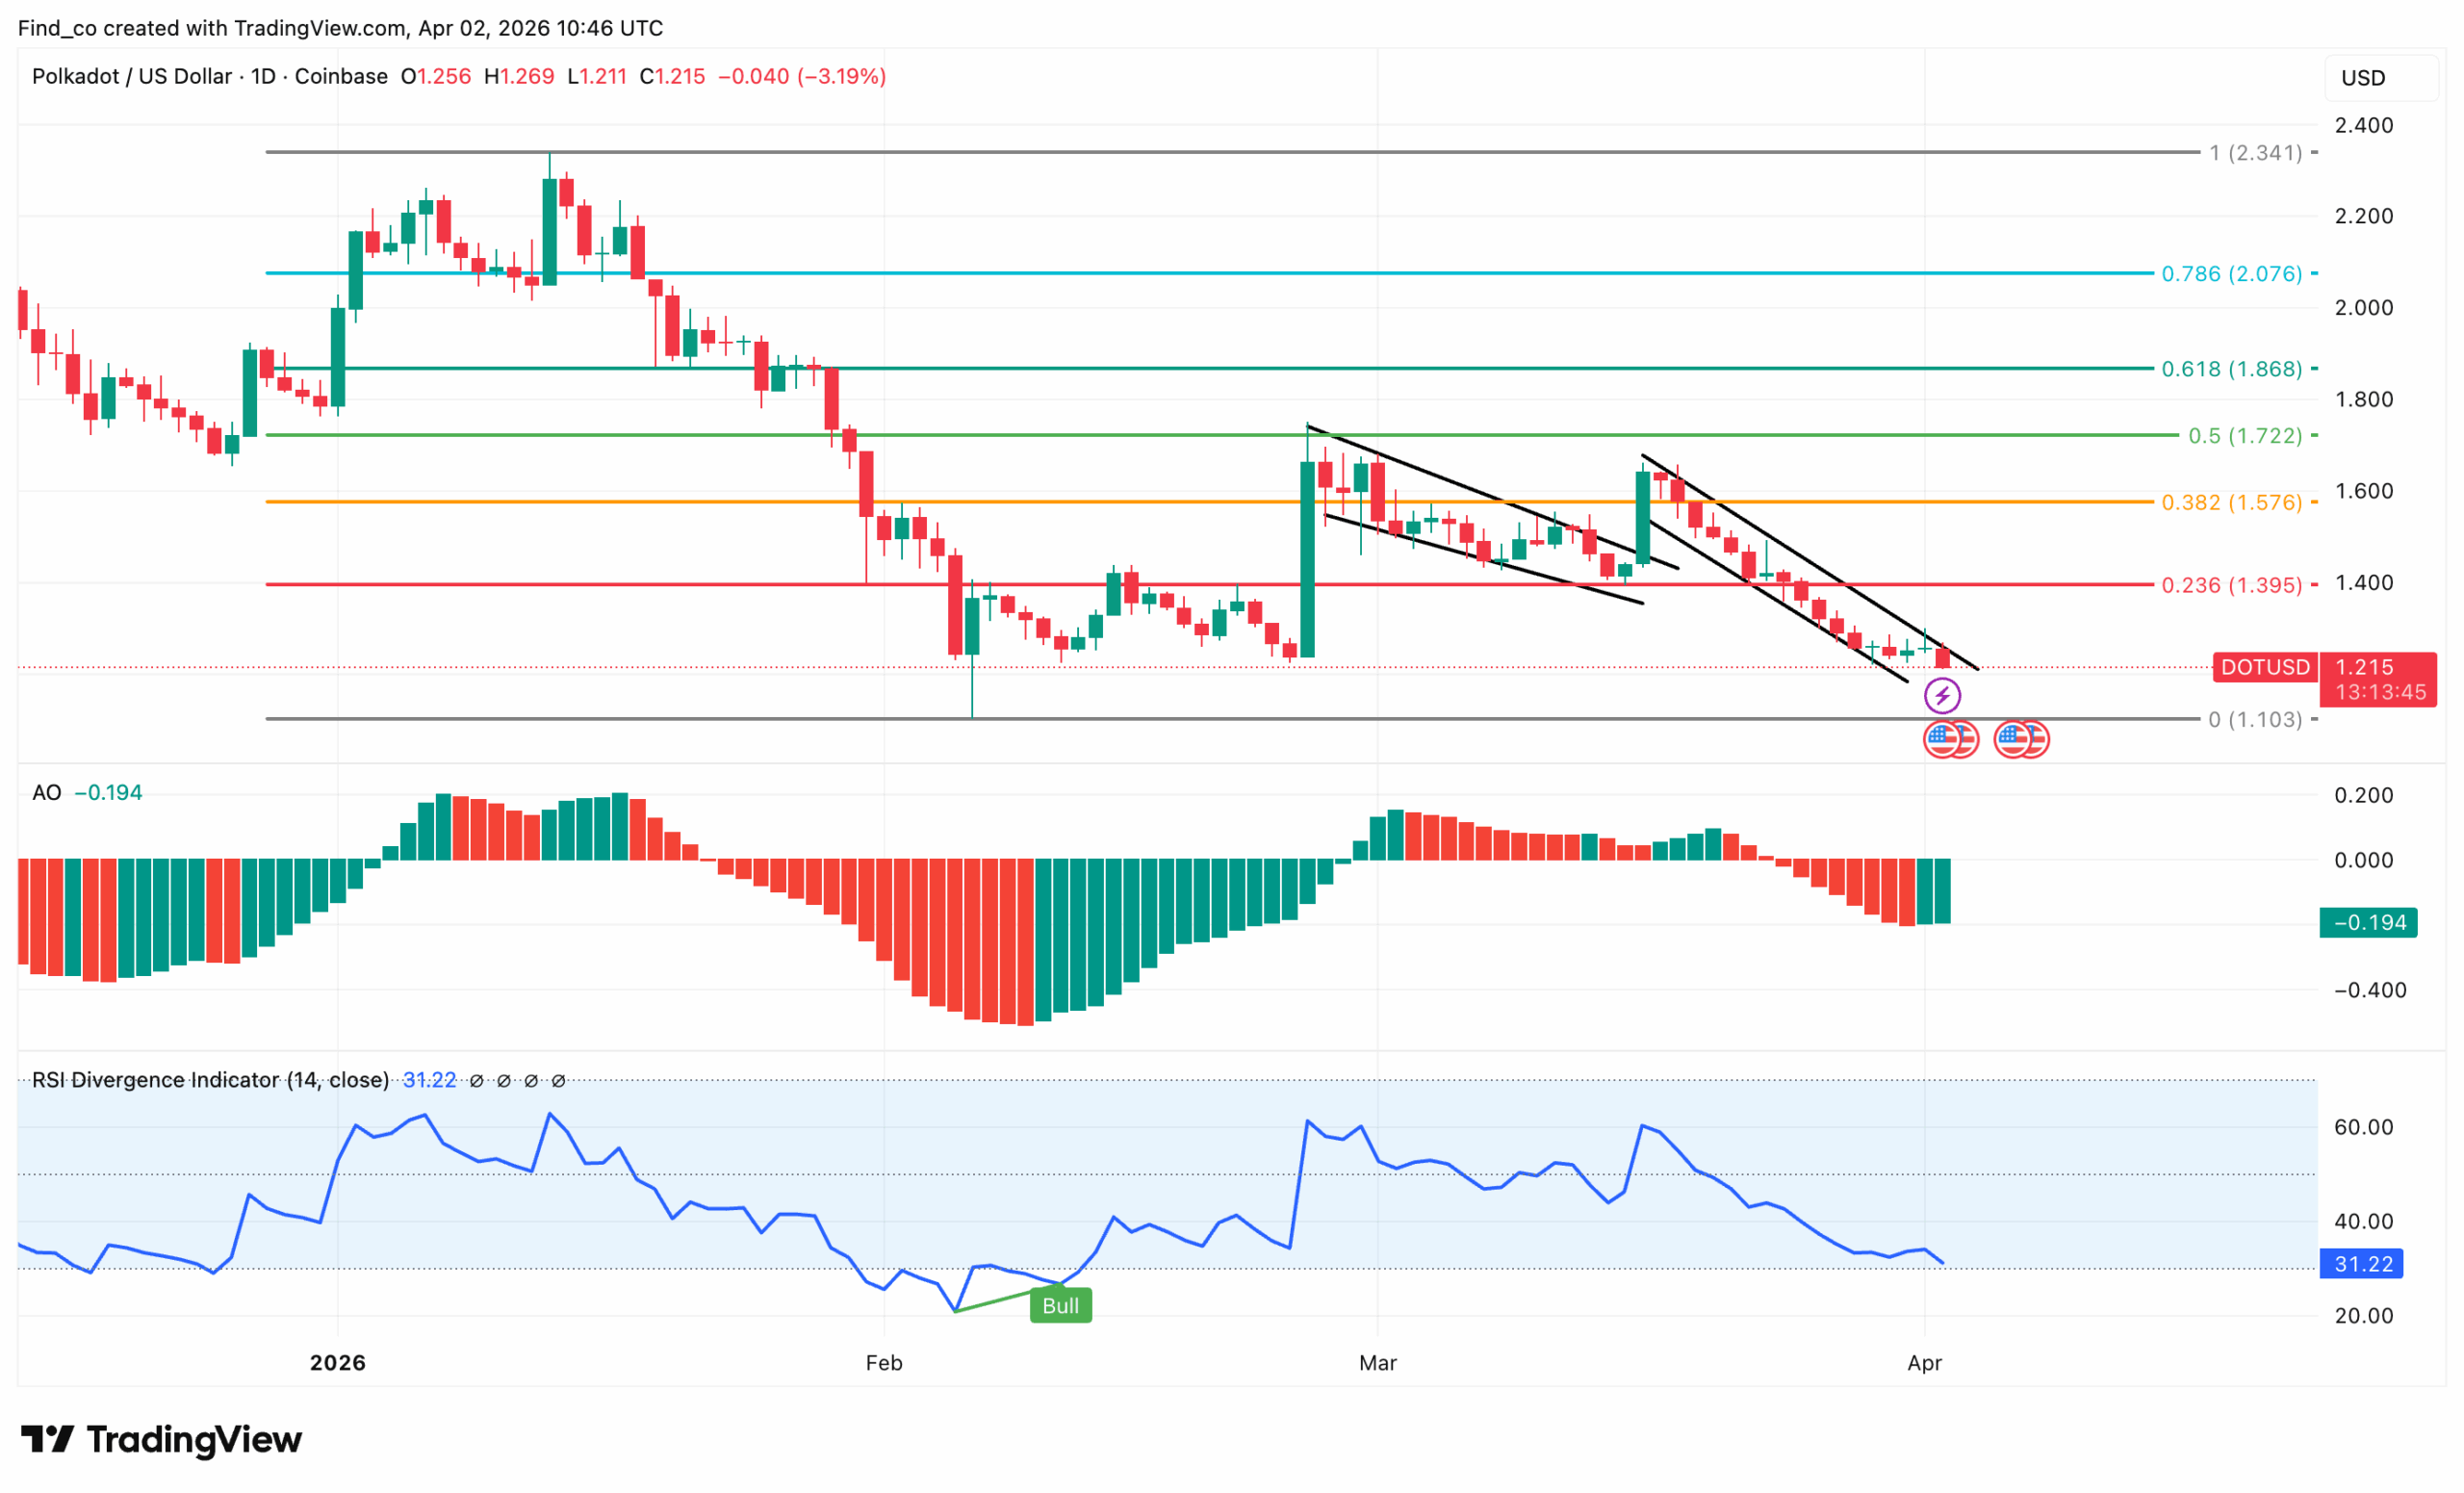
On the daily chart, Polkadot’s price remains under pressure, and the broader structure continues to confirm a sustained downtrend.
As stated earlier, the DOT coin price continues to print lower highs and lower lows. Moreover, the descending trendlines highlight consistent seller control since March.
Then, key Fibonacci levels frame the weakness. Price now trades below the 0.236 level at $1.39. This level previously acted as support.
However, once it broke, it flipped into resistance. As a result, upside attempts are getting rejected earlier.
At the same time, the broader retracement structure shows heavy damage. DOT failed to hold above the 0.382 ($1.57) and 0.5 ($1.72) levels. Therefore, the market has shifted from corrective to bearish continuation.
Meanwhile, momentum indicators align with the downside. The Awesome Oscillator (AO) remains below zero.
Although there are brief green bars, they lack follow-through. In addition, the RSI sits near 31, approaching oversold territory. However, it has not yet triggered a strong reversal.
Notably, repeated bearish channels appear. Each consolidation forms a downward-sloping range.
Looking at support, price is now testing the $1.21–$1.10 zone. This area represents a key demand region. If it fails, the downside could extend further with little structure below.
On the upside, $1.39 is the first resistance. Then, $1.57 becomes the next major barrier.
A reclaim of these levels would be needed to challenge the bearish trend.
Disclaimer:
The information provided in this article is for informational purposes only. It is not intended to be, nor should it be construed as, financial advice. We do not make any warranties regarding the completeness, reliability, or accuracy of this information. All investments involve risk, and past performance does not guarantee future results. We recommend consulting a financial advisor before making any investment decisions.
Victor Olanrewaju is a crypto analyst and reporter at CCN with deep roots in on-chain research and technical analysis. His crypto journey began in 2017, but it was the 2020 Uniswap airdrop that sparked a full-time pivot into the space.
With a foundation in copywriting, Victor honed his craft creating high-converting content for leading crypto brokers — most notably an XRP price prediction that ranked #1 on Google during the 2021 bull run.
He later joined AMBCrypto in 2022, where he combined storytelling with technical and on-chain analysis to cover key market narratives.
In 2024, he expanded his expertise at BeInCrypto, collaborating with analysts and using tools like Glassnode, Santiment, and IntoTheBlock to break down Bitcoin and altcoin trends.
At CCN, Victor covers the top cryptocurrencies, memecoins, macro shifts, blending real-time insights with deep-dive metrics.
He holds a Bachelor’s degree in Physics from the University of Ibadan, equipping him to simplify complex data for a wide audience. Follow his work or connect on LinkedIn or X.