DOT slips under the critical $2.00 psychological support | Credit: Hameem Sarwar
Share
Key Takeaways
DOT erased its Robinhood listing gains and fell below $2 support.
Bearish indicators signal rising downside momentum and weak demand.
Failure to reclaim $2 could send DOT toward $1.70 or lower.
Polkadot (DOT) has given back the entire Robinhood-listing pop and slipped below the key $2 psychological level.
That break signals a clear shift in short-term sentiment, with buyers losing control after the market rejected DOT near $2.35.
That rejection flipped the structure bearish. It also dragged Polkadot’s price back into its prior consolidation range.
This has increased downward pressure and raised the risk of a deeper pullback unless bulls can quickly reclaim $2.00.
With DOT now trading beneath its former breakout base, the market is moving from event-driven optimism toward technical-driven price discovery.
Here is why it could be challenging for DOT’s price to increase again.
Polkadot Robinhood Pop Fades
Following DOT’s recent listing on Robinhood, the token pulled back sharply after hitting key resistance.
This suggests that the initial listing hype has largely been absorbed, and traders have shifted to profit-taking rather than new accumulation.
“DOT is now available to trade on Robinhood Crypto, including NY,” Robinhood team announced on Jan. 13.
As a result, the market is returning to technical factors, with DOT’s downward momentum becoming more pronounced.
If Polkadot price fails to hold immediate support at $1.85, it could face additional declines.
DOT Price Slides Below $2
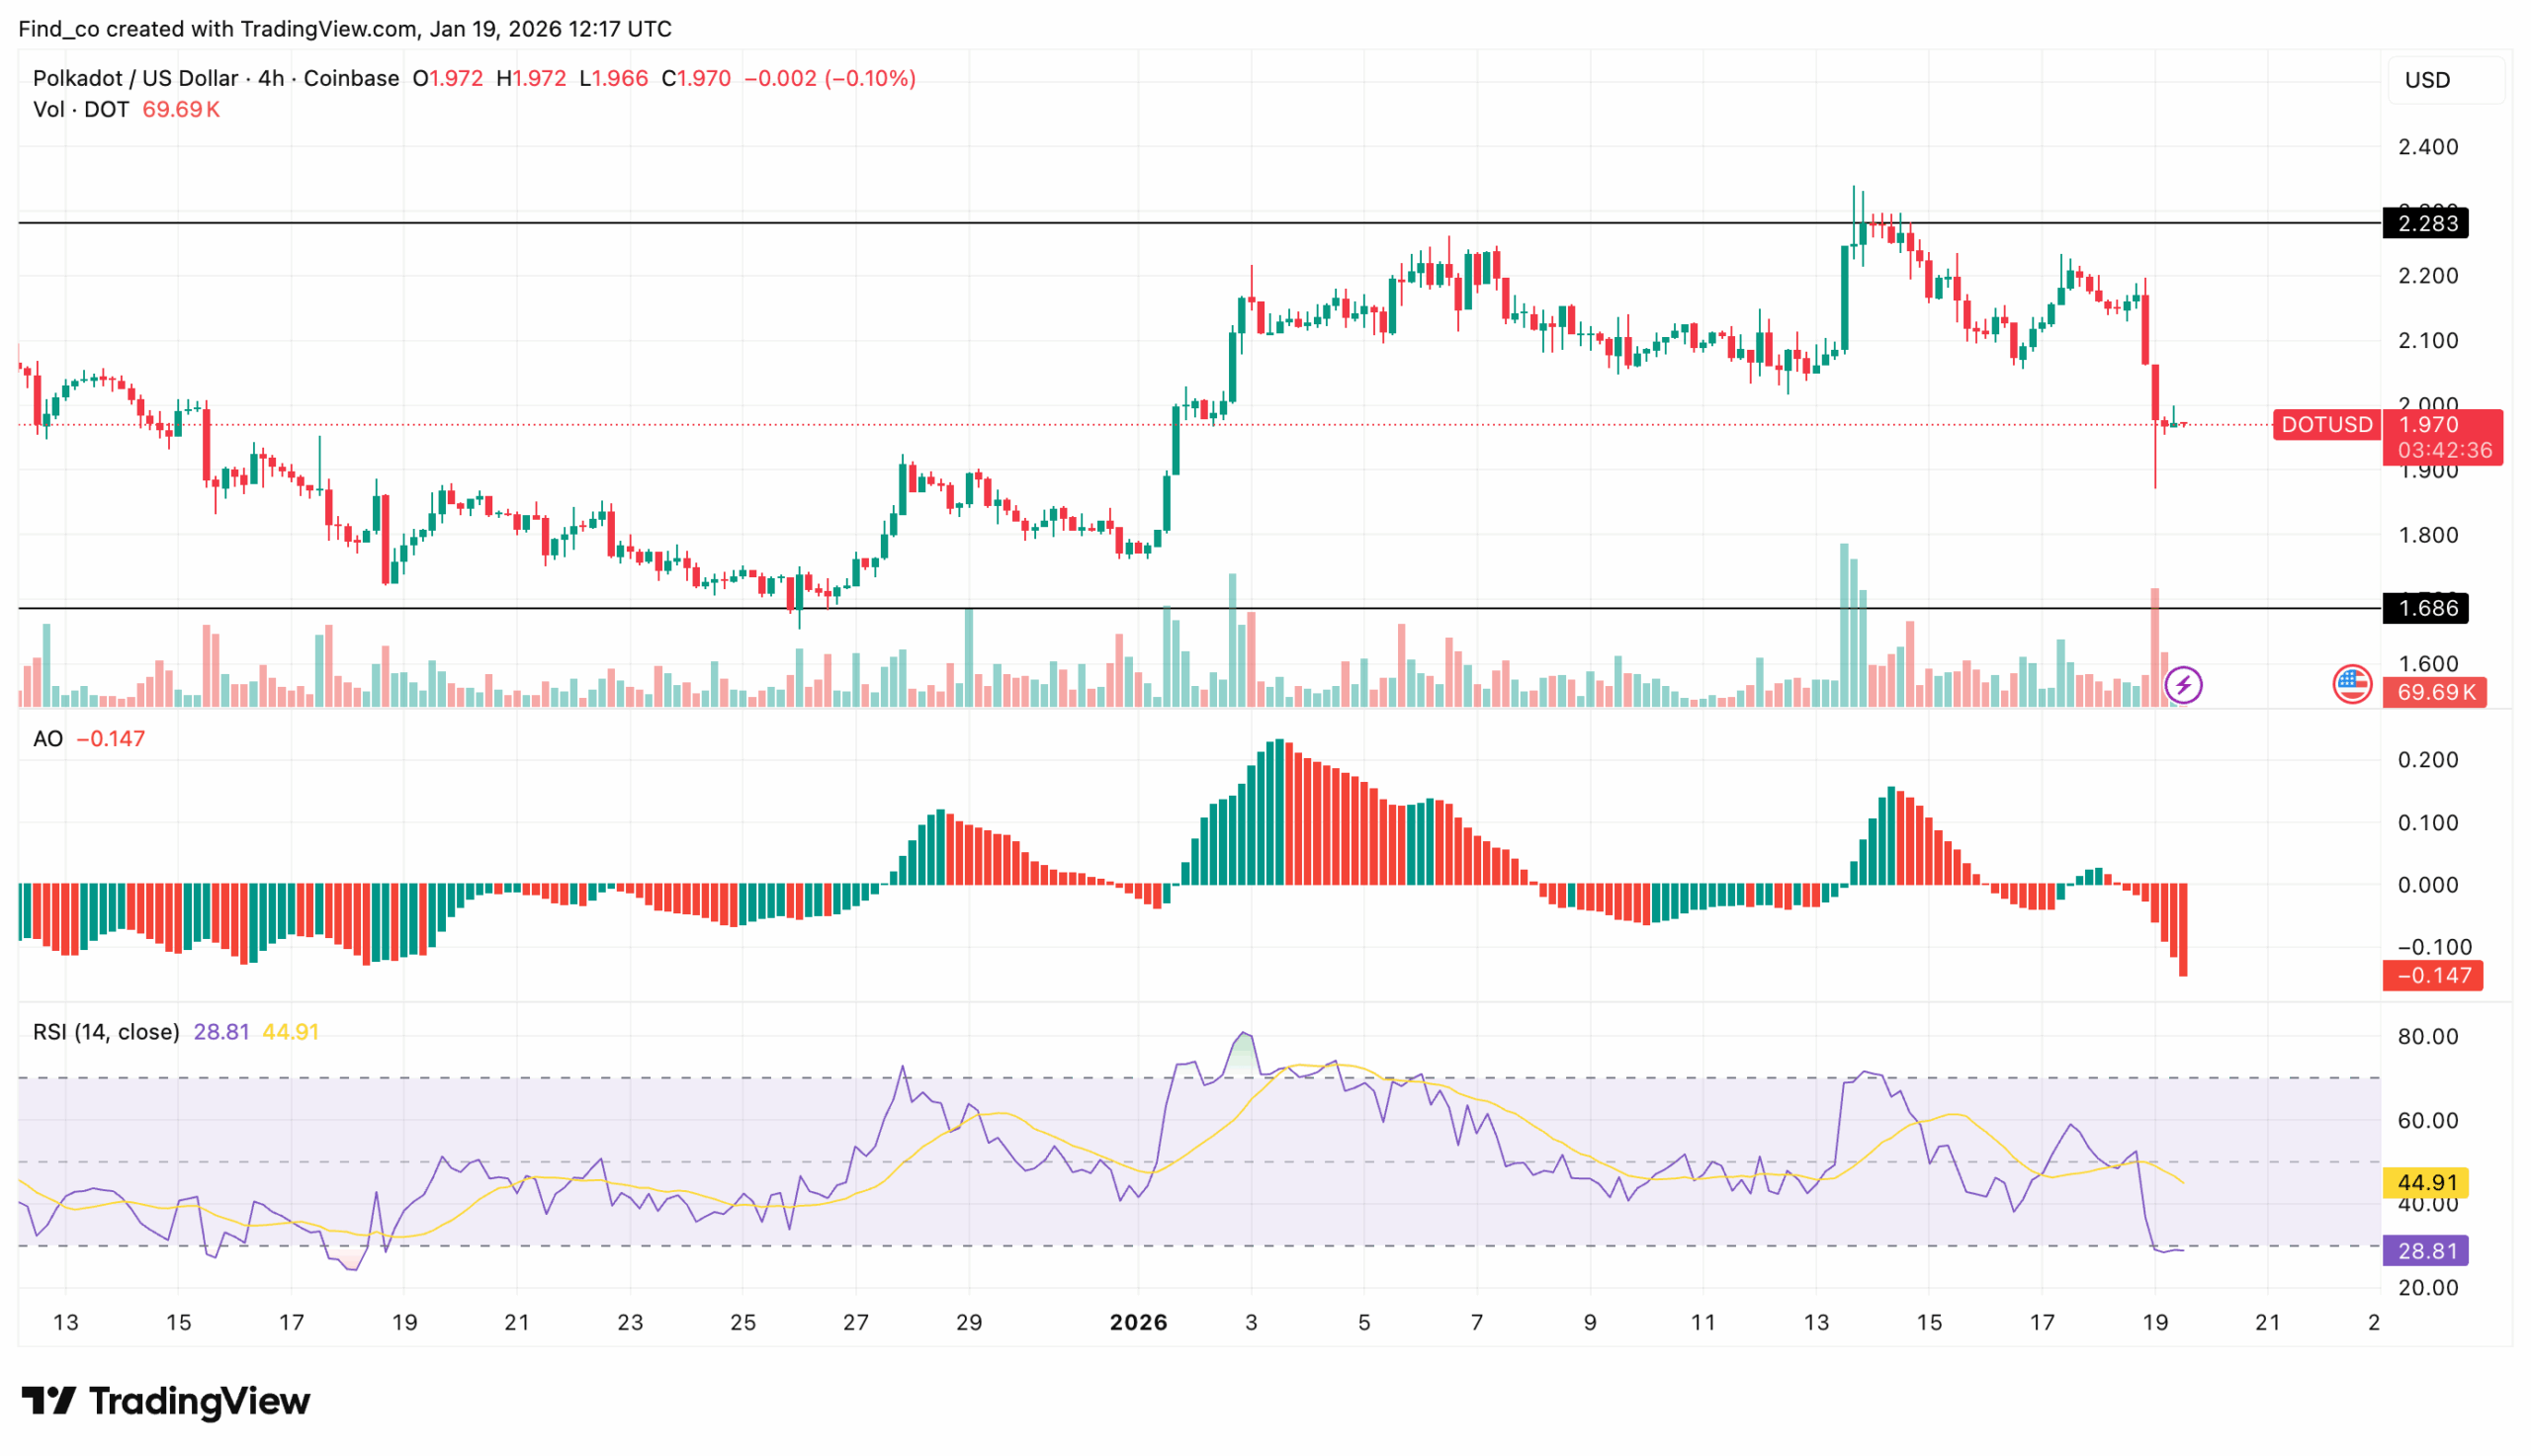
The Awesome Oscillator (AO) highlights DOT’s deteriorating structure. On the 4-hour chart, the indicator sits deep in negative territory at -0.116, with expanding red histogram bars reflecting accelerating downside momentum.
This setup indicates that bearish pressure is strengthening rather than stabilizing amid waning investor interest.
The Relative Strength Index (RSI) paints an even more aggressive picture, reinforcing the AO’s bearish signal.
As seen below, the RSI has collapsed to 30.67, hovering just above oversold conditions. This sharp decline reflects heavy distribution and sustained sell-side dominance, with buyers showing little conviction at current levels.
DOT’s price action shows the altcoin has broken below its short-term support zone between $2.05 and $2.10 and is now trading beneath its prior breakout base.
This failed breakout structure significantly raises the likelihood of a continuation move toward the lower range boundary around $1.70 to $1.75.
If bears maintain control and DOT fails to quickly reclaim the $2.00 level, downward pressure is likely to persist. If sustained, this could expose the next demand region near $1.58 to $1.60.
Traders Outline Their Thoughts
Despite the bearish setup, some traders believe that the altcoin price will soon break out.
For instance, pseudonymous analyst Jessica noted that the altcoin might resume its uptrend.
“The price of $DOT may continue its upward movement after gathering liquidity in the $1.96 – $2.01 range. If the price reacts to this liquidity zone, then an upward movement will begin with the goal of reaching and breaking through the $2.40 resistance level,” The trader pointed out.
However, on the other side of the divide, technical analyst Chetan said he expects Polkadot’s price to decline before any rally.
“DOT is currently its in a bearish channel since 2021 top… where it currently targeting the lows of the channel around 0.80$ imo (if filling the wick scenario happens)… when Market start reversal i’m expecting it to go for 10.5$ – 21.35$ (according to 0.618 – 0.786 fib) minimum,” Chetan highlighted.
DOT Price Analysis: Bearish
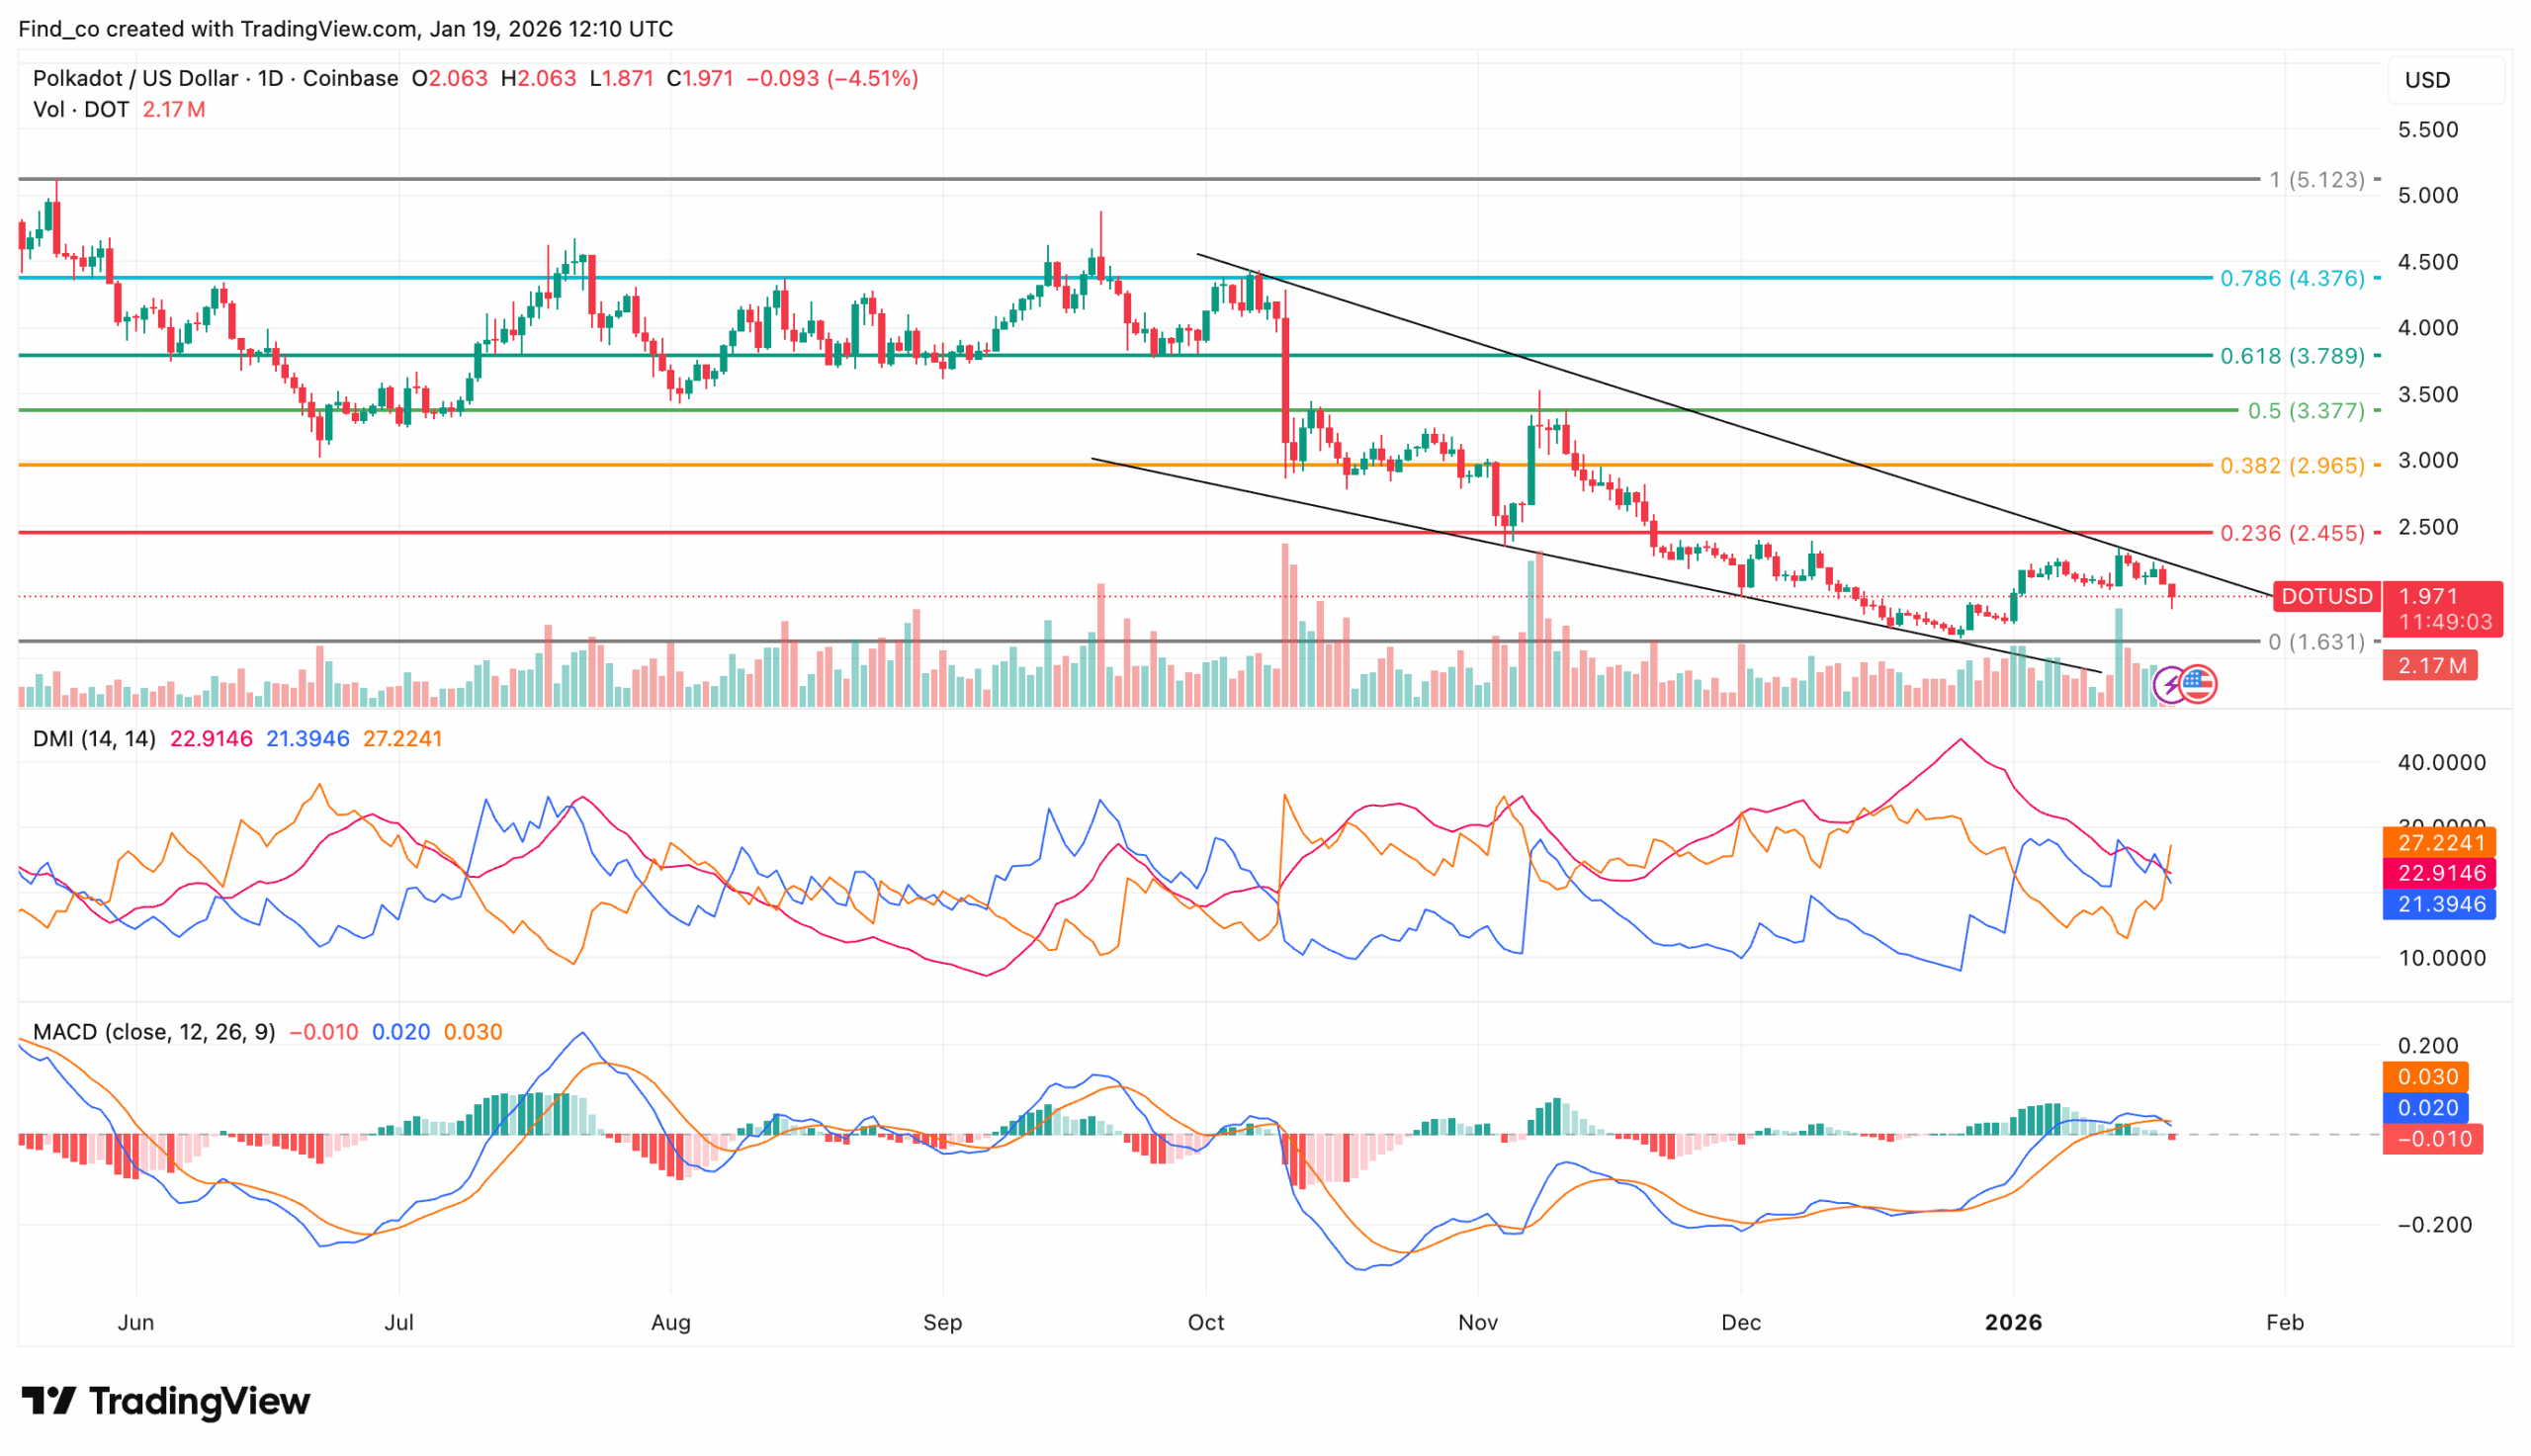
On the daily timeframe, DOT trades at $1.97, marking an 8% pullback that has stalled its prior upward momentum.
This decline has pushed the price below its short-term support zone, signaling a shift in market structure as sellers regain control.
The Directional Movement Index (DMI) shows the negative -DMI crossing above the positive +DMI, confirming that bearish pressure is gaining strength.
Meanwhile, the Average Directional Index (ADX) sits at 22, suggesting the current downtrend is solidifying rather than representing a temporary correction.
The Moving Average Convergence and Divergence has flipped into negative territory, with the 26-day EMA crossing above the 12-day EMA, signaling a bearish crossover and confirming short-term selling momentum.
Fibonacci retracement levels suggest Polkadot’s price is still trading below the 0.236 Fib level as it trends toward key support at $1.76.
Disclaimer:
The information provided in this article is for informational purposes only. It is not intended to be, nor should it be construed as, financial advice. We do not make any warranties regarding the completeness, reliability, or accuracy of this information. All investments involve risk, and past performance does not guarantee future results. We recommend consulting a financial advisor before making any investment decisions.
Victor Olanrewaju is a crypto analyst and reporter at CCN with deep roots in on-chain research and technical analysis. His crypto journey began in 2017, but it was the 2020 Uniswap airdrop that sparked a full-time pivot into the space.
With a foundation in copywriting, Victor honed his craft creating high-converting content for leading crypto brokers — most notably an XRP price prediction that ranked #1 on Google during the 2021 bull run.
He later joined AMBCrypto in 2022, where he combined storytelling with technical and on-chain analysis to cover key market narratives.
In 2024, he expanded his expertise at BeInCrypto, collaborating with analysts and using tools like Glassnode, Santiment, and IntoTheBlock to break down Bitcoin and altcoin trends.
At CCN, Victor covers the top cryptocurrencies, memecoins, macro shifts, blending real-time insights with deep-dive metrics.
He holds a Bachelor’s degree in Physics from the University of Ibadan, equipping him to simplify complex data for a wide audience. Follow his work or connect on LinkedIn or X.