Bulls successfully invalidate the DOT downtrend | Credit: Hameem Sarwar
Share
Key Takeaways
The DOT has broken its December downtrend, as indicators suggest that buyers remain in control.
A break above the $2.40 resistance zone would likely open a path toward the $3 target.
If momentum fades and DOT’s price loses reclaimed support, the rally could unwind.
Polkadot’s (DOT) price resumed the new year in unprecedented fashion.
As XRP set the pace with a notable uptrend during the first few days of January, the DOT coin price followed a similar path.
At the time of writing, Polkadot’s price has broken out of its December downtrend. In the process, the altcoin has reclaimed critical resistance levels.
Notably, over the past seven days, DOT has gained 26.23%, outperforming XRP’s 21.35% rise.
This relative strength points to accelerating upside momentum and improving market confidence in Polkadot.
More importantly, it suggests that DOT is not simply reacting to broader market optimism but is actively forming its own bullish structure.
Is Polkadot’s rally strong enough to reach $3? Let’s check the charts.
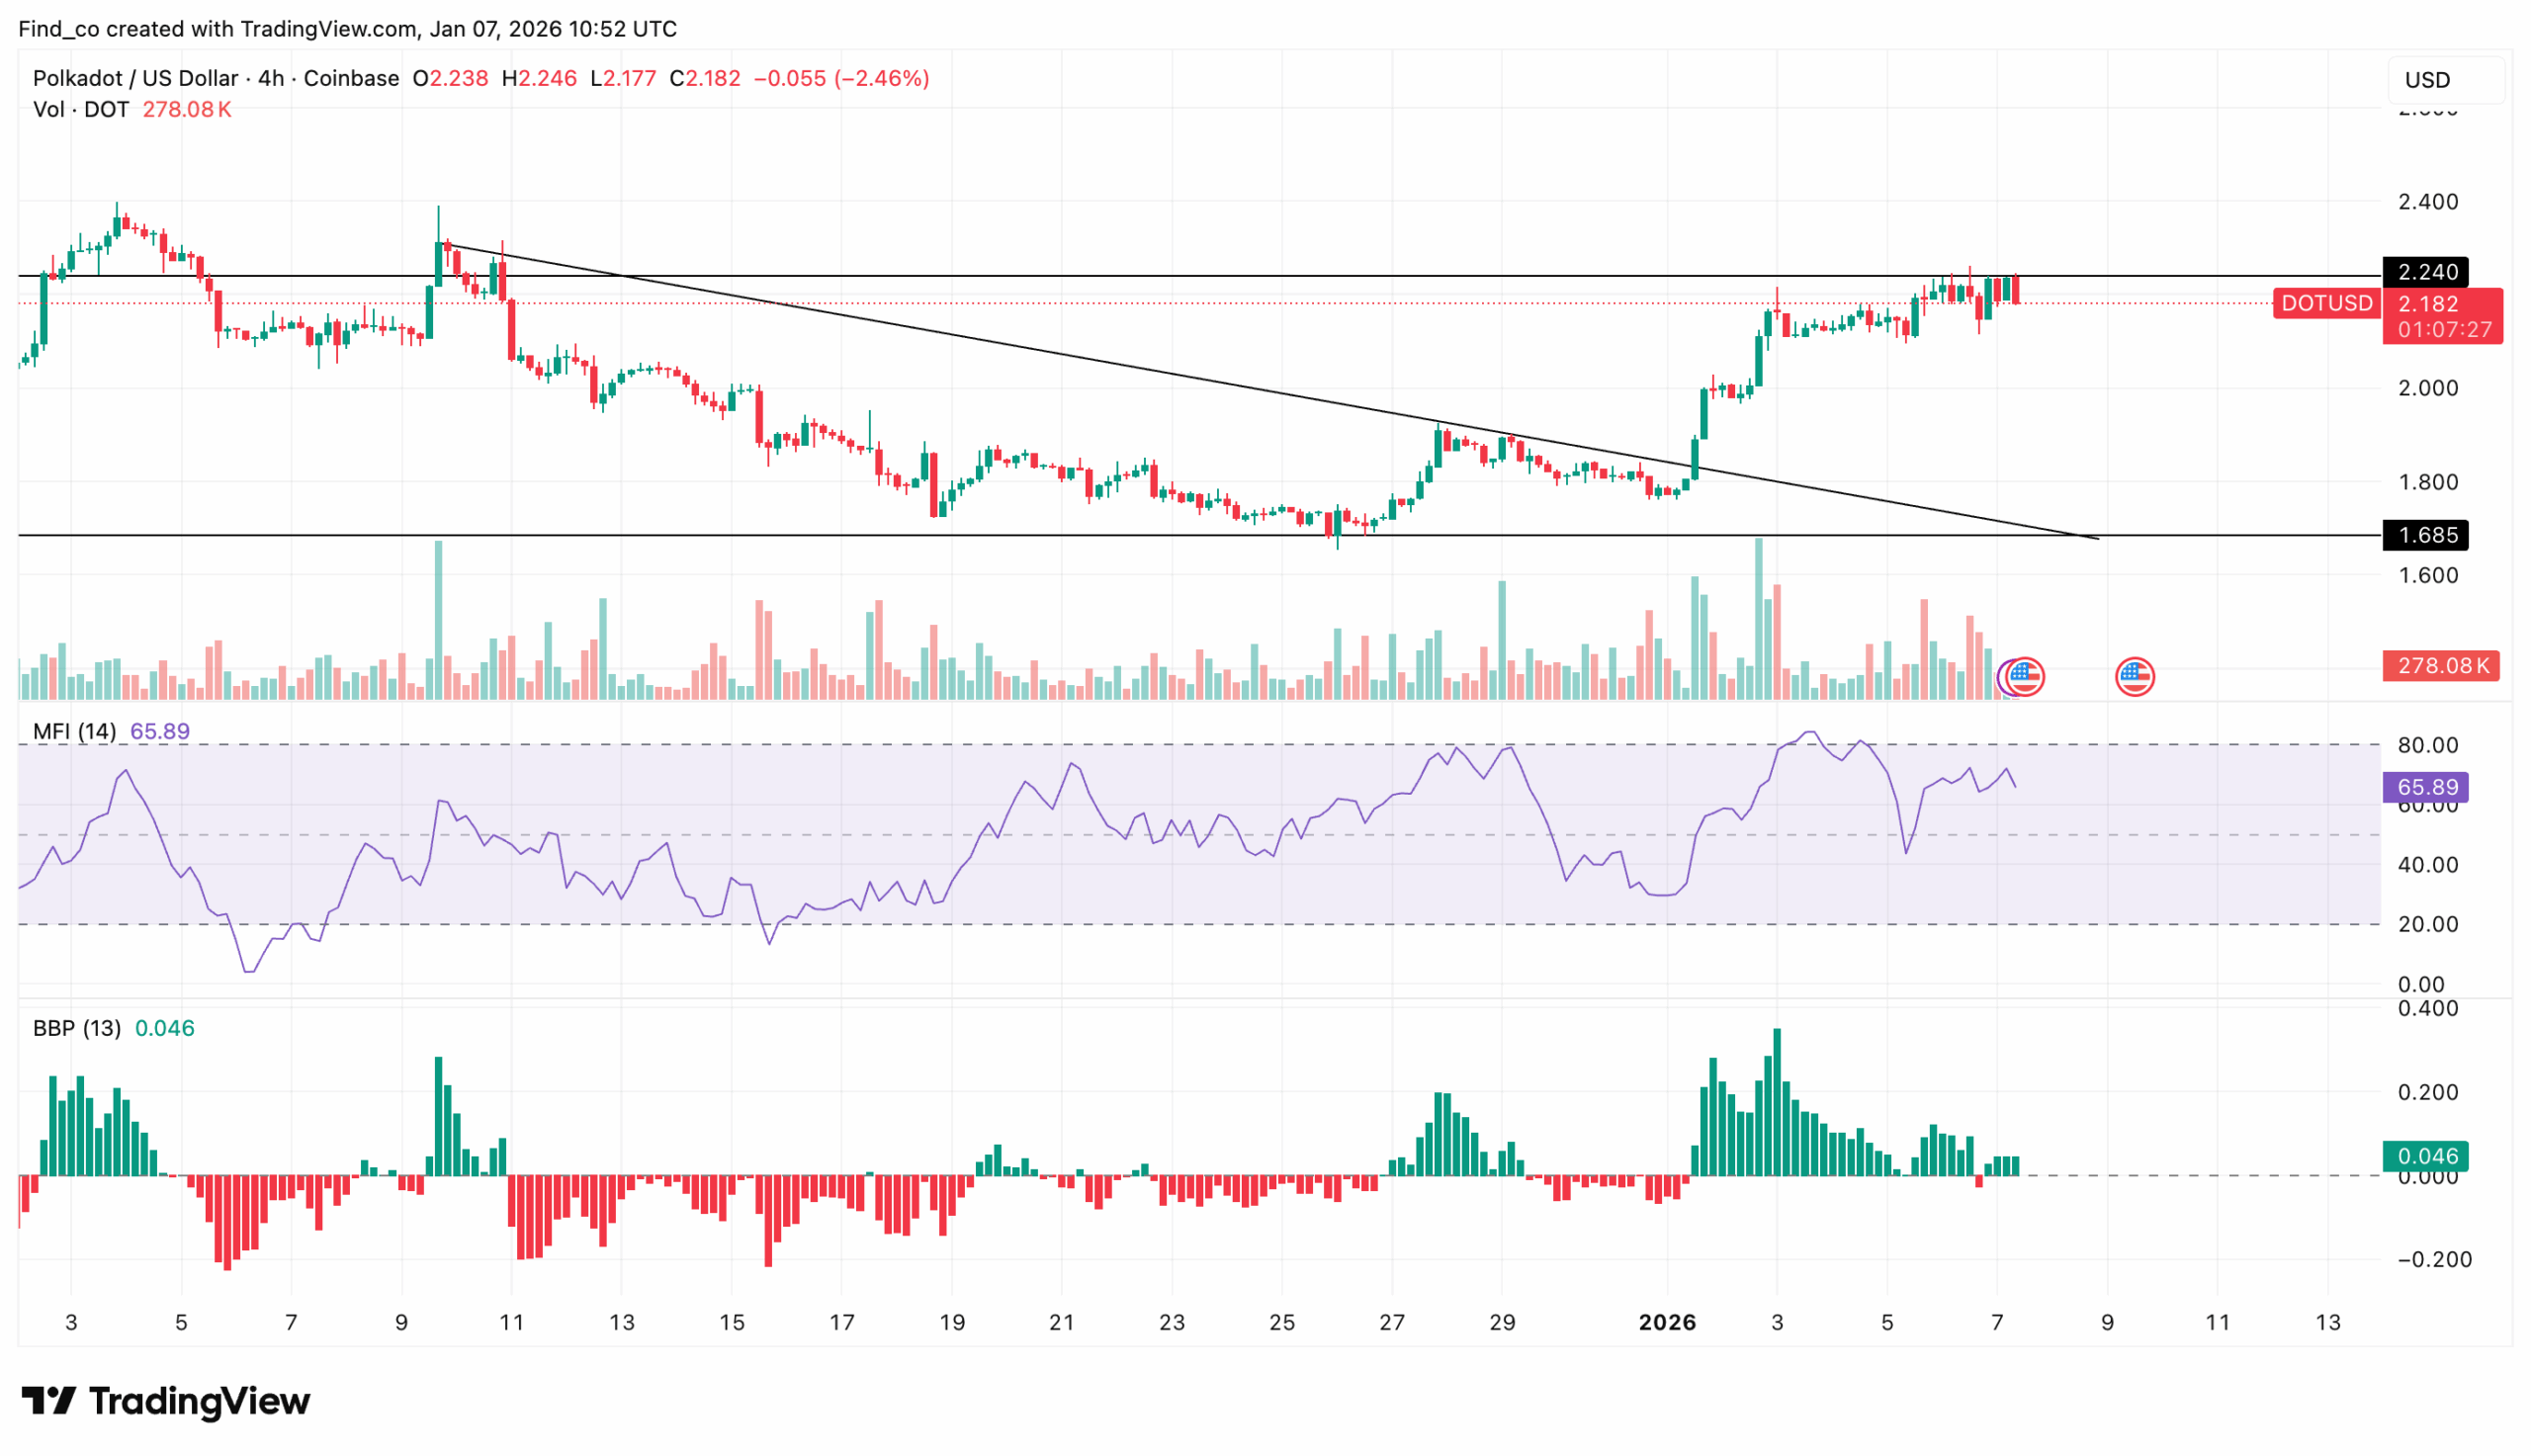
Bullish Pressure Builds Steadily
A look at the 4-hour chart shows that the Money Flow Index (MFI) reading has increased.
Hovering around 69.52, the MFI reflects sustained buying pressure for DOT.
At the same time, the Bull-Bear Power (BBP) indicator reinforces the improving bullish structure on the chart.
As seen below, the BBP histogram has shifted into positive territory and continues to print green bars.
This position signifies growing upside pressure as buyers push prices further away from recent lows, confirming that the December downtrend has been structurally invalidated.
A sustained MFI above 65, alongside a consistently positive BBP reading, would indicate ongoing capital rotation into the asset and reinforce bullish control of the trend.
Under this setup, a break above the $2.30 to $2.40 resistance zone could pave the way for a medium-term rally toward the psychological $3 level.
DOT Price Action Signals Strength
A similar technical structure emerged during XRP’s early January breakout. During that period, sustained momentum preceded its extended breakout.
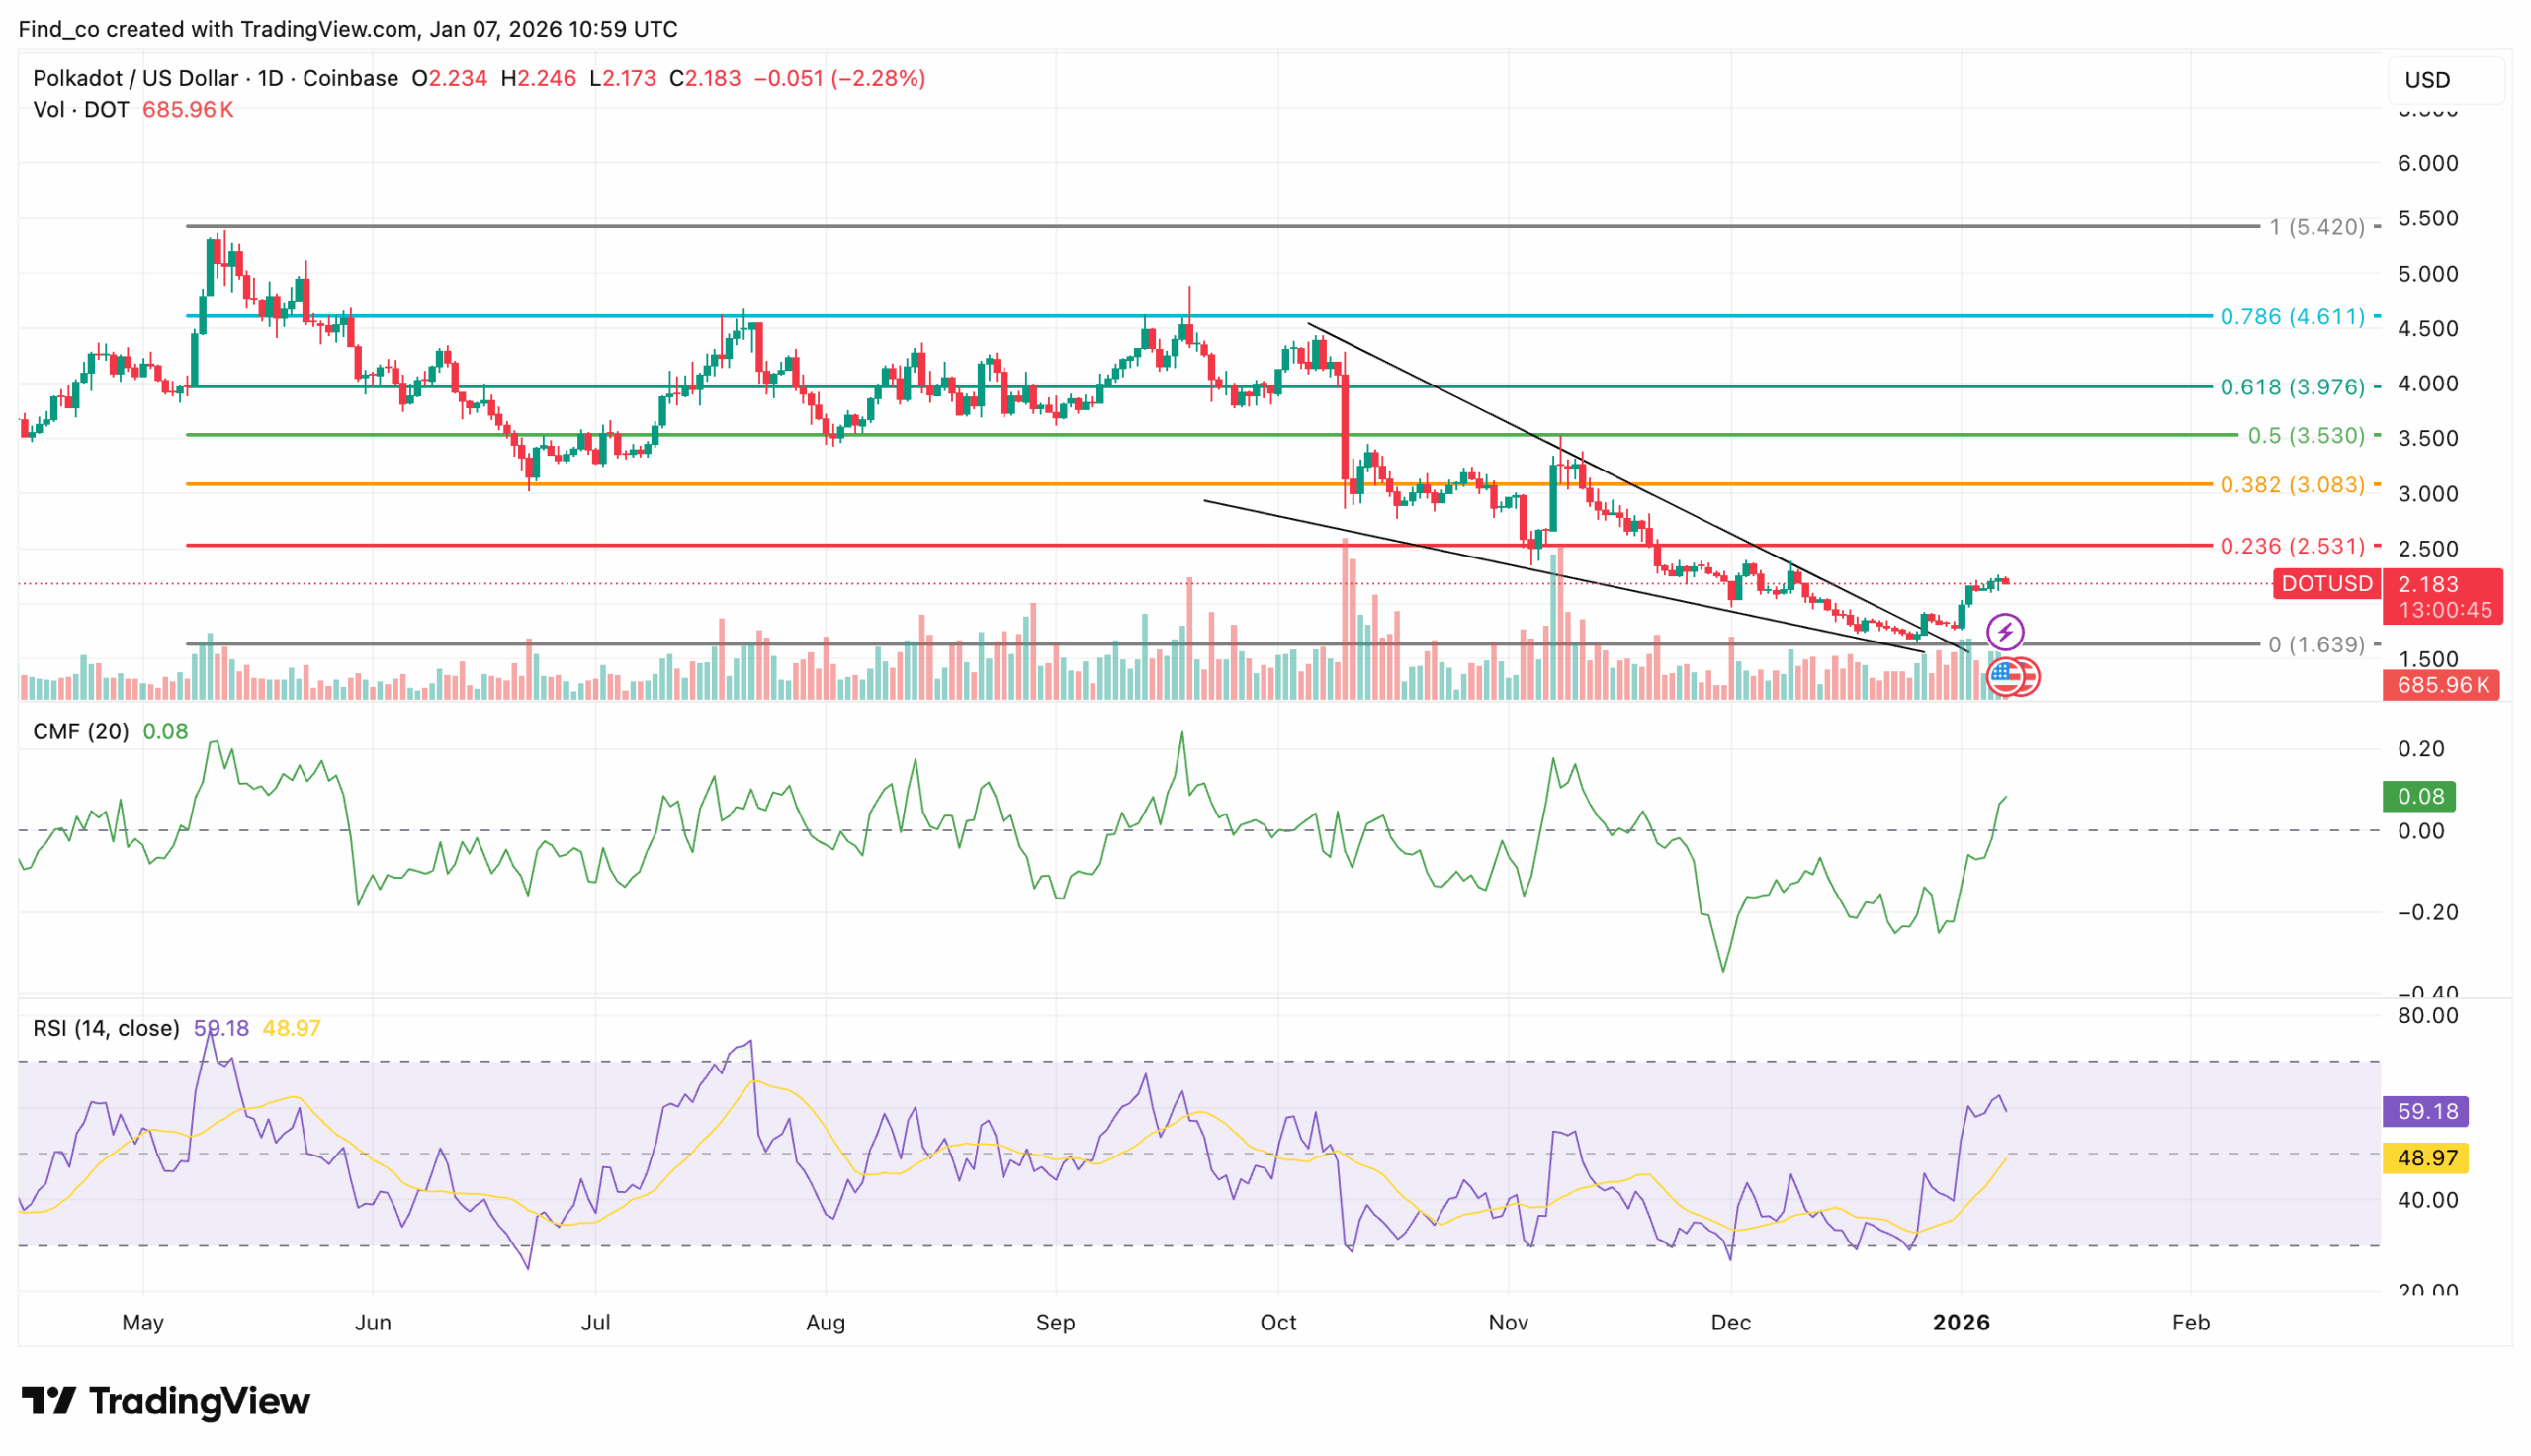
On the daily timeframe, CCN observed that the DOT coin price has broken out of its prolonged downtrend and is now advancing toward its nearest resistance zone.
This move marks a notable shift in the technical setup, as sellers lose control following weeks of price compression.
Supporting this breakout, the Chaikin Money Flow (CMF) remains in positive territory, pointing to strengthening buying volume.
In addition, the Relative Strength Index (RSI) reinforces the bullish outlook.
The indicator has climbed steadily above the neutral 50 level, signaling growing upside momentum.
This position suggests buyers remain firmly in control, with room for further upside before exhaustion becomes a concern.
Additionally, the Fibonacci retracement levels offer insight into the price targets that DOT can potentially reach.
As shown on the chart, DOT’s price has broken out of a falling wedge pattern and now trades around $2.23. Currently, it sits just below its near-term resistance at $2.39.
As it stands, a daily close above this level would likely confirm the breakout. If sustained, this would likely open the door for a rally toward the next major resistance near the psychological $3 mark.
However, if the DOT coin price fails to sustain its upward momentum and reverses, downside risk would come back into focus.
In that case, price could slide toward the zero Fibonacci level at $1.64.
Disclaimer:
The information provided in this article is for informational purposes only. It is not intended to be, nor should it be construed as, financial advice. We do not make any warranties regarding the completeness, reliability, or accuracy of this information. All investments involve risk, and past performance does not guarantee future results. We recommend consulting a financial advisor before making any investment decisions.
Victor Olanrewaju is a crypto analyst and reporter at CCN with deep roots in on-chain research and technical analysis. His crypto journey began in 2017, but it was the 2020 Uniswap airdrop that sparked a full-time pivot into the space.
With a foundation in copywriting, Victor honed his craft creating high-converting content for leading crypto brokers — most notably an XRP price prediction that ranked #1 on Google during the 2021 bull run.
He later joined AMBCrypto in 2022, where he combined storytelling with technical and on-chain analysis to cover key market narratives.
In 2024, he expanded his expertise at BeInCrypto, collaborating with analysts and using tools like Glassnode, Santiment, and IntoTheBlock to break down Bitcoin and altcoin trends.
At CCN, Victor covers the top cryptocurrencies, memecoins, macro shifts, blending real-time insights with deep-dive metrics.
He holds a Bachelor’s degree in Physics from the University of Ibadan, equipping him to simplify complex data for a wide audience. Follow his work or connect on LinkedIn or X.