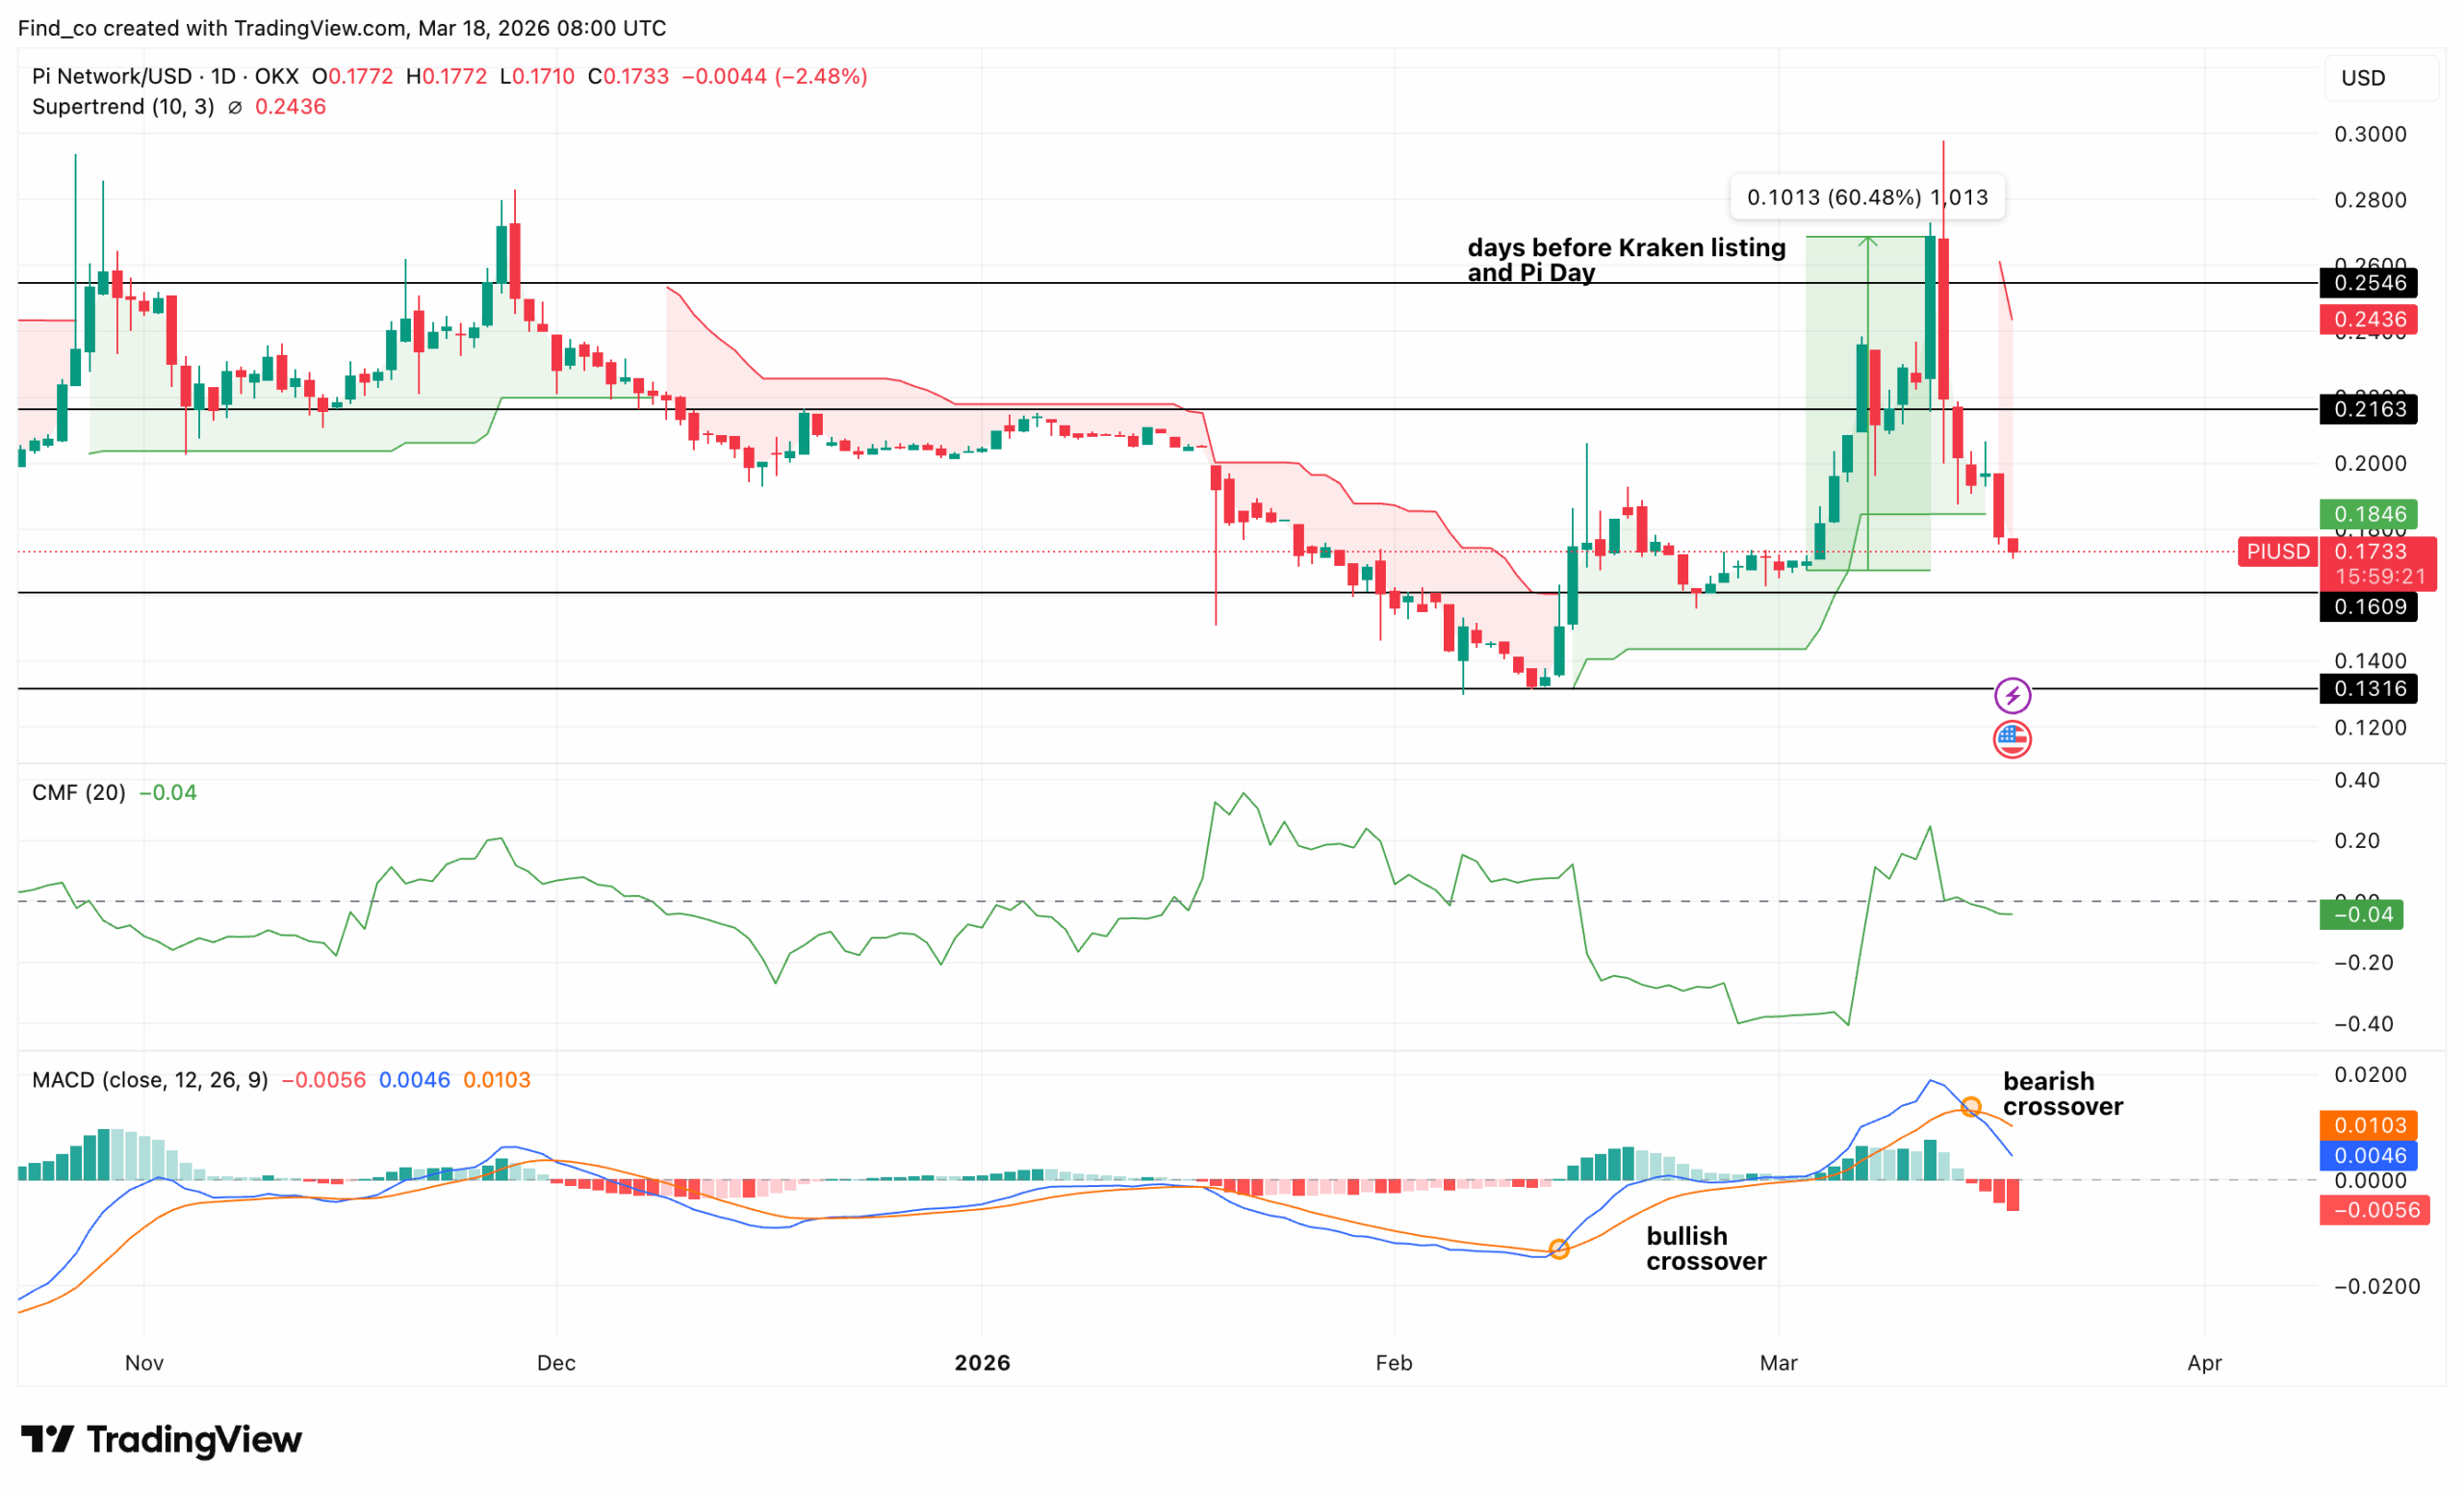
But at the time of writing, PI trades at $0.17. On the daily chart, the Pi Network price has given back nearly all of its gains.
The indicators reflect that reversal with precision. The MACD has printed a bearish crossover, as shown directly on the chart.
This is the mirror image of the bullish crossover that launched the rally in early February.
Furthermore, the Chaikin Money Flow (CMF) has dropped to -0.04, indicating rising distribution.
In addition, the Supertrend at $0.24 is now well overhead in bearish mode as the price is trading beneath it for the first time since the golden cross on March 13.
Consequently, the levels that matter now are supports, not targets. The $0.16 floor (where the Kraken-driven move began) is the immediate test.
Below that, $0.13 is the next structural support. Reclaiming $0.22 on a daily close would be the first sign the sellers are exhausted, but as it stands, that seems unlikely.
Considering this outlook, it appears that the Kraken listing and “Pi Day” were a buy-the-rumour, sell-the-news dynamic.
Consequently, there were no new buyers left to push the price higher.
PI Price Prediction: Lower
Going forward, the 4-hour chart adds a layer of nuance that changes the near-term picture, and it cuts both ways.
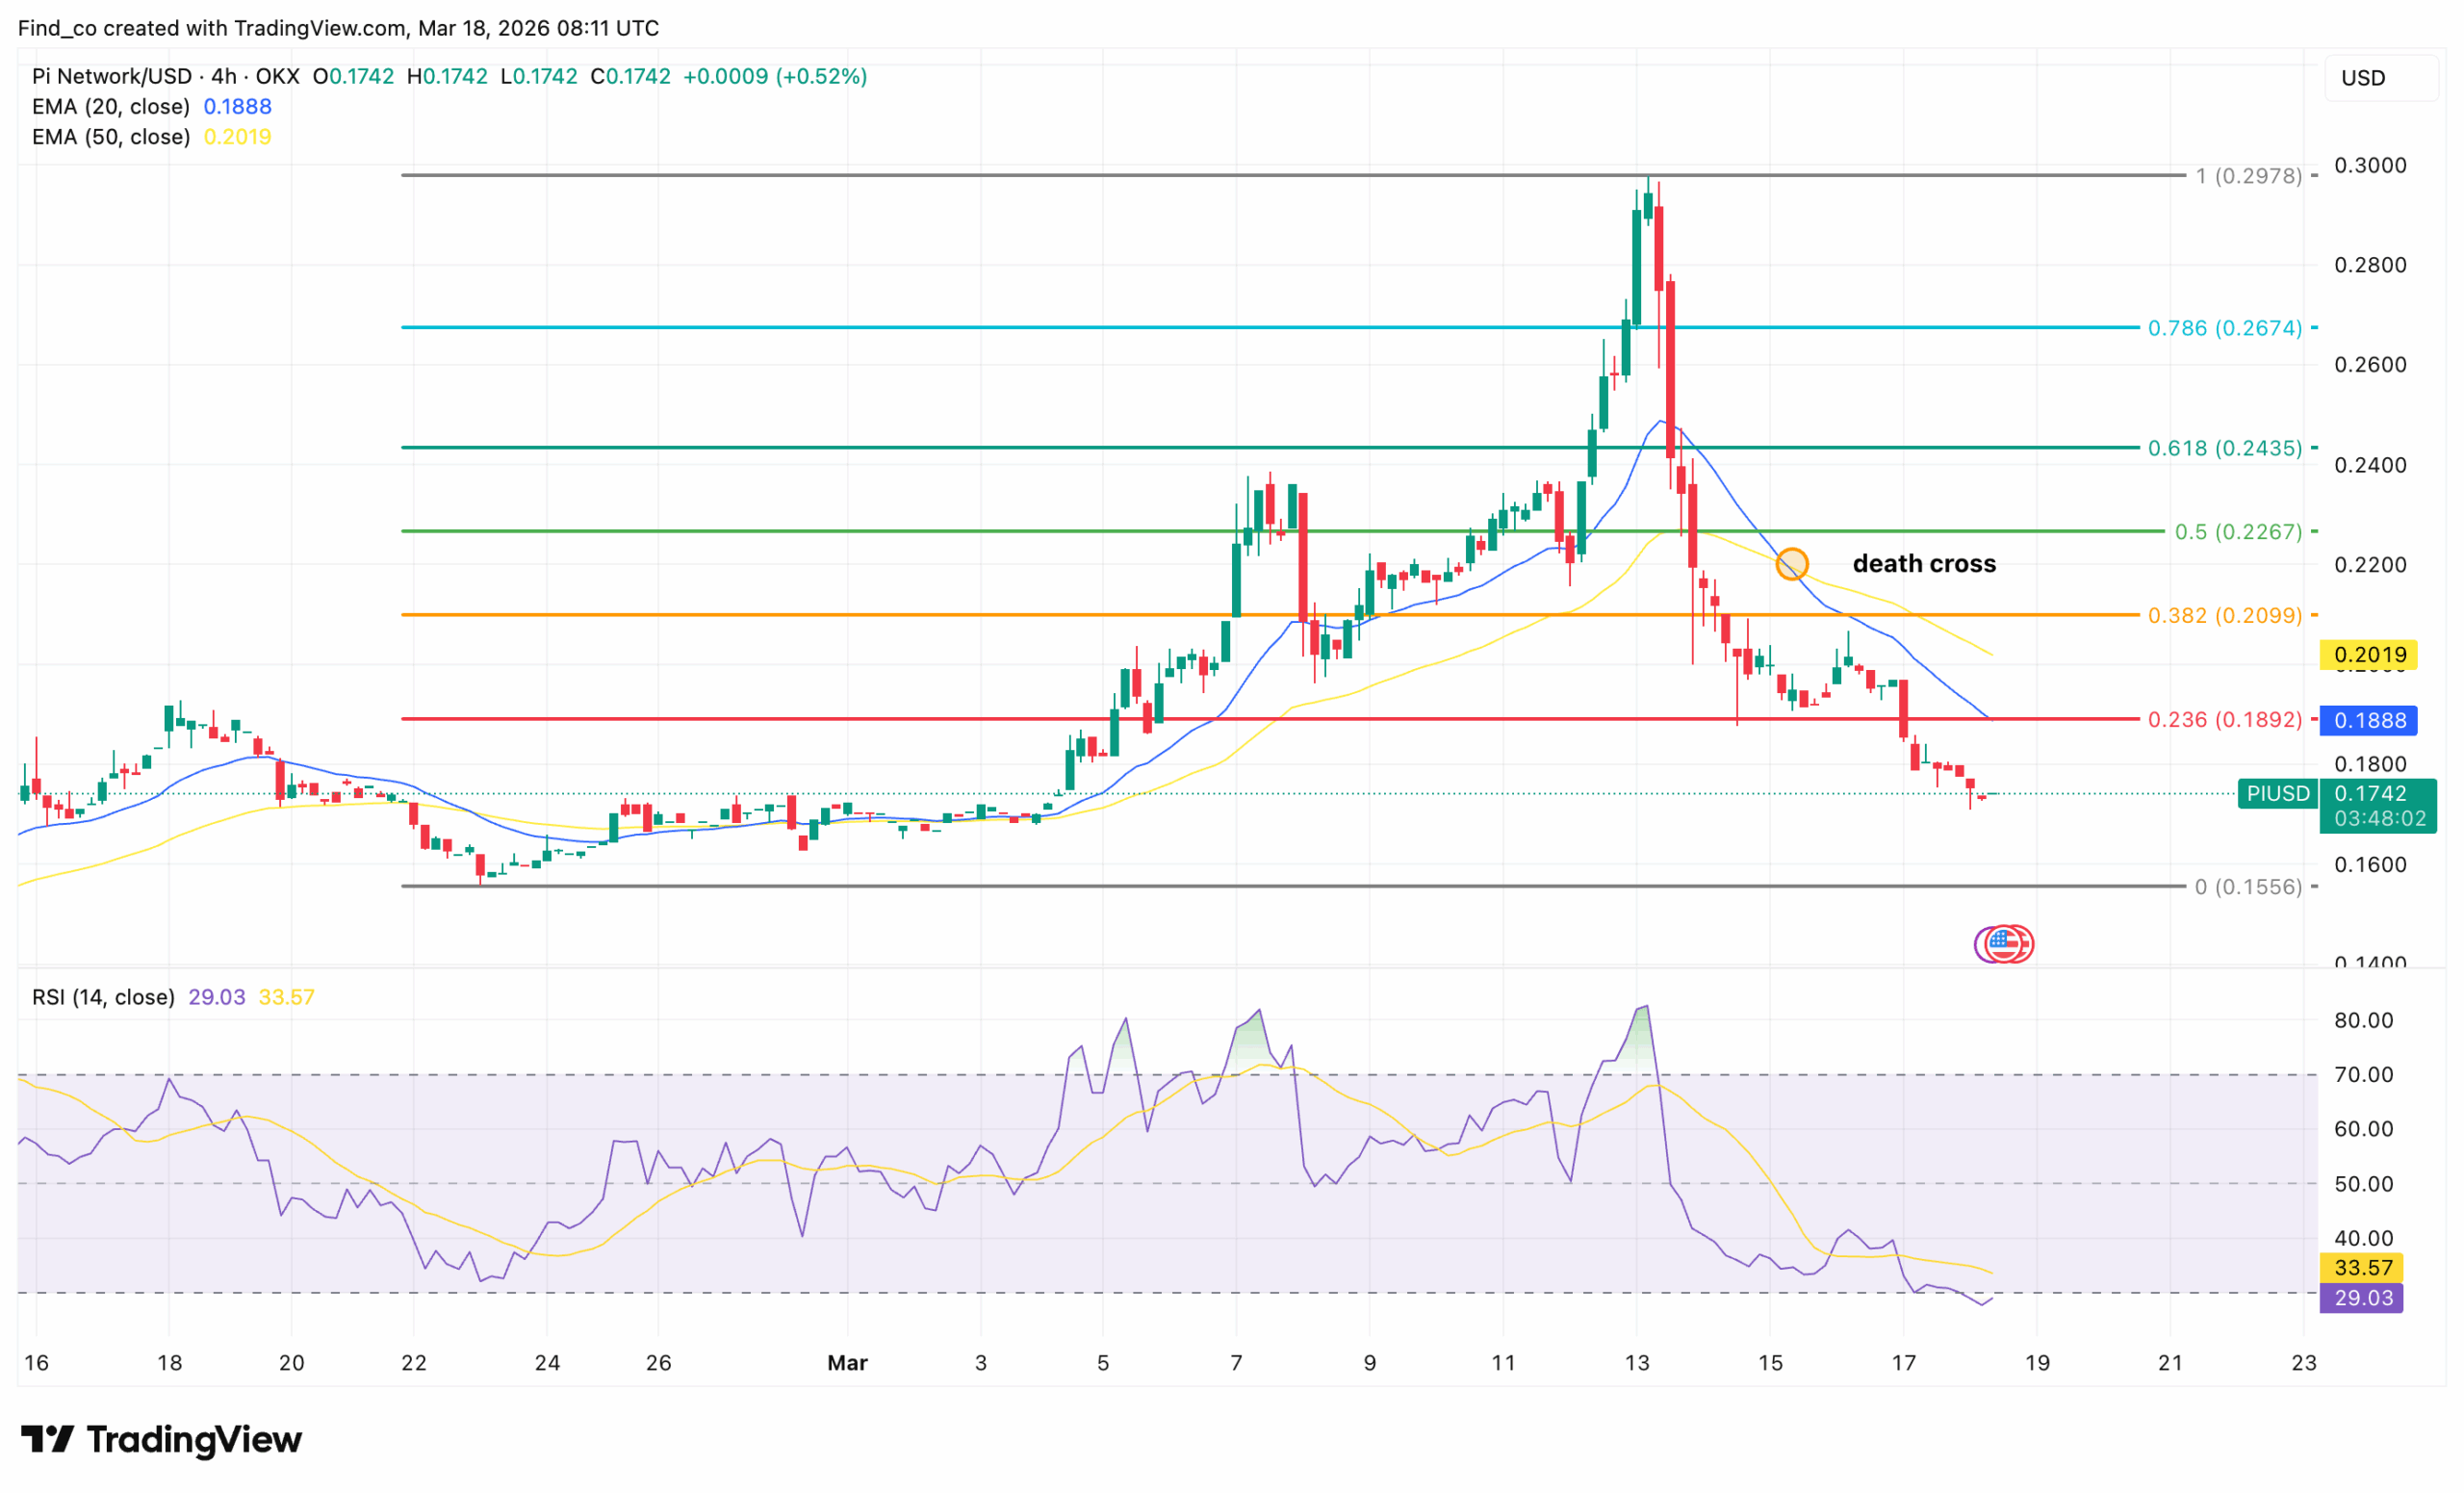
As seen below, the Pi Network price has printed a death cross. Here, the 20-EMA ($0.19) has crossed below the 50-EMA ($0.20).
This has confirmed that short-term momentum has definitively flipped negative following the Kraken/Pi Day catalyst reversal.
However, the RSI tells a competing story that demands equal attention.
The RSI line at 29.03 has dropped into oversold territory for the first time since the February lows.
The signal line at 33.57 is also deeply depressed. Crucially, the last time RSI reached these levels on this chart, PI’s price was near the bottom that launched the entire 60% rally.
Furthermore, the zero Fib at $0.15 is just below as support, at barely 10% from current levels.
That proximity means the downside risk is now defined and limited.
Conversely, reclaiming the 0.236 Fib at $0.19 would be the first signal of stabilisation, turning former support back into resistance that needs to be cleared.
Is There a Recovery Path for PI?
The honest answer is yes. But it demands realistic expectations about the timeline. The Kraken listing’s fundamental value has not disappeared.
PI is still accessible through one of crypto’s most trusted and regulated exchanges.
However, the recovery path from a buy-the-rumour, sell-the-news event is typically slower than the initial rally that preceded it.
The next meaningful catalyst for Pi Network must be a development that the market has not already priced in.
That could take the form of an unexpected major exchange listing, a significant ecosystem announcement, or a broader altcoin market rally that lifts PI alongside its peers.
Disclaimer:
The information provided in this article is for informational purposes only. It is not intended to be, nor should it be construed as, financial advice. We do not make any warranties regarding the completeness, reliability, or accuracy of this information. All investments involve risk, and past performance does not guarantee future results. We recommend consulting a financial advisor before making any investment decisions.
Victor Olanrewaju is a crypto analyst and reporter at CCN with deep roots in on-chain research and technical analysis. His crypto journey began in 2017, but it was the 2020 Uniswap airdrop that sparked a full-time pivot into the space.
With a foundation in copywriting, Victor honed his craft creating high-converting content for leading crypto brokers — most notably an XRP price prediction that ranked #1 on Google during the 2021 bull run.
He later joined AMBCrypto in 2022, where he combined storytelling with technical and on-chain analysis to cover key market narratives.
In 2024, he expanded his expertise at BeInCrypto, collaborating with analysts and using tools like Glassnode, Santiment, and IntoTheBlock to break down Bitcoin and altcoin trends.
At CCN, Victor covers the top cryptocurrencies, memecoins, macro shifts, blending real-time insights with deep-dive metrics.
He holds a Bachelor’s degree in Physics from the University of Ibadan, equipping him to simplify complex data for a wide audience. Follow his work or connect on LinkedIn or X.