Is Pi Network Dead in 2026? What Pioneers Need to Know
Share
Key Takeaways
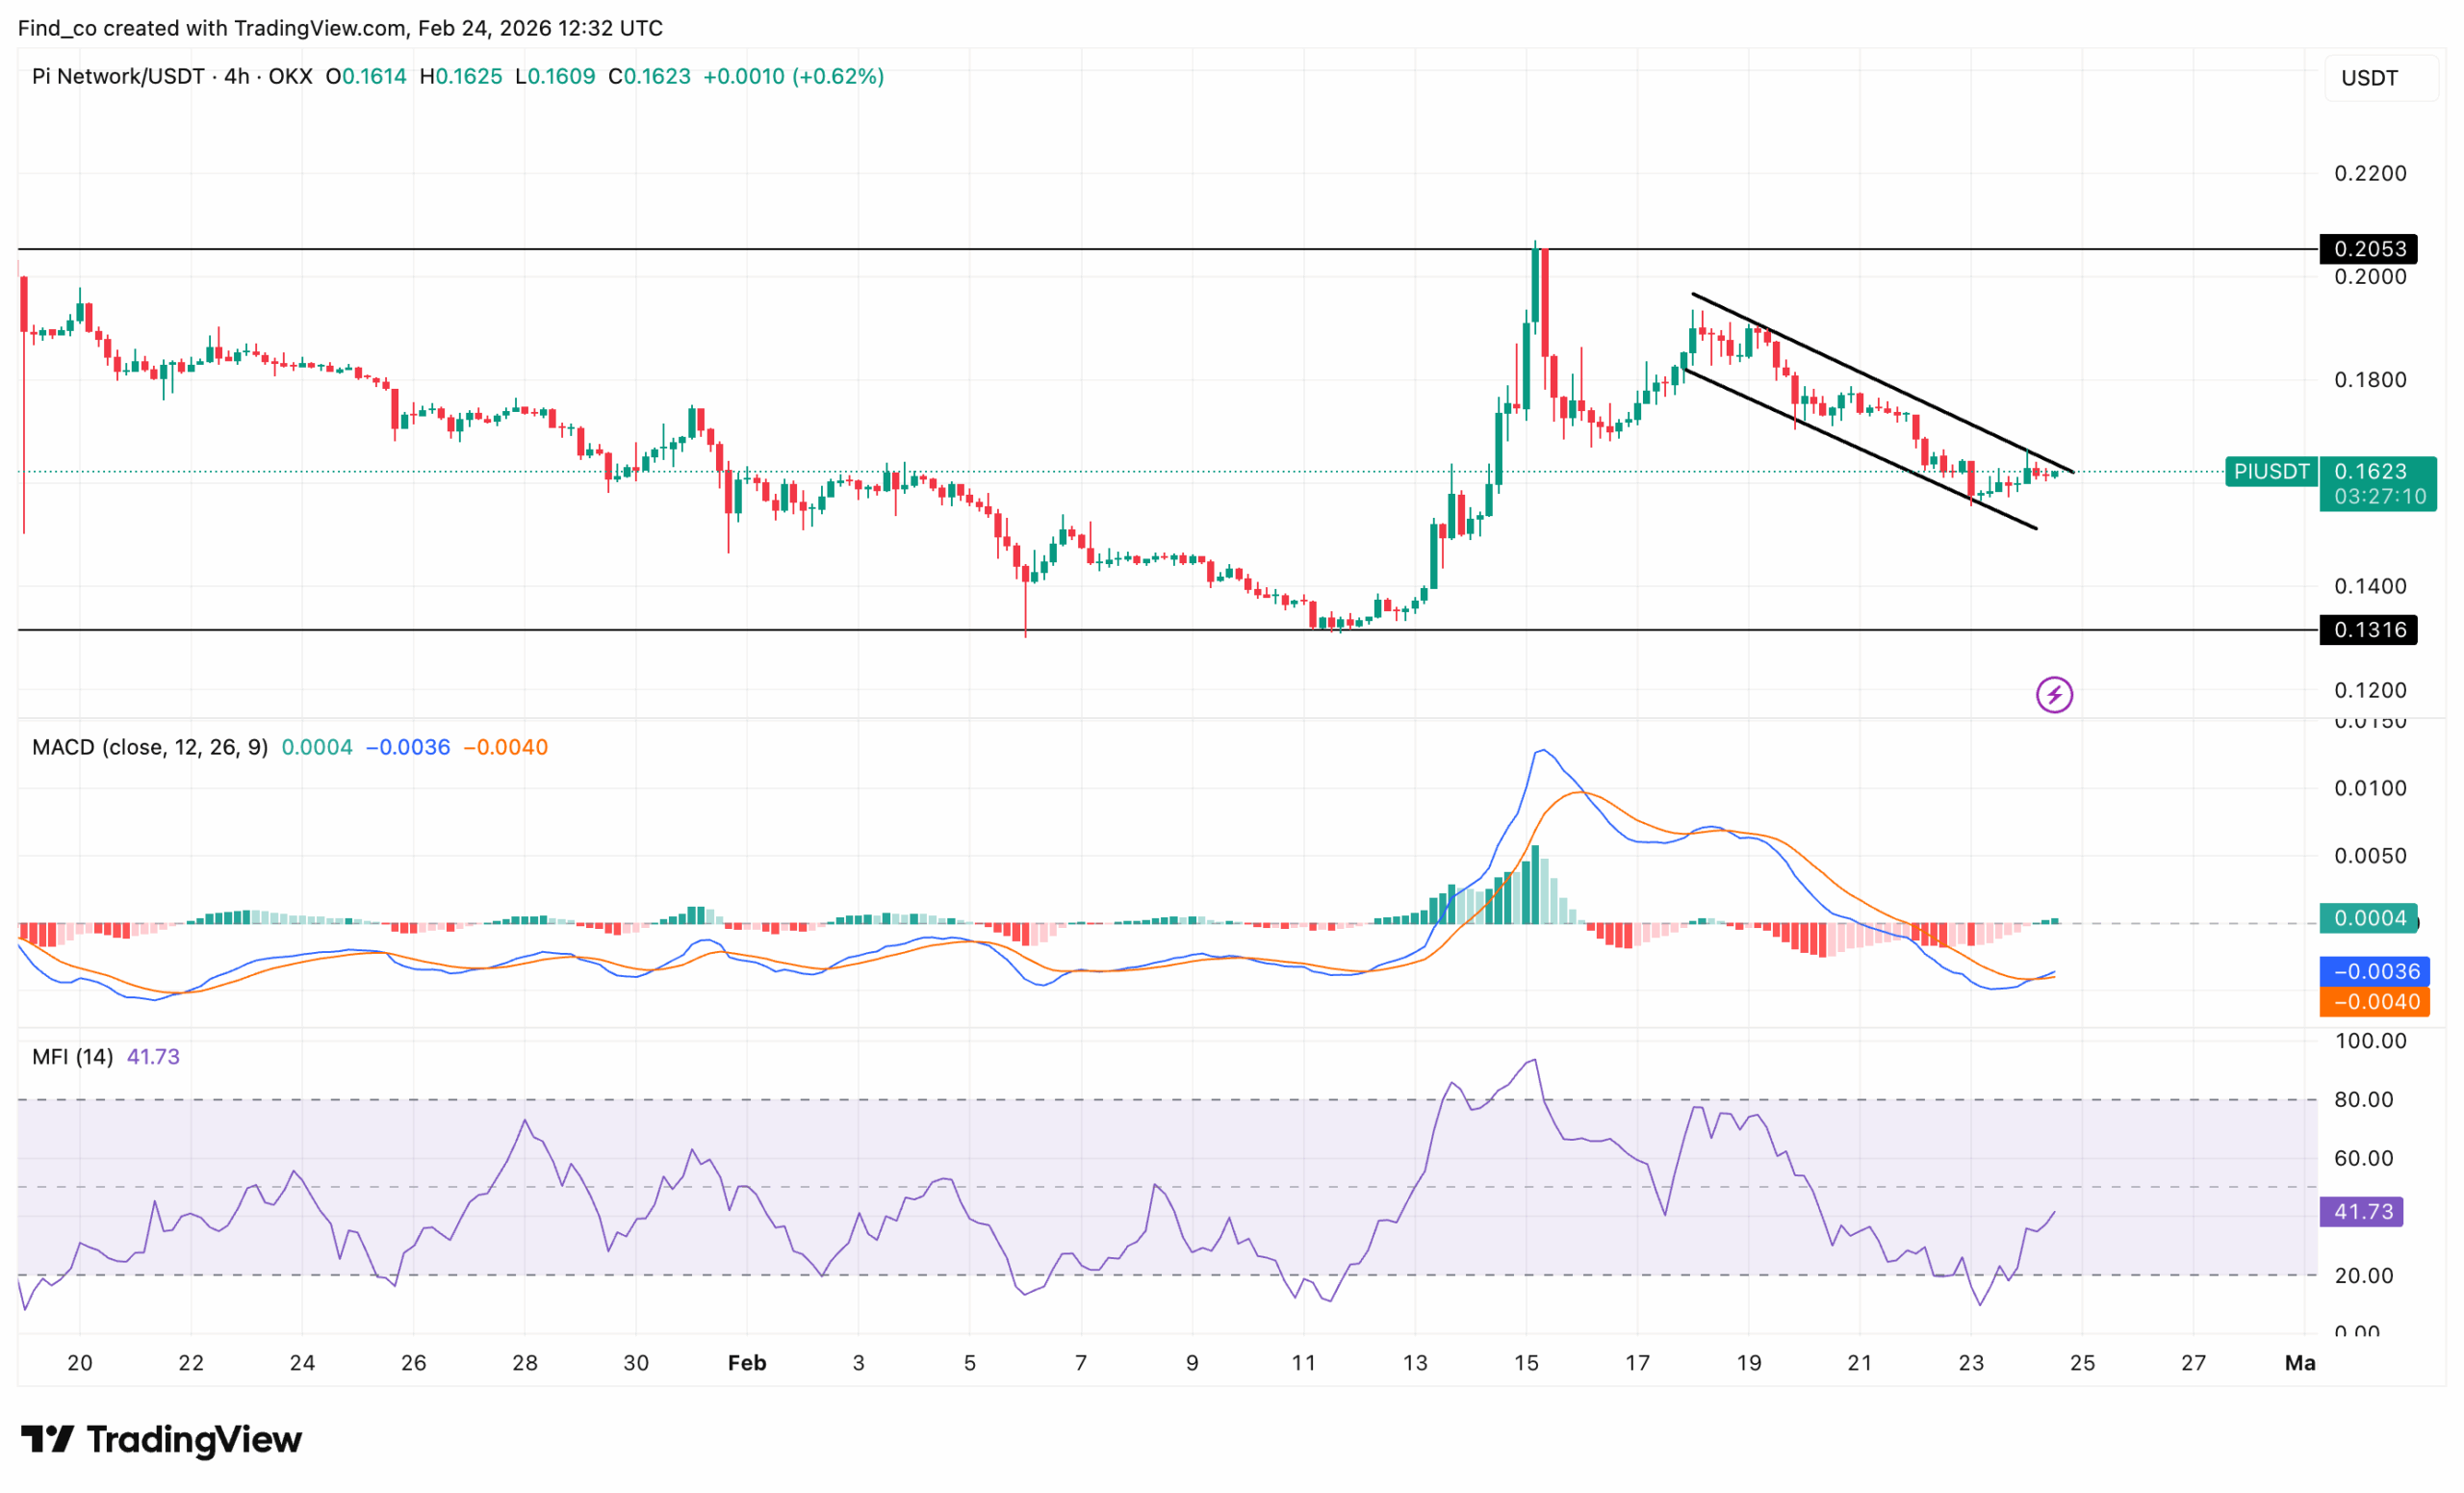
PI is consolidating near the lower end following a sharp move that tested $0.20 area.
On the 4-hour chart, the PI coin price is poised to breach the $0.16 resistance level.
Analysis indicates the Pi Network coin will likely continue consolidating in the short term.
Pi Network (PI) is attempting to steady its footing one year after its Feb. 20, 2025, mainnet launch.
At the time of writing, the cryptocurrency trades near $0.16. Interestingly, this represents a 94.58% decline from its all-time high of $2.98.
Sellers tried to push lower. However, buyers stepped in.
Now, the most important question is: Is this the bottom for the Pi Network price before the next big move, or not?
Capital Slowly Rotates Into PI Coin
PI trended downward through late January and early February. Then buyers triggered a vertical breakout, sending the Pi Network price briefly toward $0.20.
However, that spike failed fast as sellers stepped in aggressively.
Consequently, the price formed lower highs, confirming the weakening of bullish pressure.
Moreover, the chart shows a horizontal demand zone near $0.13. That level acted as strong support during the earlier sell-off. Therefore, it remains the key downside target if selling resumes.
The Moving Average Convergence Divergence (MACD) recently crossed downward and remains below zero. That signals trend exhaustion rather than expansion.
Meanwhile, the histogram bars are still red, though they are shrinking. This suggests bearish momentum persists but is losing strength.
At the same time, the Money Flow Index (MFI) is climbing from near-oversold territory. This indicates capital is slowly rotating back in.
Overall, the structure favors consolidation with a bearish tilt. Unless bulls reclaim $0.17, rallies may continue to fade.
Adoption Outpaces Price Action
Since the launch of Open Network, Pi Network has expanded across KYC verification, mainnet migrations, developer activity, and broader ecosystem participation.
“These milestones reflect the steady progress made possible through the collective contributions of pioneers, developers, businesses, and KYC validators around the world.” The team, while highlighting, the role of its community, noted.
So far, about 17.7 million people have fully registered on the platform, indicating that there are real participants on the mainnet ready to transact.
Yet, the price remains near $0.16, below key resistance at $0.21.
If verified users convert into active transaction demand, the $0.13-$0.16 zone could form a long-term base. For now, the metric confirms network growth, not price strength.
PI Price Projection: Corrective Bounce Ongoing
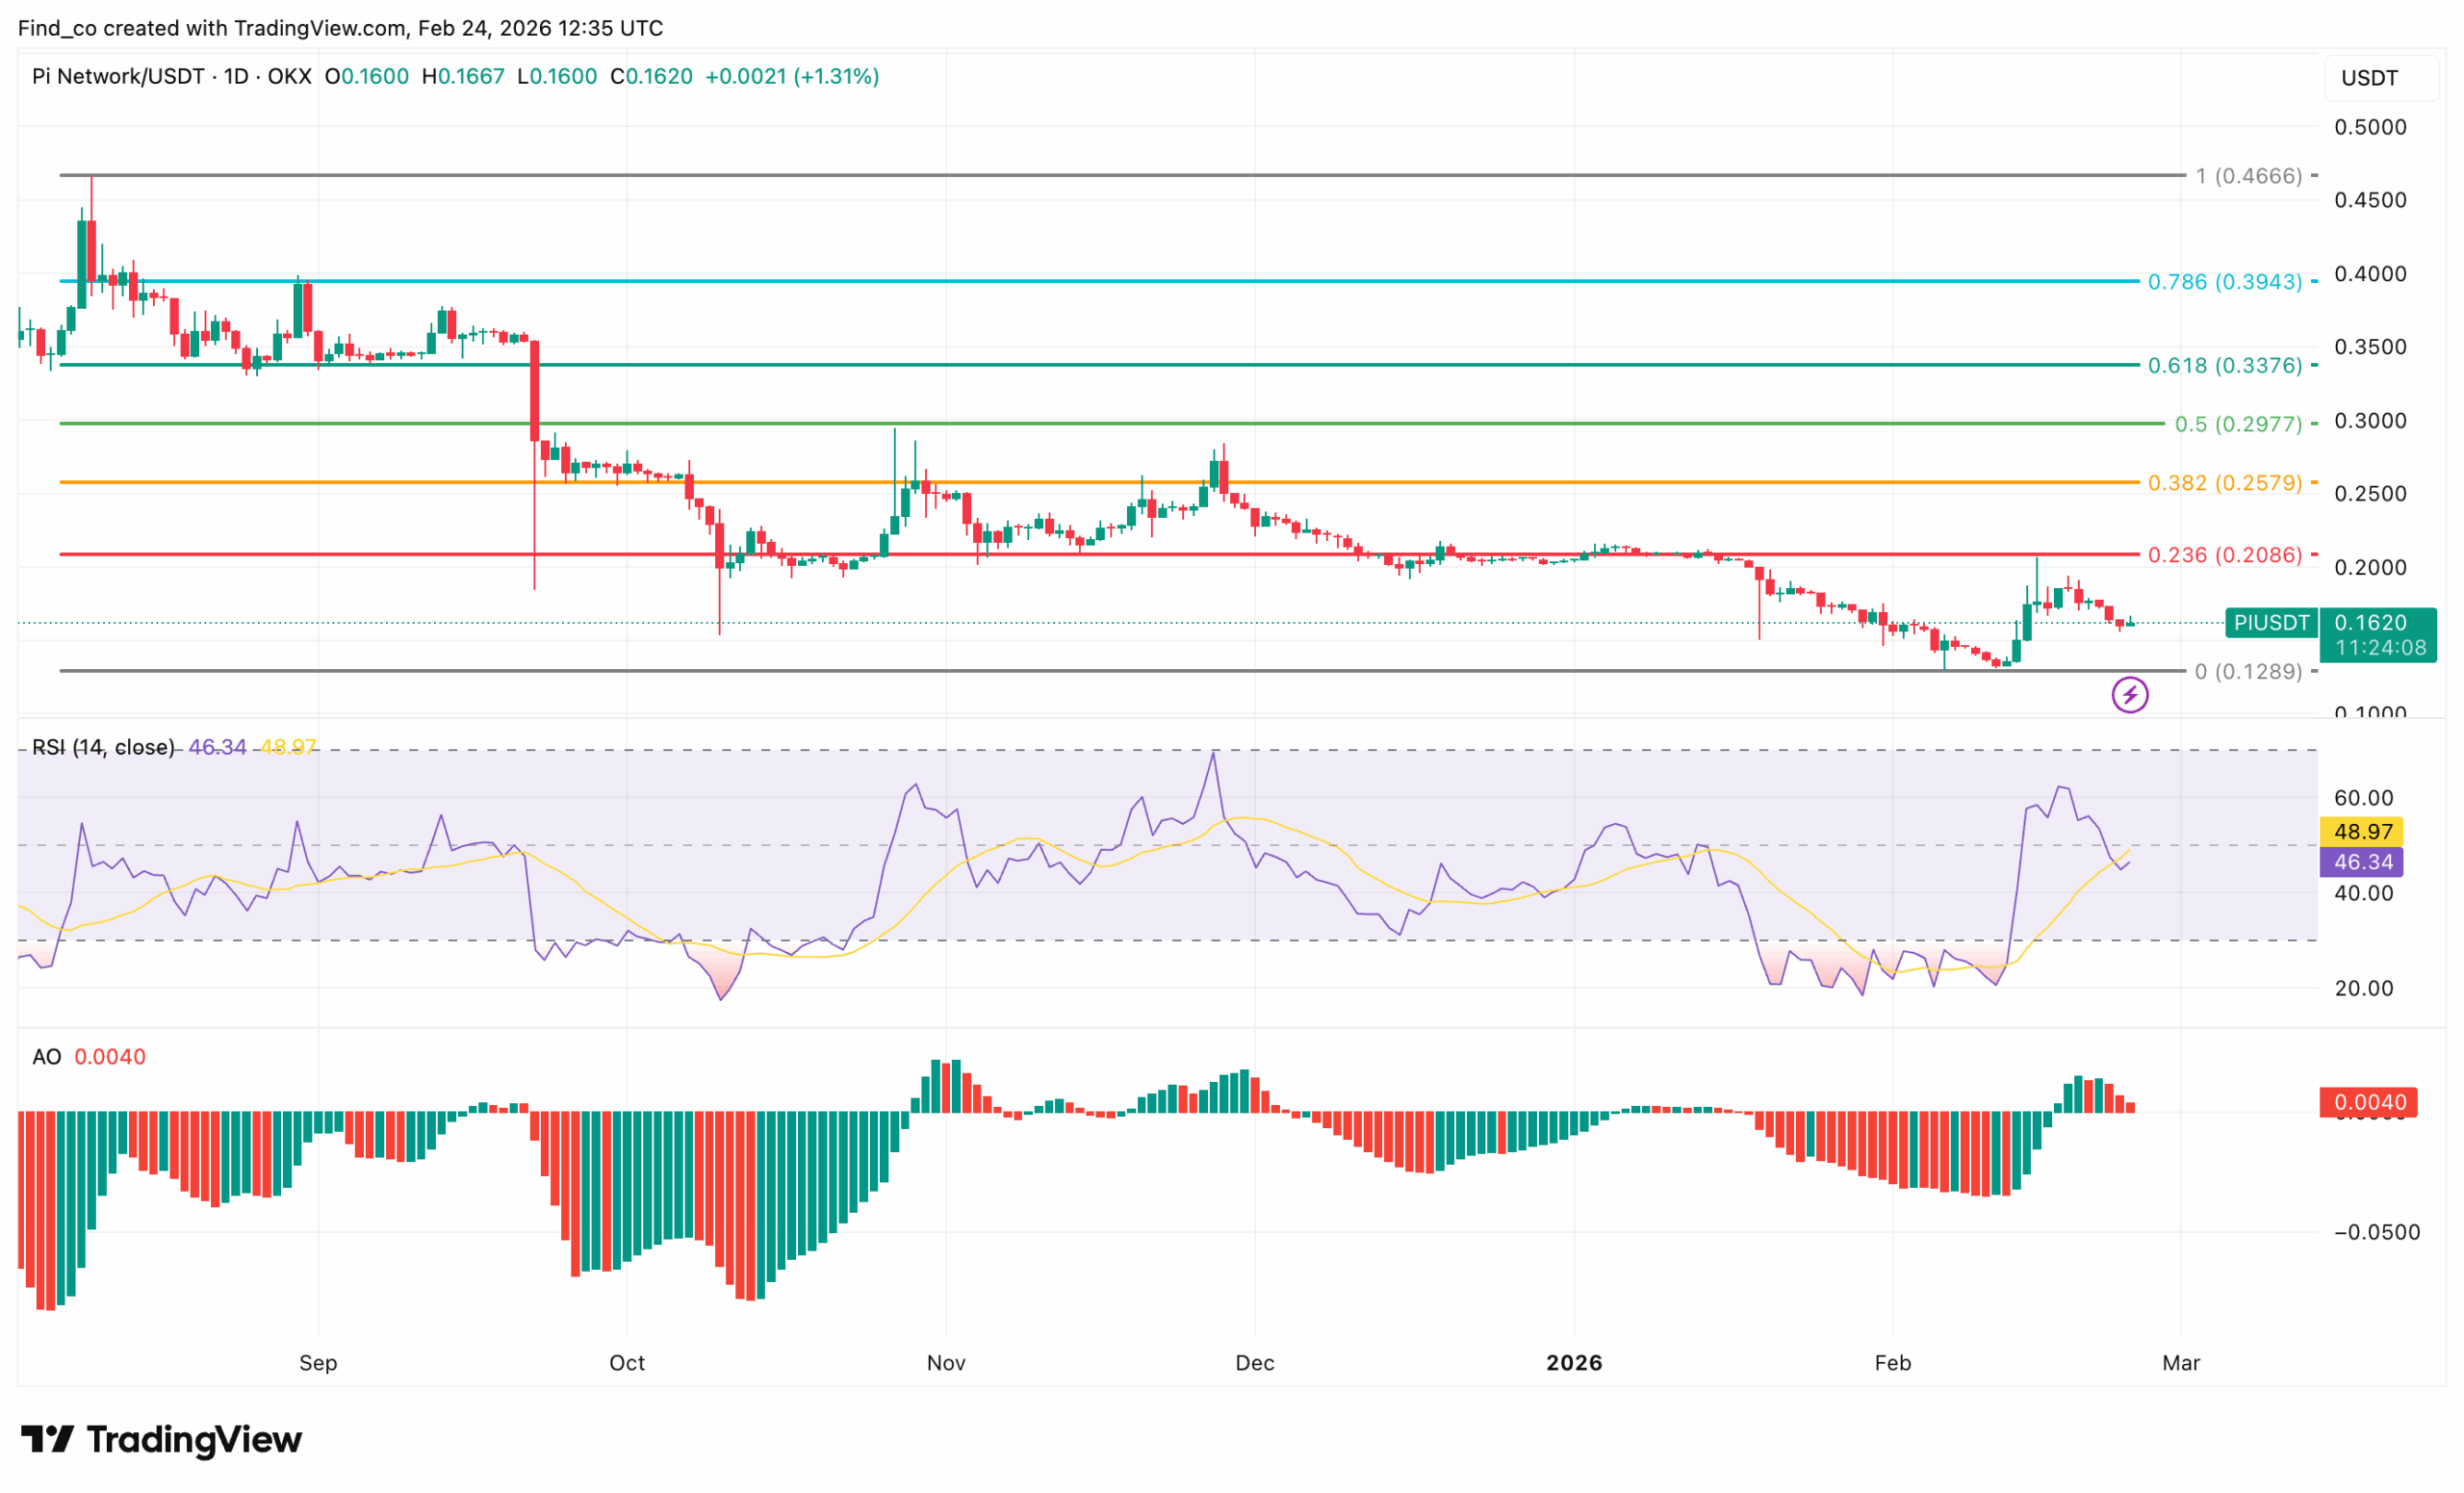
Technically, PI remains in a descending structure marked by a falling trendline that has capped rallies since late 2025. Each rebound has produced a lower high. That pattern is intact.
However, structure is shifting at the lows.
The token recently swept the $0.13 region and quickly reclaimed ground. That sharp rejection signals strong buyer interest at deep discount levels.
Since then, the price has stabilized between $0.15 and $0.17.
Importantly, the Pi Network price trades below key Fibonacci retracement levels. The 0.236 level sits near $0.21, a zone that remains a major resistance barrier. This confirms that sellers still control higher-timeframe momentum.
Momentum indicators, however, signal an early recovery.
The daily relative strength index (RSI) hovers around 46. It has rebounded from oversold territory and is attempting to push toward neutral 50. That suggests selling pressure is fading, though not fully reversed.
Meanwhile, the Awesome Oscillator (AO) has turned green and is printing positive histogram bars.
Momentum is shifting upward in the short term. Yet, the expansion remains modest. No explosive breakout signal, at least not yet.
So, What Defines the Bottom?
First, $0.13 must hold. That level now stands as structural support. A breakdown below it would invalidate the stabilization thesis and expose fresh downside risk.
Second, bulls must reclaim $0.21. A move above the 0.236 Fibonacci level would mark the first meaningful shift in structure. Without that, rallies remain corrective bounces within a larger downtrend.
The bottom may be forming. But it is not proven yet.
Disclaimer:
The information provided in this article is for informational purposes only. It is not intended to be, nor should it be construed as, financial advice. We do not make any warranties regarding the completeness, reliability, or accuracy of this information. All investments involve risk, and past performance does not guarantee future results. We recommend consulting a financial advisor before making any investment decisions.
Victor Olanrewaju is a crypto analyst and reporter at CCN with deep roots in on-chain research and technical analysis. His crypto journey began in 2017, but it was the 2020 Uniswap airdrop that sparked a full-time pivot into the space.
With a foundation in copywriting, Victor honed his craft creating high-converting content for leading crypto brokers — most notably an XRP price prediction that ranked #1 on Google during the 2021 bull run.
He later joined AMBCrypto in 2022, where he combined storytelling with technical and on-chain analysis to cover key market narratives.
In 2024, he expanded his expertise at BeInCrypto, collaborating with analysts and using tools like Glassnode, Santiment, and IntoTheBlock to break down Bitcoin and altcoin trends.
At CCN, Victor covers the top cryptocurrencies, memecoins, macro shifts, blending real-time insights with deep-dive metrics.
He holds a Bachelor’s degree in Physics from the University of Ibadan, equipping him to simplify complex data for a wide audience. Follow his work or connect on LinkedIn or X.