PI coin has surged in the past 30 days, outperforming much of the broader crypto market even as geopolitical tensions drain capital from digital assets
Demand absorbed the 189 million tokens unlocked in February without breaking the price structure.
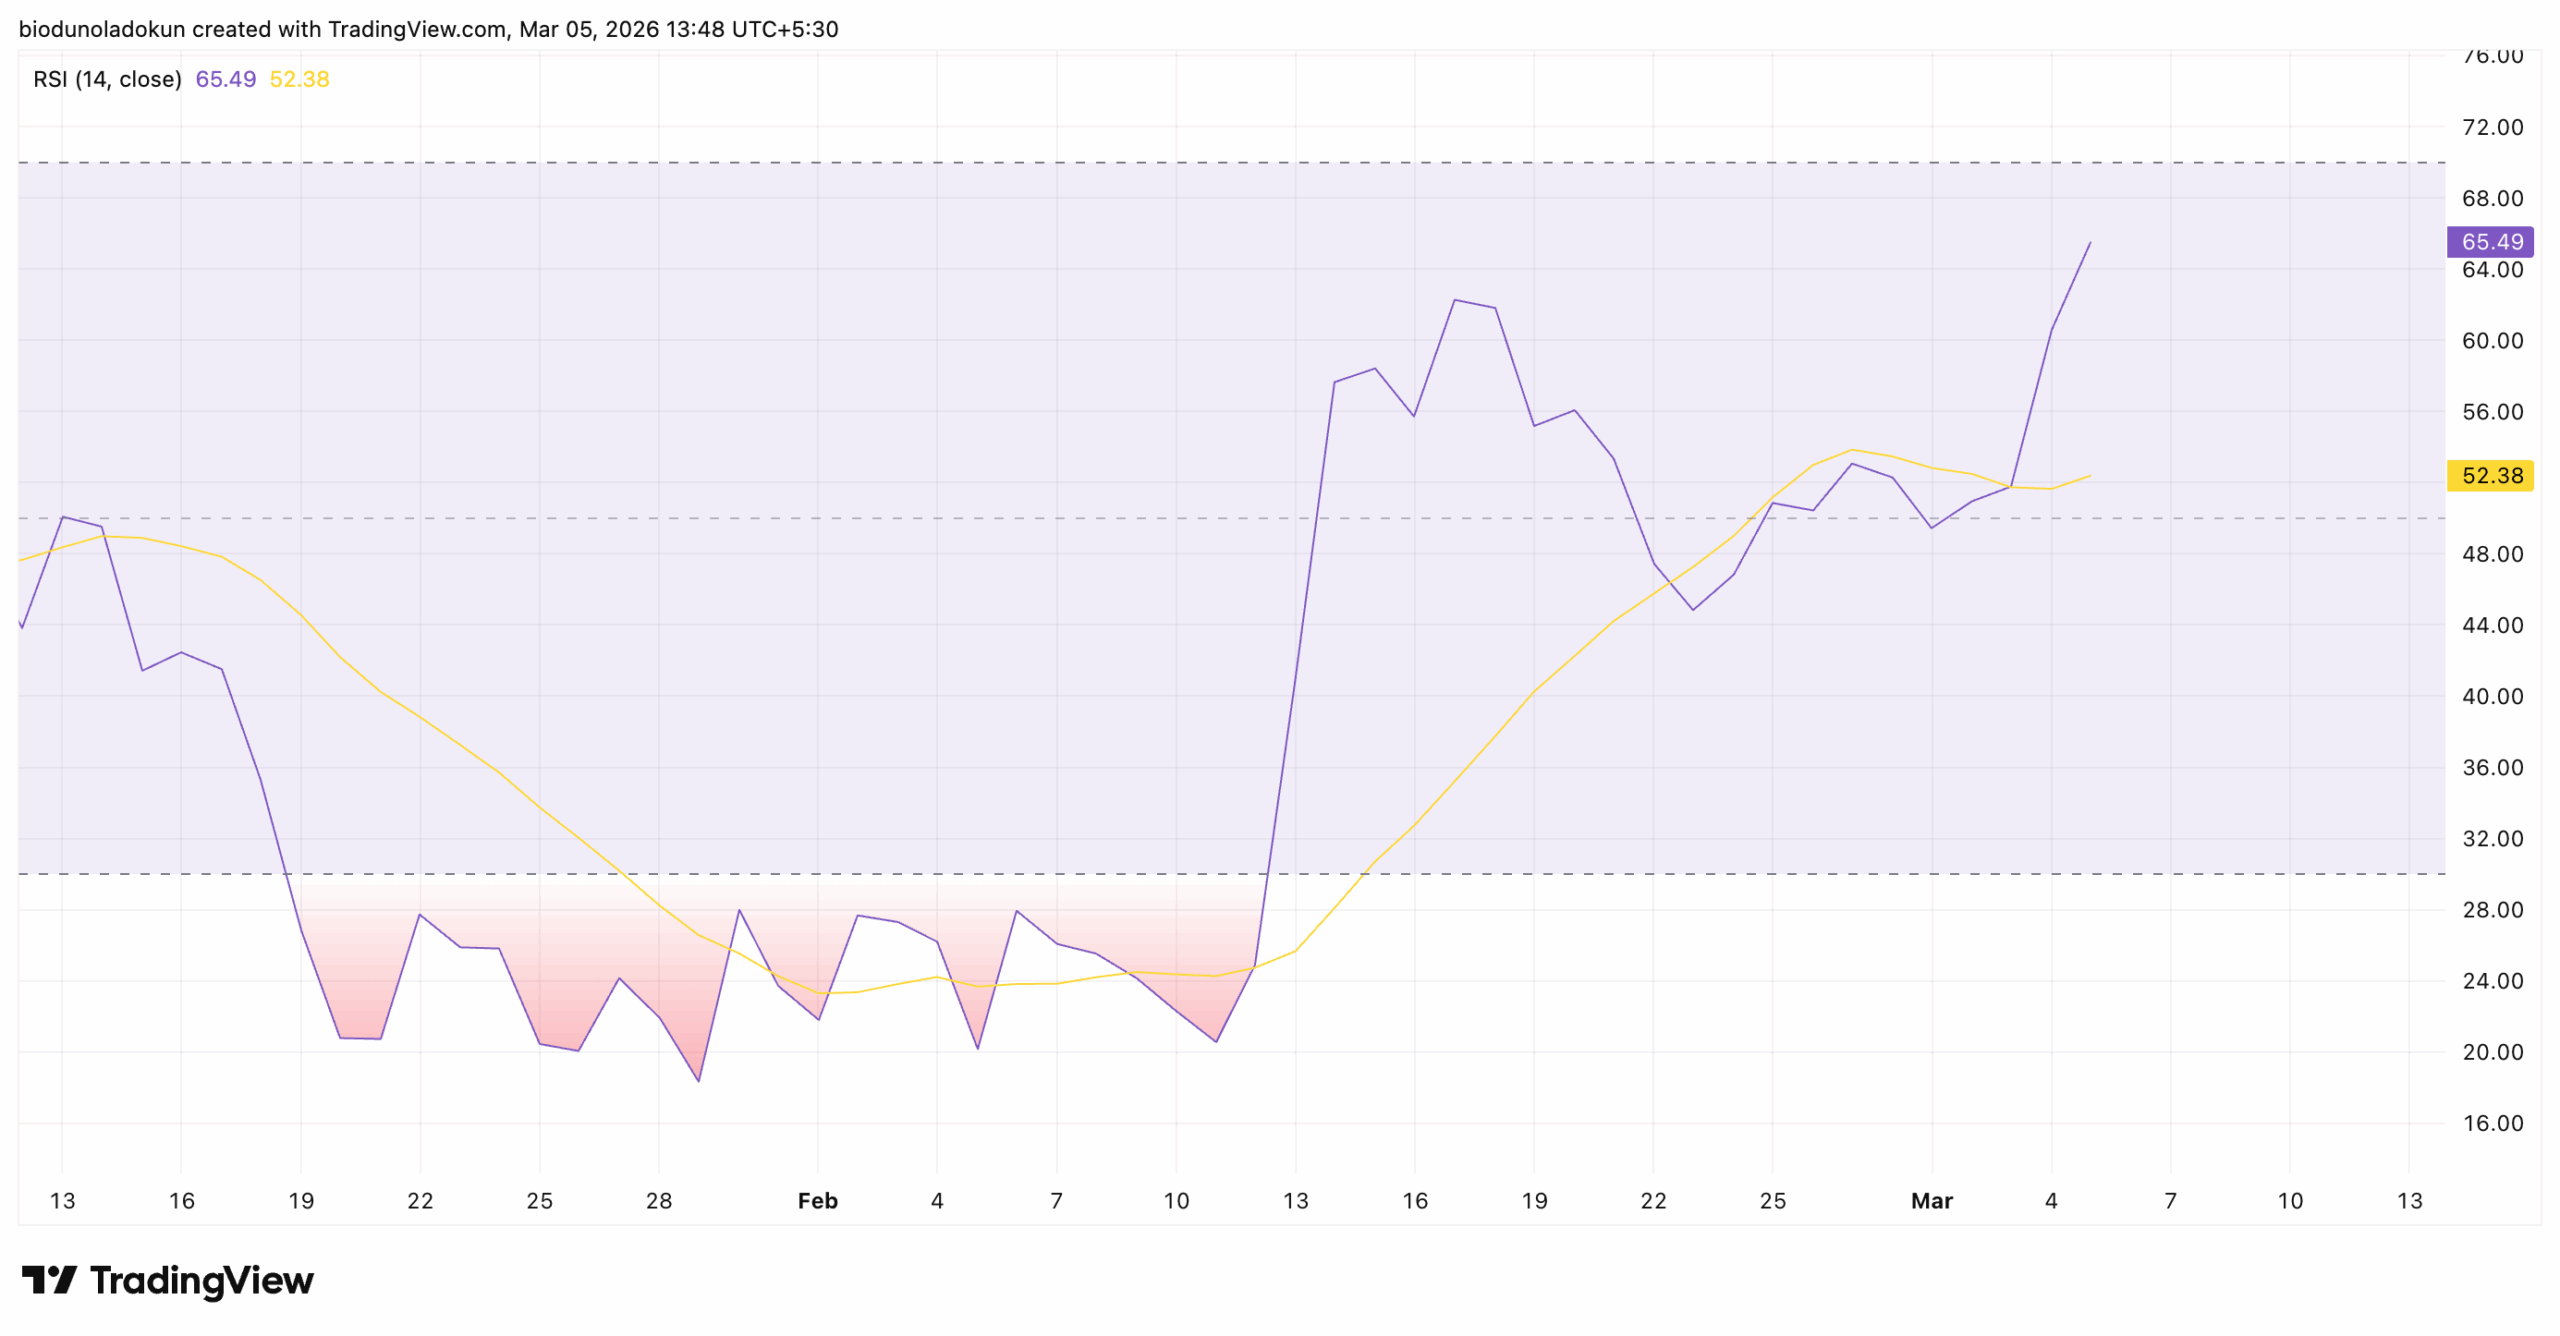
With RSI at 65.49 and price holding above the 20-day EMA, bulls are eyeing a break above $0.222.
The PI token is one of the best performers over the past few weeks, even as much of the broader crypto market has struggled to find direction over the past month.
In the past 30 days, the token’s price has rocketed by over 20%. Geopolitical tensions between the US, Israel, and Iran have forced traders to pull capital out of many digital assets, making PI’s performance all the more notable.
Moreso, much of February’s price surge happened despite the unlocking of 189 million PI tokens into the circulating supply
Large unlock events like this often suppress price. In PI’s case, however, demand appears to have absorbed the supply and is poised to continue doing so.
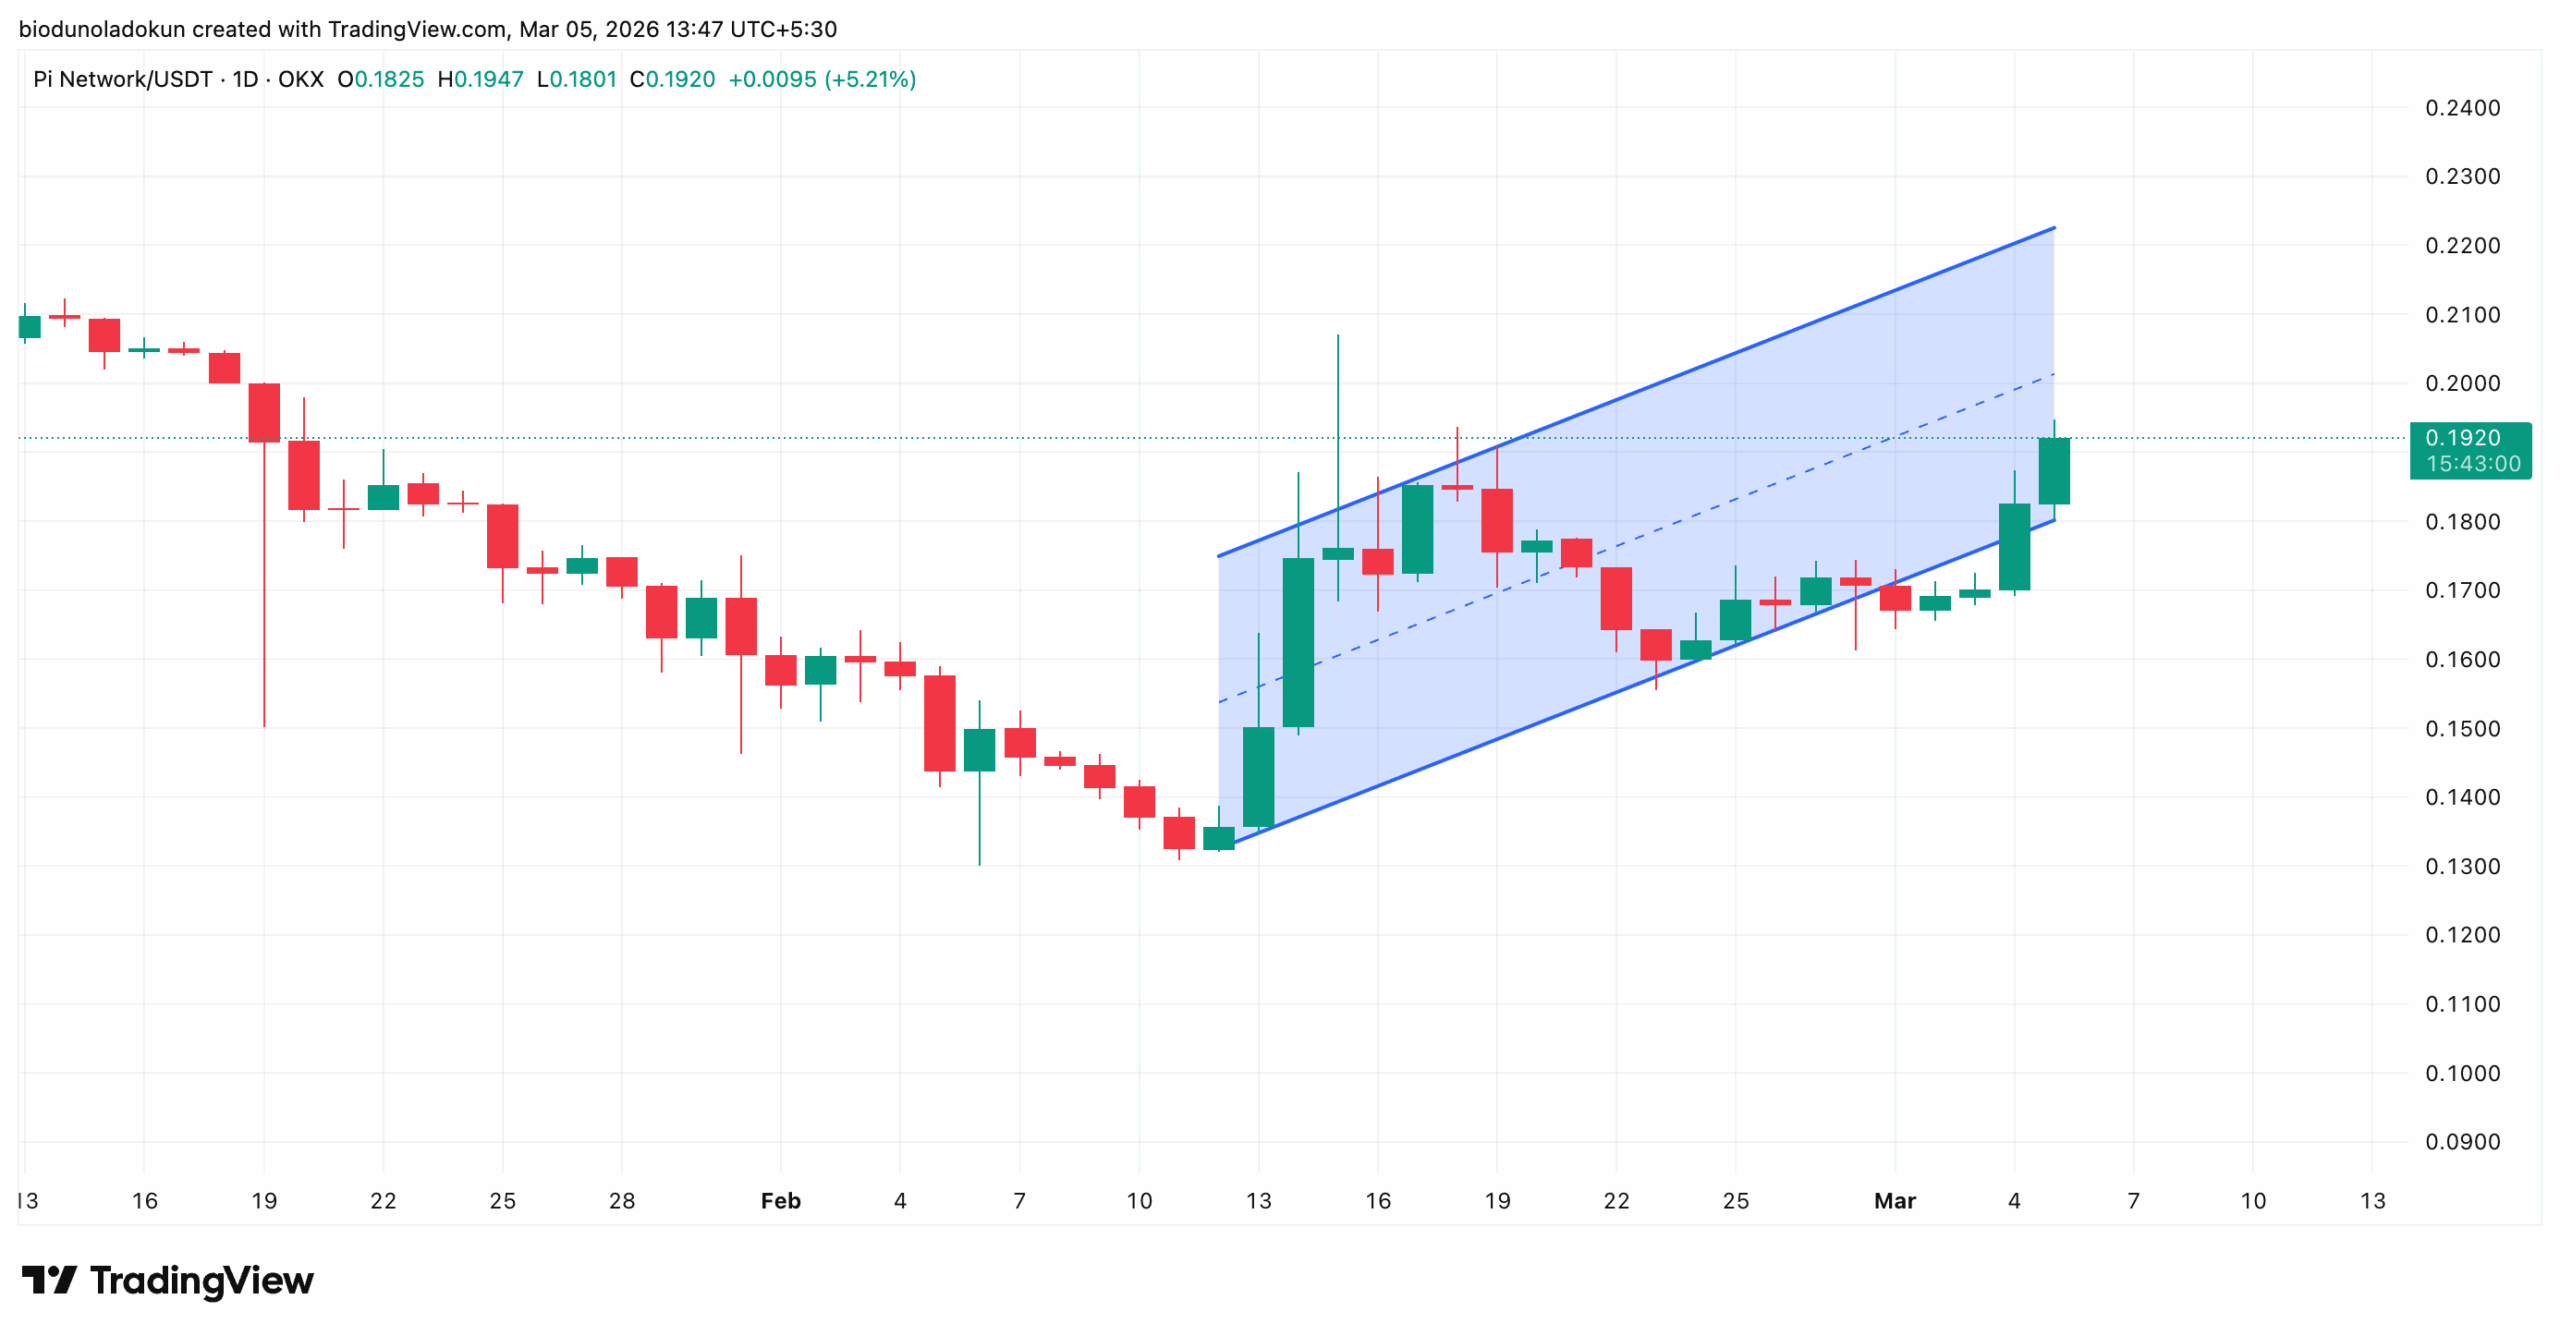
PI Coin’s Price Structure Tells a Bullish Story
An assessment of PI’s price performance on the daily chart shows that it declined through late January and into early February, bottoming out near $0.13 on February 12.
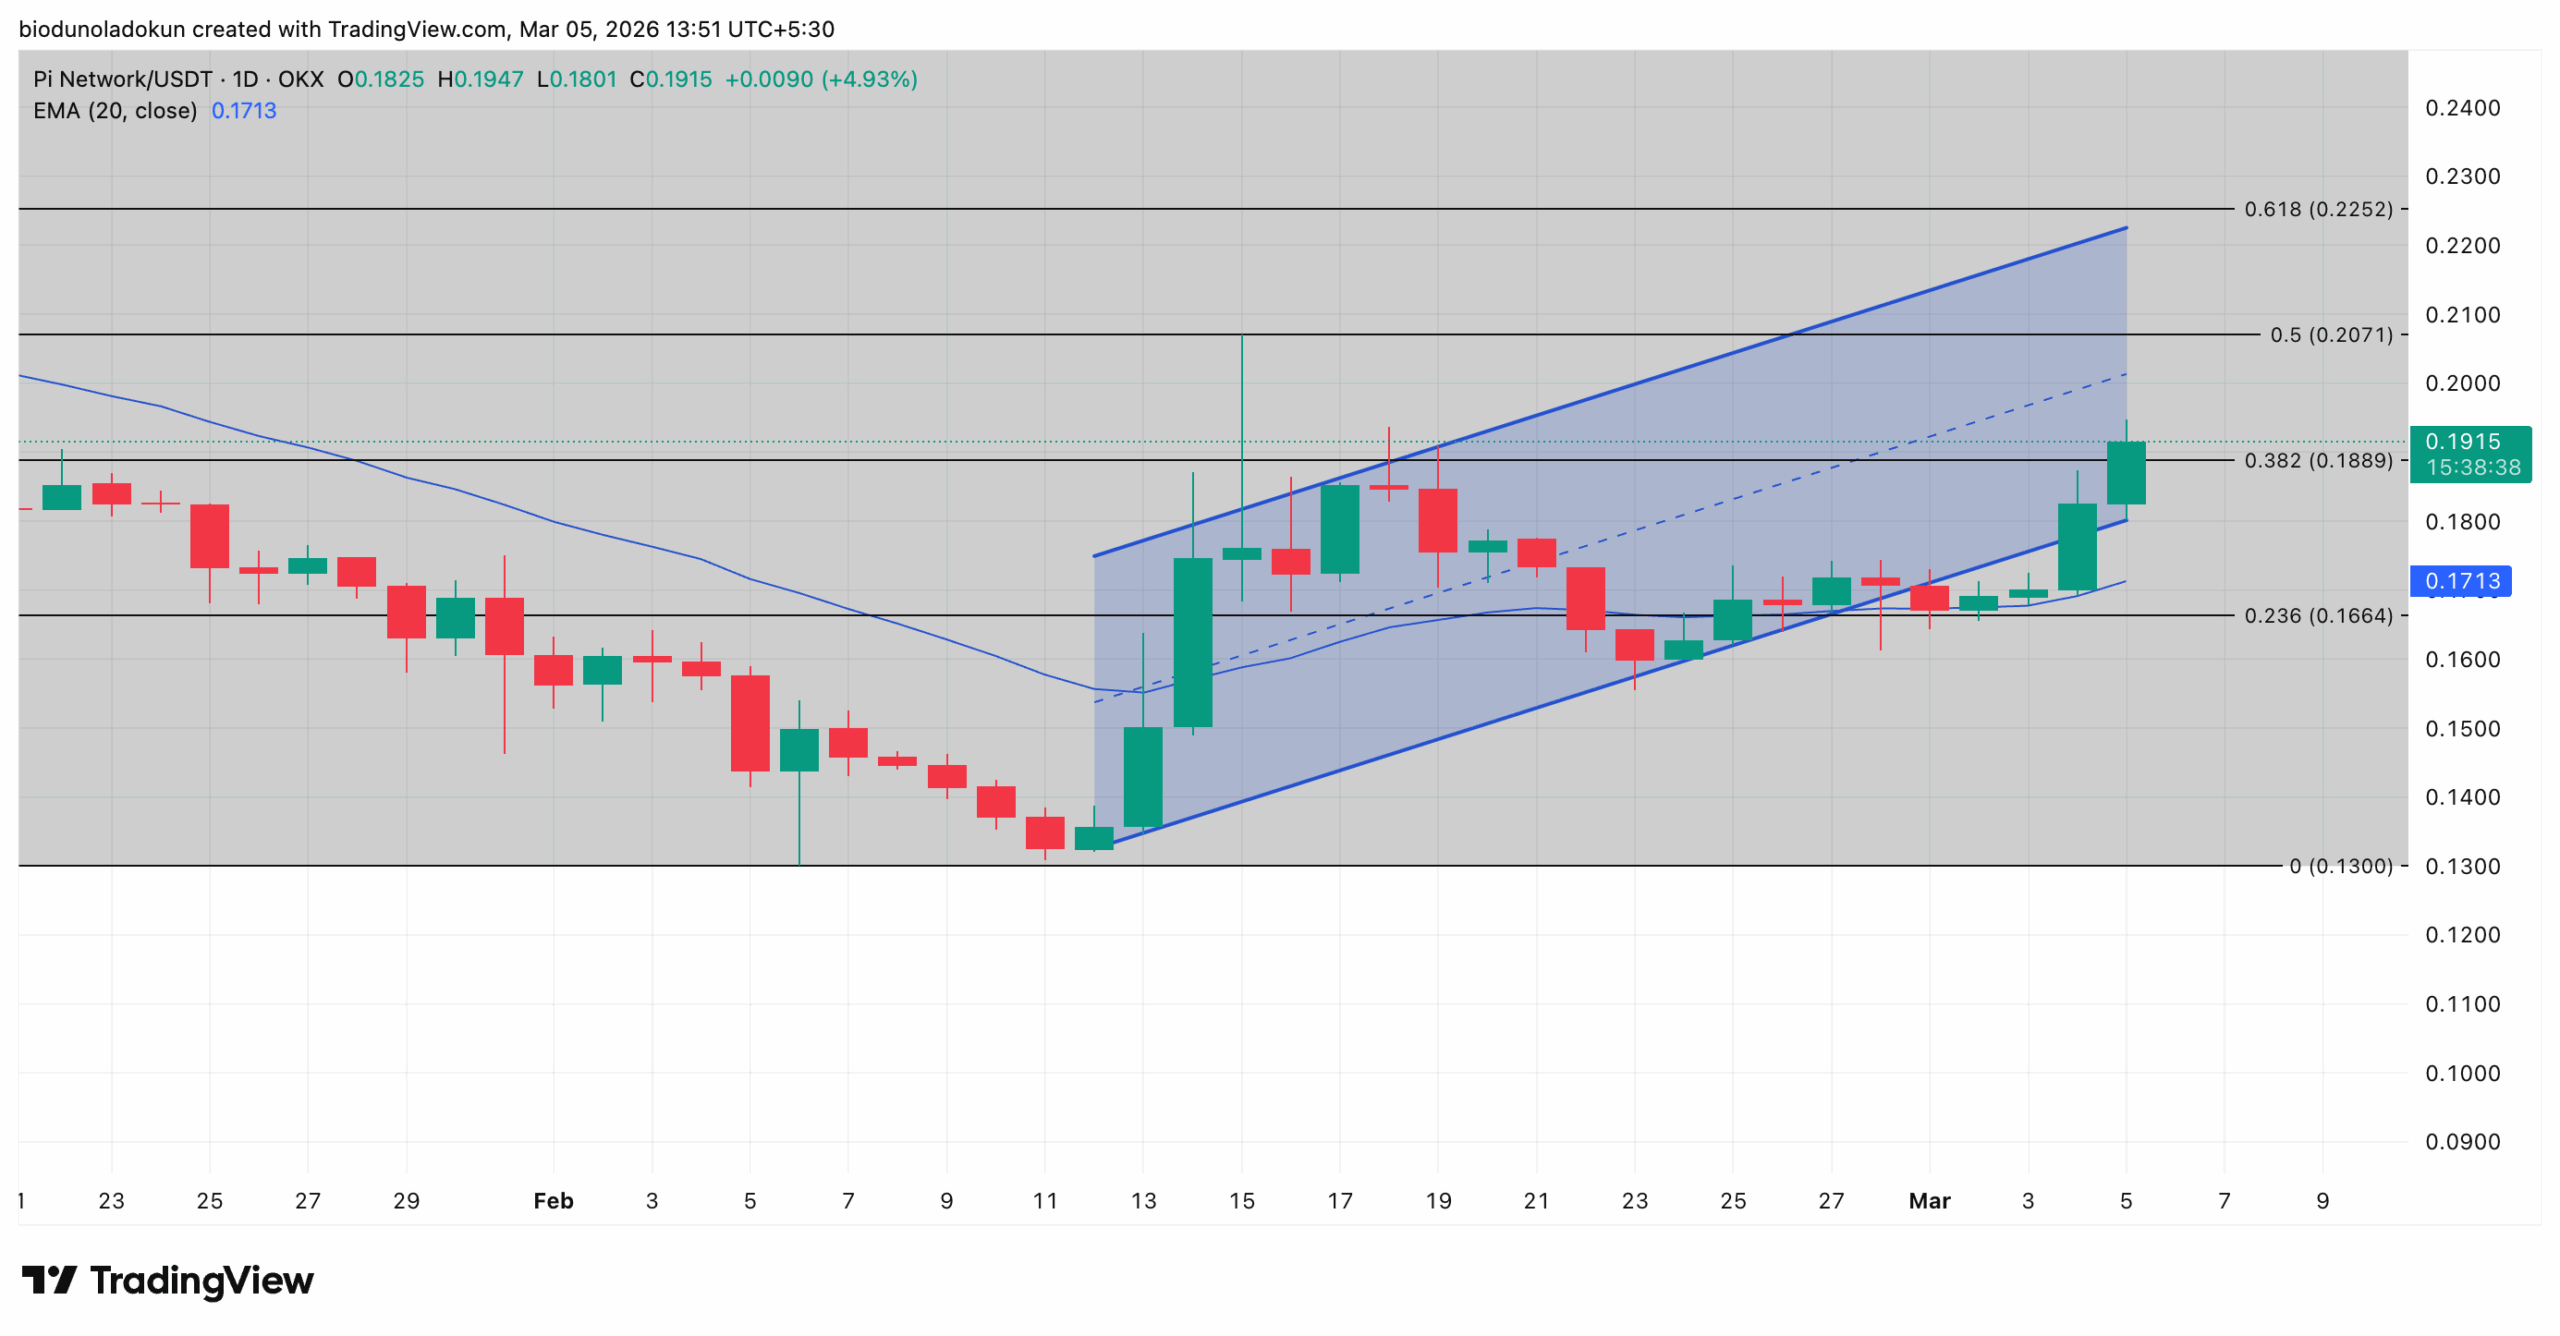
After this, sentiment flipped positive, and PI has since trended within an ascending parallel channel. This pattern is formed when an asset’s price makes higher lows and higher highs within a defined upward-sloping range.
The RSI indicator measures an asset’s overbought and oversold market conditions. It ranges between 0 and 100. Values above 70 suggest the asset is overbought and due for a price decline, while readings below 30 indicate sellers have oversold the asset and a rebound may be due.
At 65.54, PI’s RSI indicates the token is approaching overbought territory but has not yet crossed the critical 70 threshold.
This suggests there is still meaningful room for upside before the rally risks becoming overextended. In other words, buying momentum is strong, but buyers are not yet exhausted.
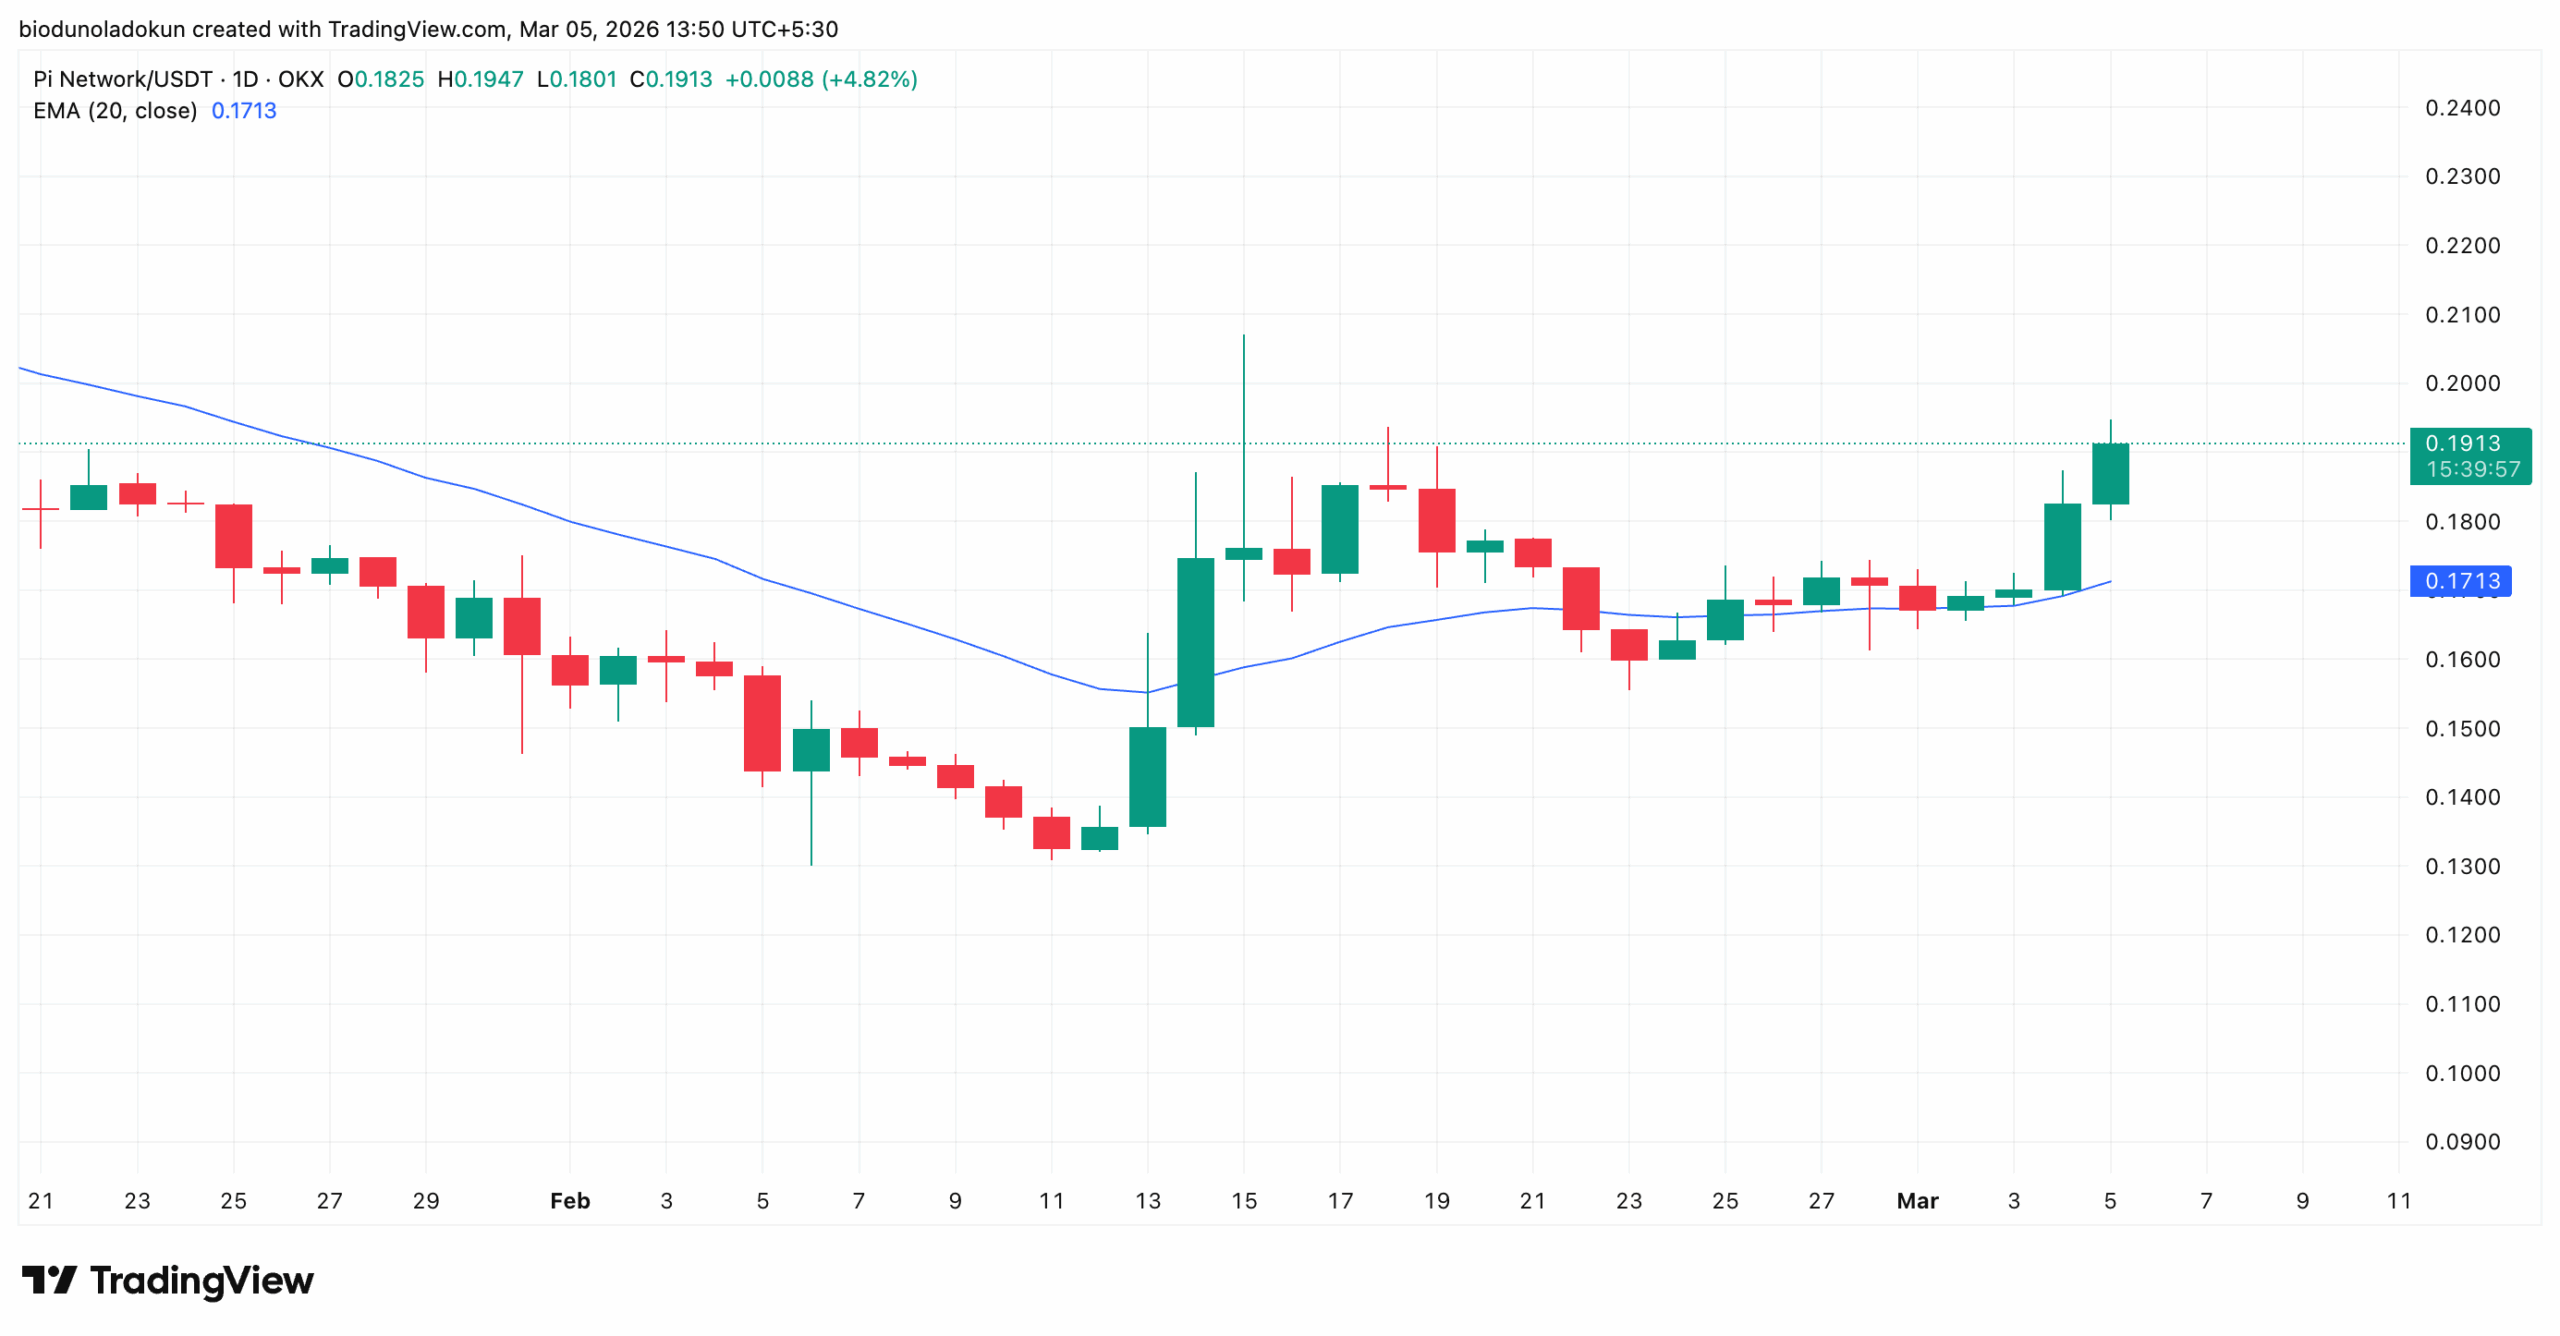
Furthermore, PI trades above its 20-day exponential moving average (EMA) at $0.171, a level that previously acted as resistance during the downtrend.
It now forms a support floor below PI’s price, absorbing any downward push from the bears.
If profit-taking resumes, this bullish outlook will be invalidated. In that scenario, PI may fall toward its 20-day EMA line. Should it fail to hold, PI risks plunging to $0.166, a level below the ascending parallel channel.
Disclaimer:
The information provided in this article is for informational purposes only. It is not intended to be, nor should it be construed as, financial advice. We do not make any warranties regarding the completeness, reliability, or accuracy of this information. All investments involve risk, and past performance does not guarantee future results. We recommend consulting a financial advisor before making any investment decisions.
Abiodun Oladokun is a Research Analyst at CCN, where he covers cryptocurrency markets with a focus on on-chain analysis, technical assessments, and emerging trends across decentralized finance (DeFi), real-world assets (RWA), artificial intelligence (AI), decentralized physical infrastructure networks (DePIN), Layer 2s, and meme coins.
Prior to CCN, he served as a Senior On-Chain Analyst at BeInCrypto, producing market reports spanning diverse crypto sectors.
Before that, he conducted technical analysis and market assessments of various altcoins at AMBCrypto, where he also contributed long-form quarterly research papers on DeFi, NFTs, DAOs, and scaling architectures, leveraging on-chain platforms including Messari, Santiment, DefiLlama, and Dune Analytics.
He began his crypto career as a research analyst at SixthSense DAO, developing blockchain forensic tools to trace the history of stolen assets.
Abiodun is a lawyer called to the Nigerian Bar and the founder of Ilé Ijó, a Lagos-based electronic dance music collective.