Will PI Fall to a New All-Time Low? | Credit: Hameem Sarwar
Share
Key Takeaways
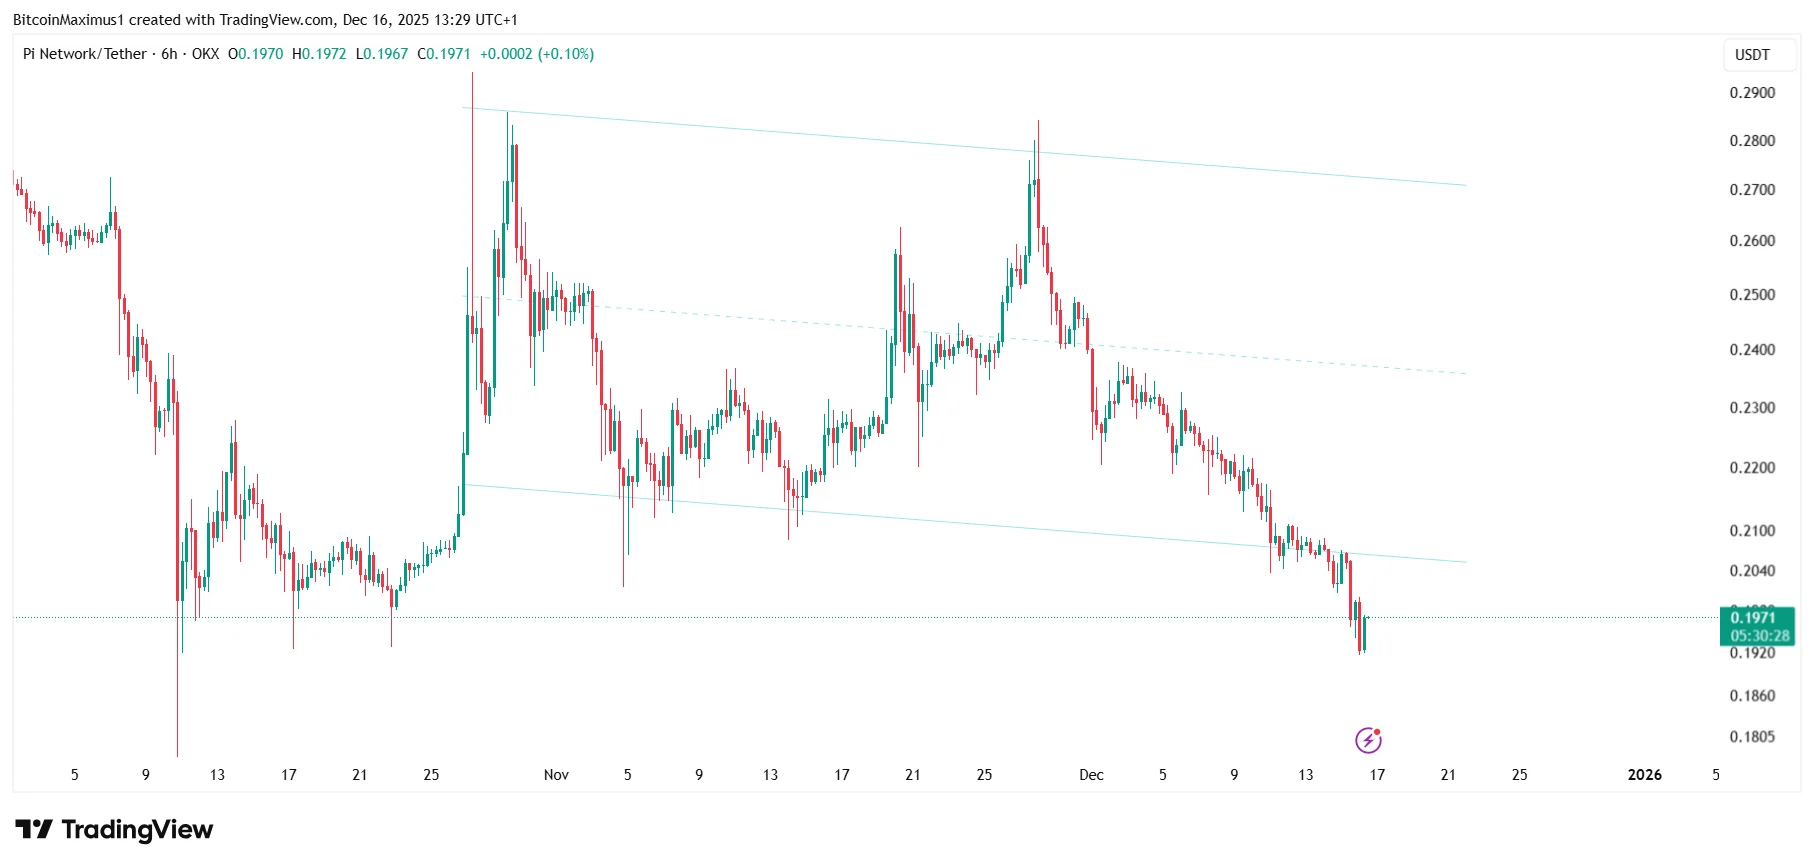
Pi Network has broken above a long-standing resistance trend line. Pi Network is still moving within a descending parallel channel. The key question now is whether PI has formed a bottom or if another decline is coming this year.
Pi Coin has finally broken out above its long-term resistance for the first time since its launch.
Despite this technical breakout, price action has failed to show strong follow-through, leaving traders uncertain about whether further losses lie ahead.
With PI still trading nearly 95 percent below its initial peak and hovering around a crucial support level, the next move could define its trajectory for 2026.
Here is what the charts are currently signaling.
Pi Network Price Analysis
The price of PI has been in a steep downward trend since its launch in March.
To date, the token has lost roughly 95 percent of its value, bottoming at $0.152 on October 10.
After that low, PI attempted a recovery but initially failed to break above its descending resistance line.
Get These Top Crypto Casino Offers Now!
Sponsored
Disclosure
We sometimes use affiliate links in our content, when clicking on those we might receive a commission at no extra cost to you. By using this website you agree to our terms and conditions and privacy policy.
While the long-term breakout initially raised optimism, fading momentum, repeated resistance rejections, and bearish indicator readings all suggest one more decline may occur before any meaningful recovery.
If PI manages to reclaim its short-term channel, it could start a short-term bounce.
Failure to do so, however, would invalidate the bullish thesis and open the door to new lows.
Traders should pay close attention to how the price reacts at this support level, as it may determine Pi Coin’s direction for the remainder of the year.
Disclaimer:
The information provided in this article is for informational purposes only. It is not intended to be, nor should it be construed as, financial advice. We do not make any warranties regarding the completeness, reliability, or accuracy of this information. All investments involve risk, and past performance does not guarantee future results. We recommend consulting a financial advisor before making any investment decisions.
Valdrin Tahiri is a cryptocurrency analyst and reporter at CCN, specializing in technical analysis with a focus on Elliott Wave theory, on-chain metrics, and fundamental research. He brings over seven years of experience in the crypto space as both a trader and writer.
He discovered cryptocurrencies in 2017 while earning his MSc in Financial Markets at the Barcelona School of Economics, which sparked a deep interest in blockchain and market dynamics. Since then, he’s contributed to top crypto outlets like BeInCrypto and CoinGape.
Valdrin also served as Community Manager of BeInCrypto’s Telegram group for three years, helping grow it into one of the largest crypto communities worldwide. His expertise in market structure and price patterns allows him to break down complex trends into clear, actionable insights.
He’s published thousands of articles covering altcoins, Bitcoin cycles, and macro trends.